MIR — AI Stock Forecast & Price Targets
Published 9/1/2026 · A free sample of K3vl4r’s AI-powered analysis.
Kronos price forecasts, scored fundamentals & technicals, and a multi-horizon plan.
View the live MIR price forecast →
MIR presents a classic high-growth/high-valuation dilemma: strong secular demand in nuclear and medical sectors is evident through accelerating revenue (Q2 growth of 19.7% YoY) and robust order books, but this potential is severely hampered by extreme valuation metrics (trailing P/E ~168x) and unproven conversion of top-line growth into durable GAAP profit. The recent $250M buyback offers a modest floor signal, but the stock remains technically fragile below key moving averages, suggesting caution until profitability validates the premium multiple.
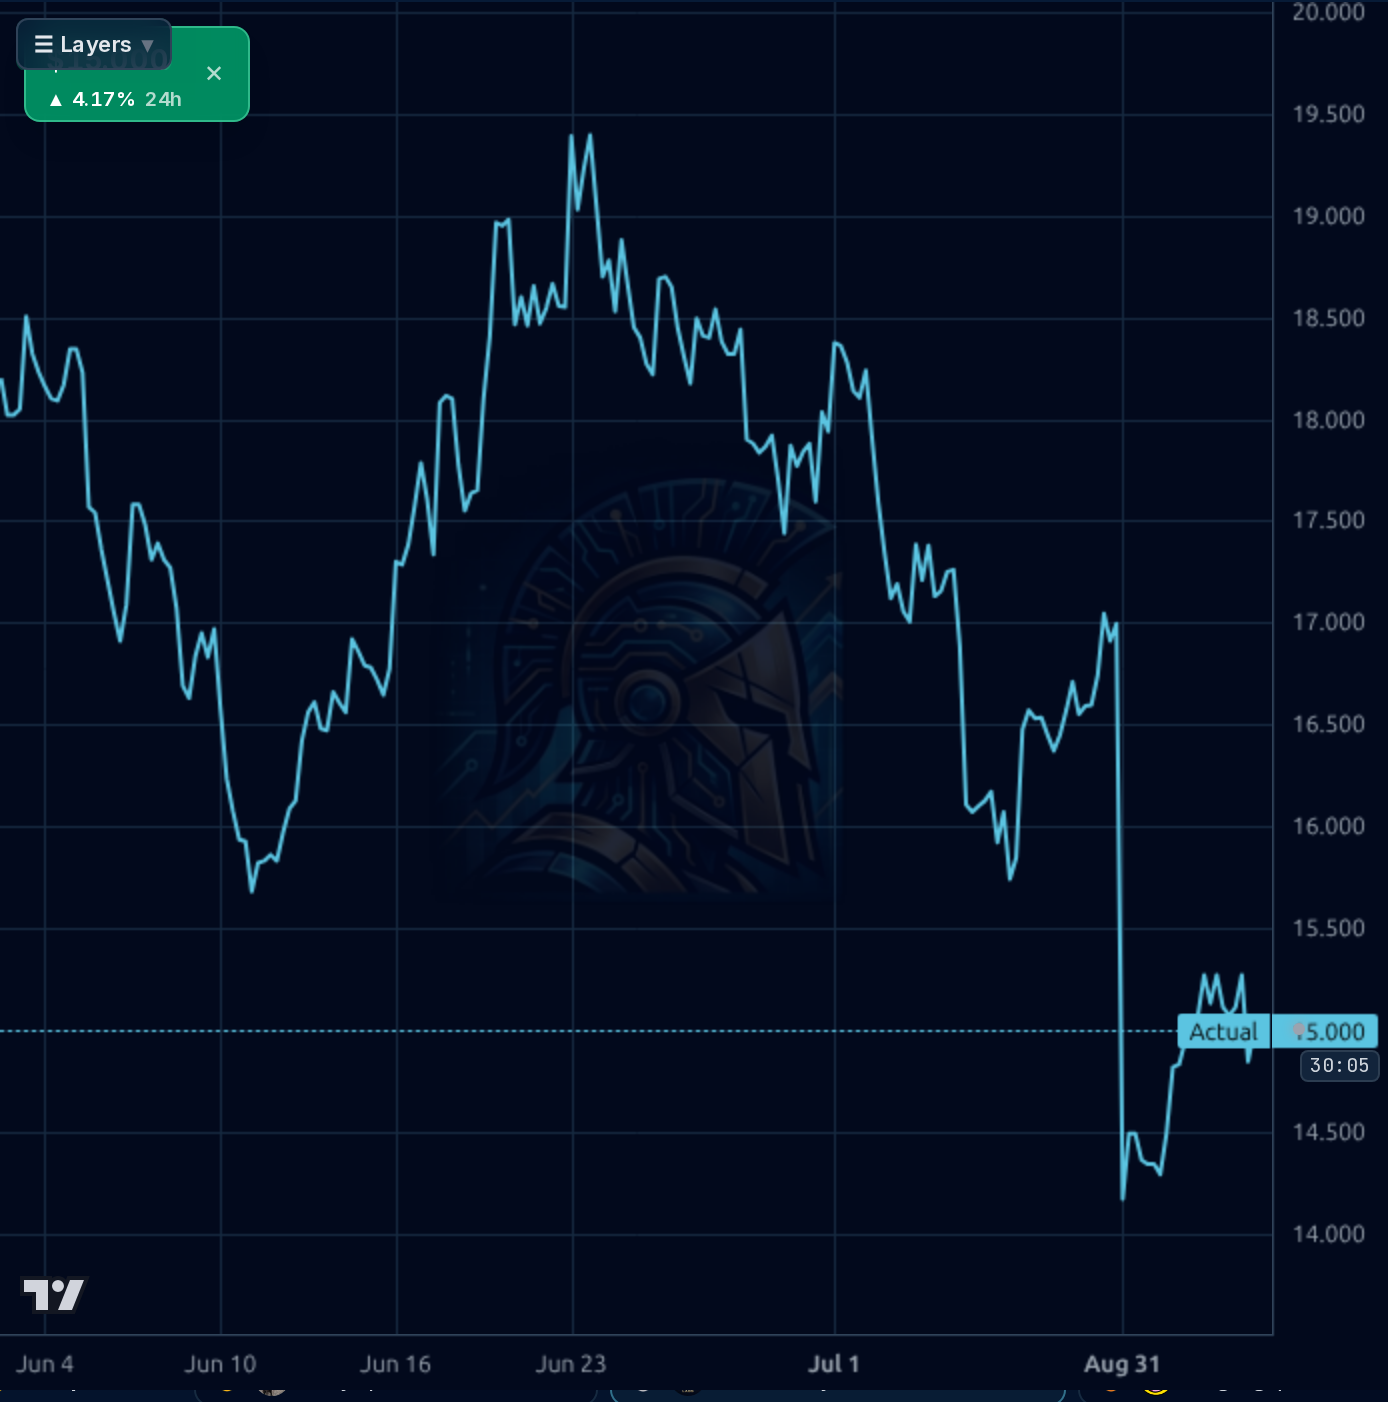
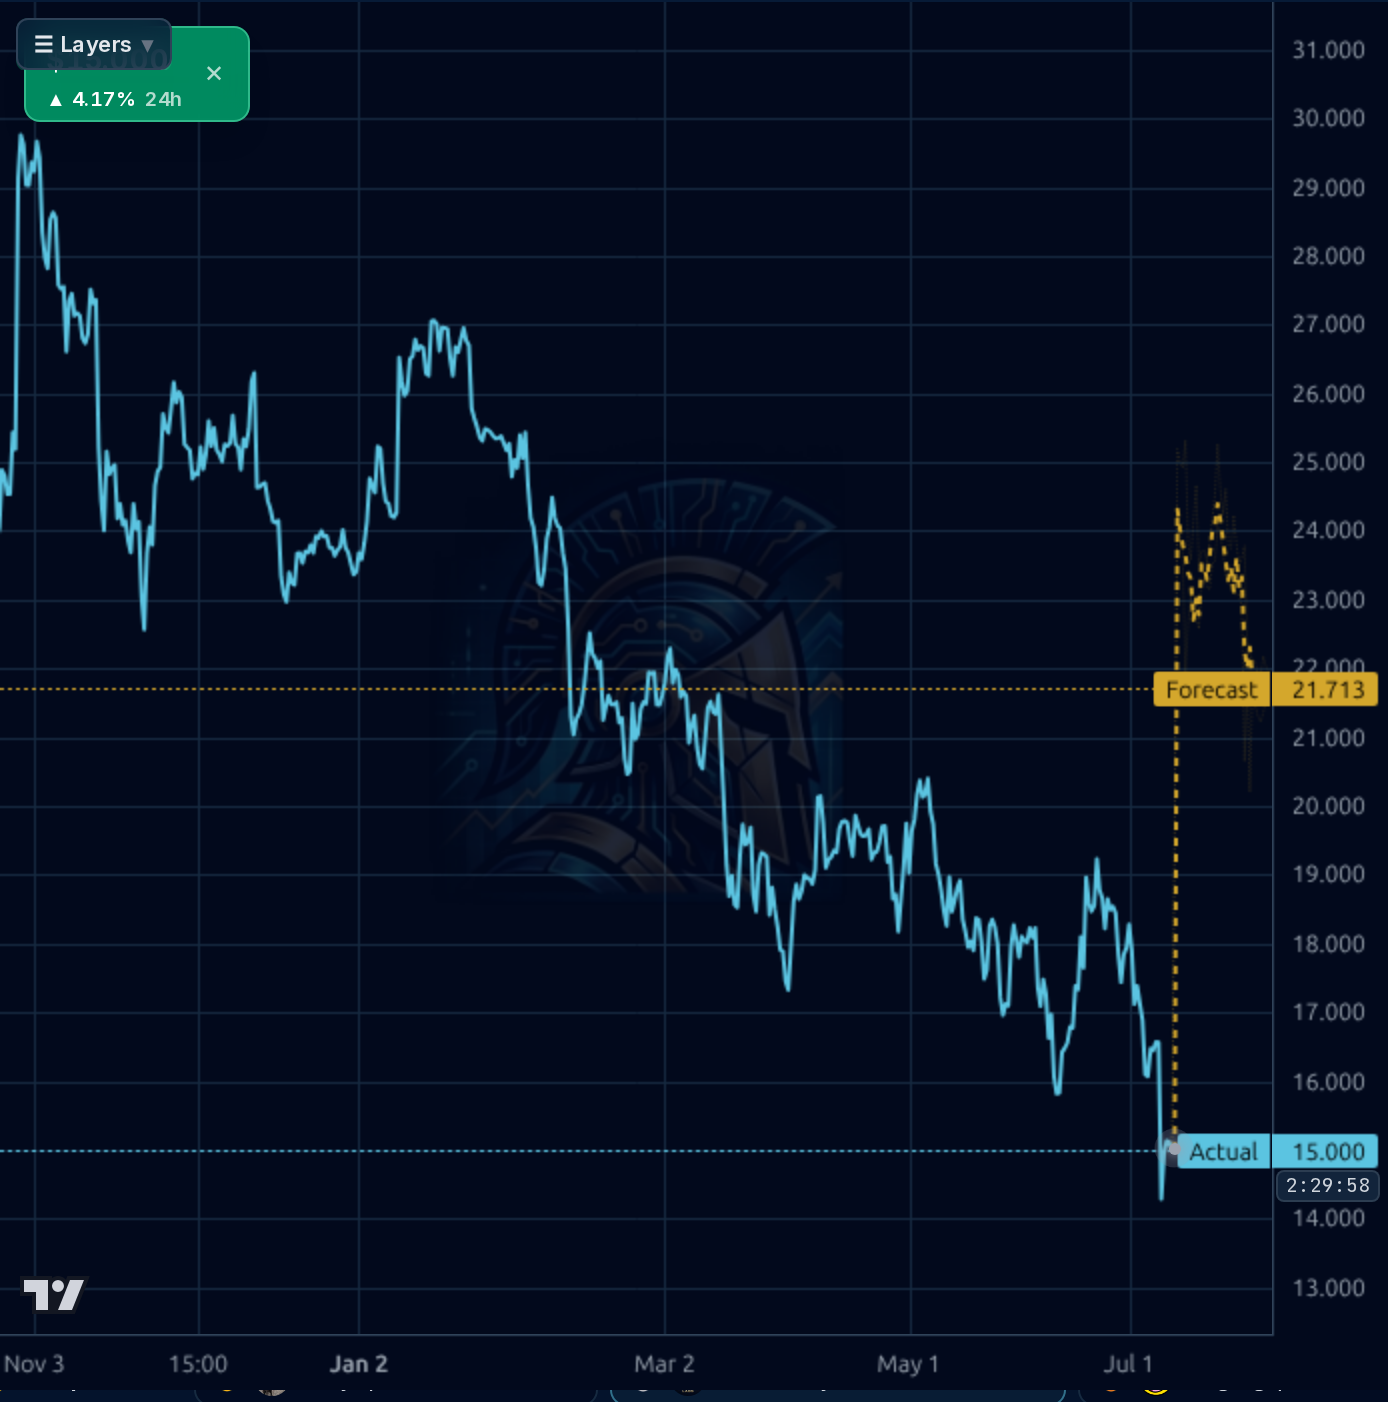
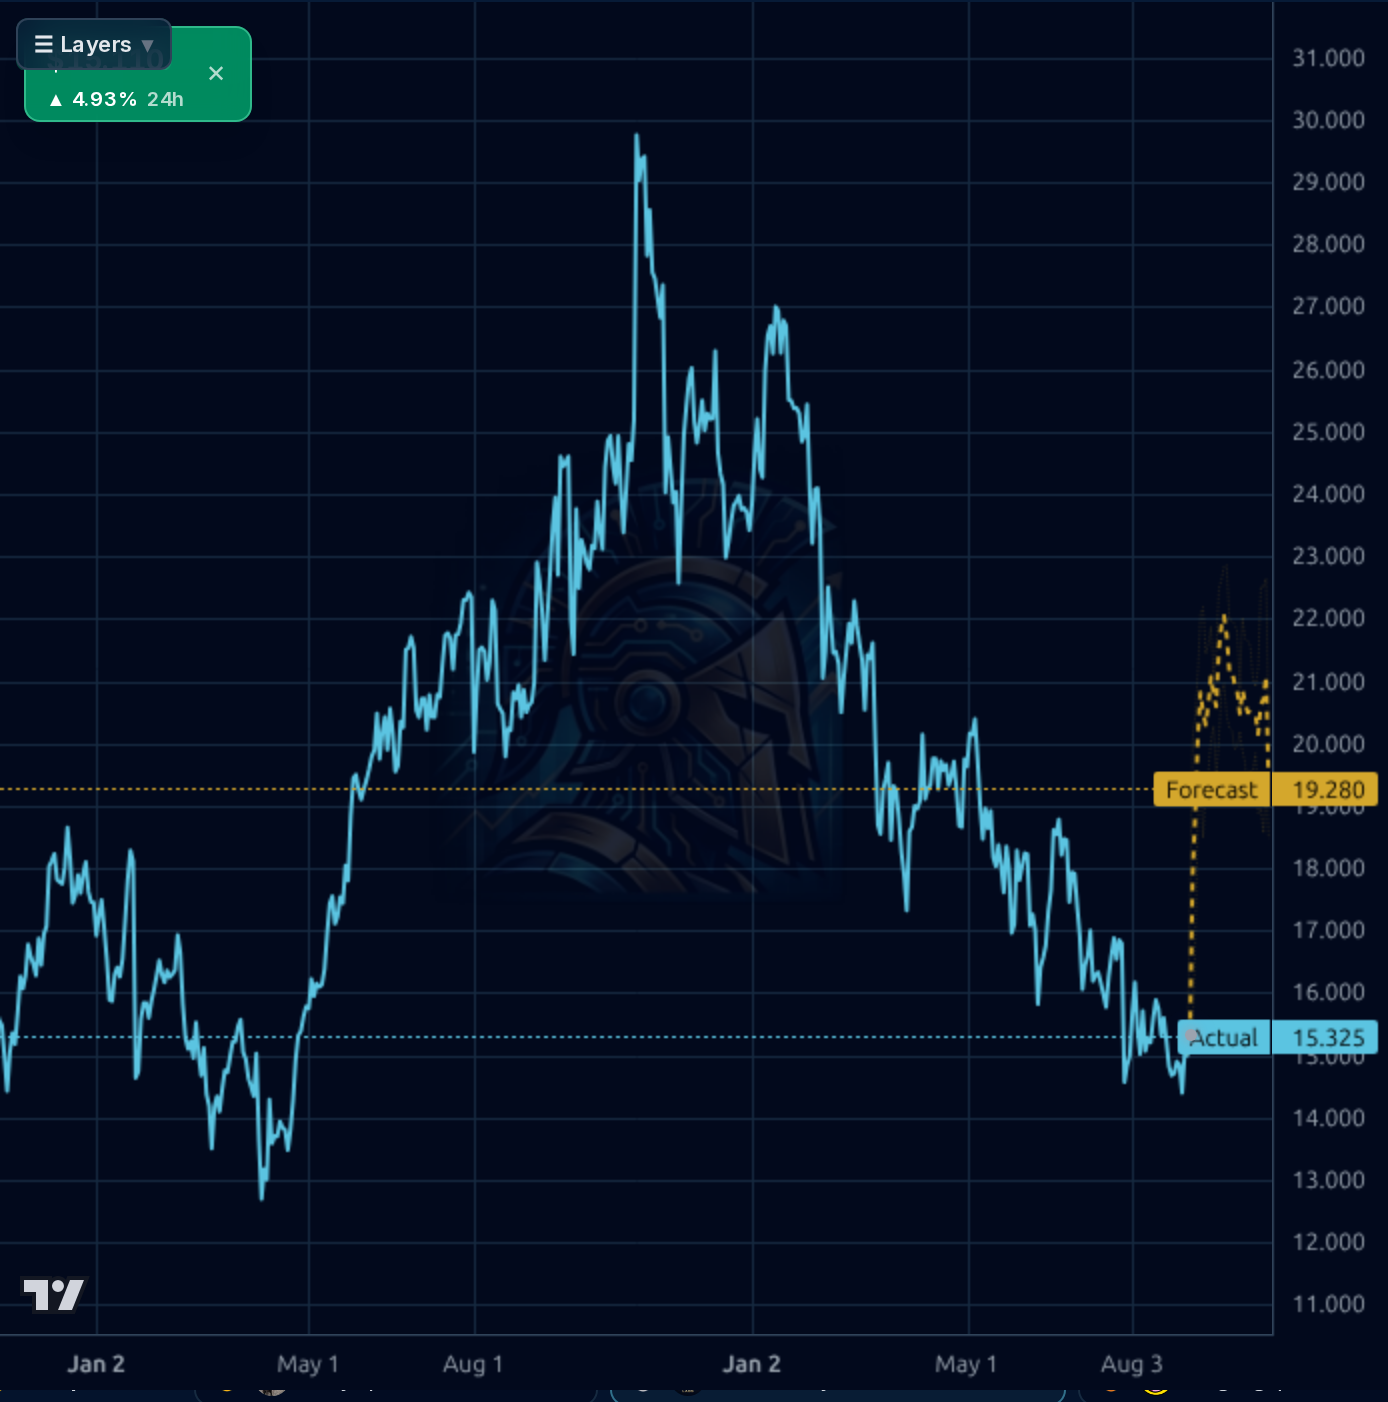
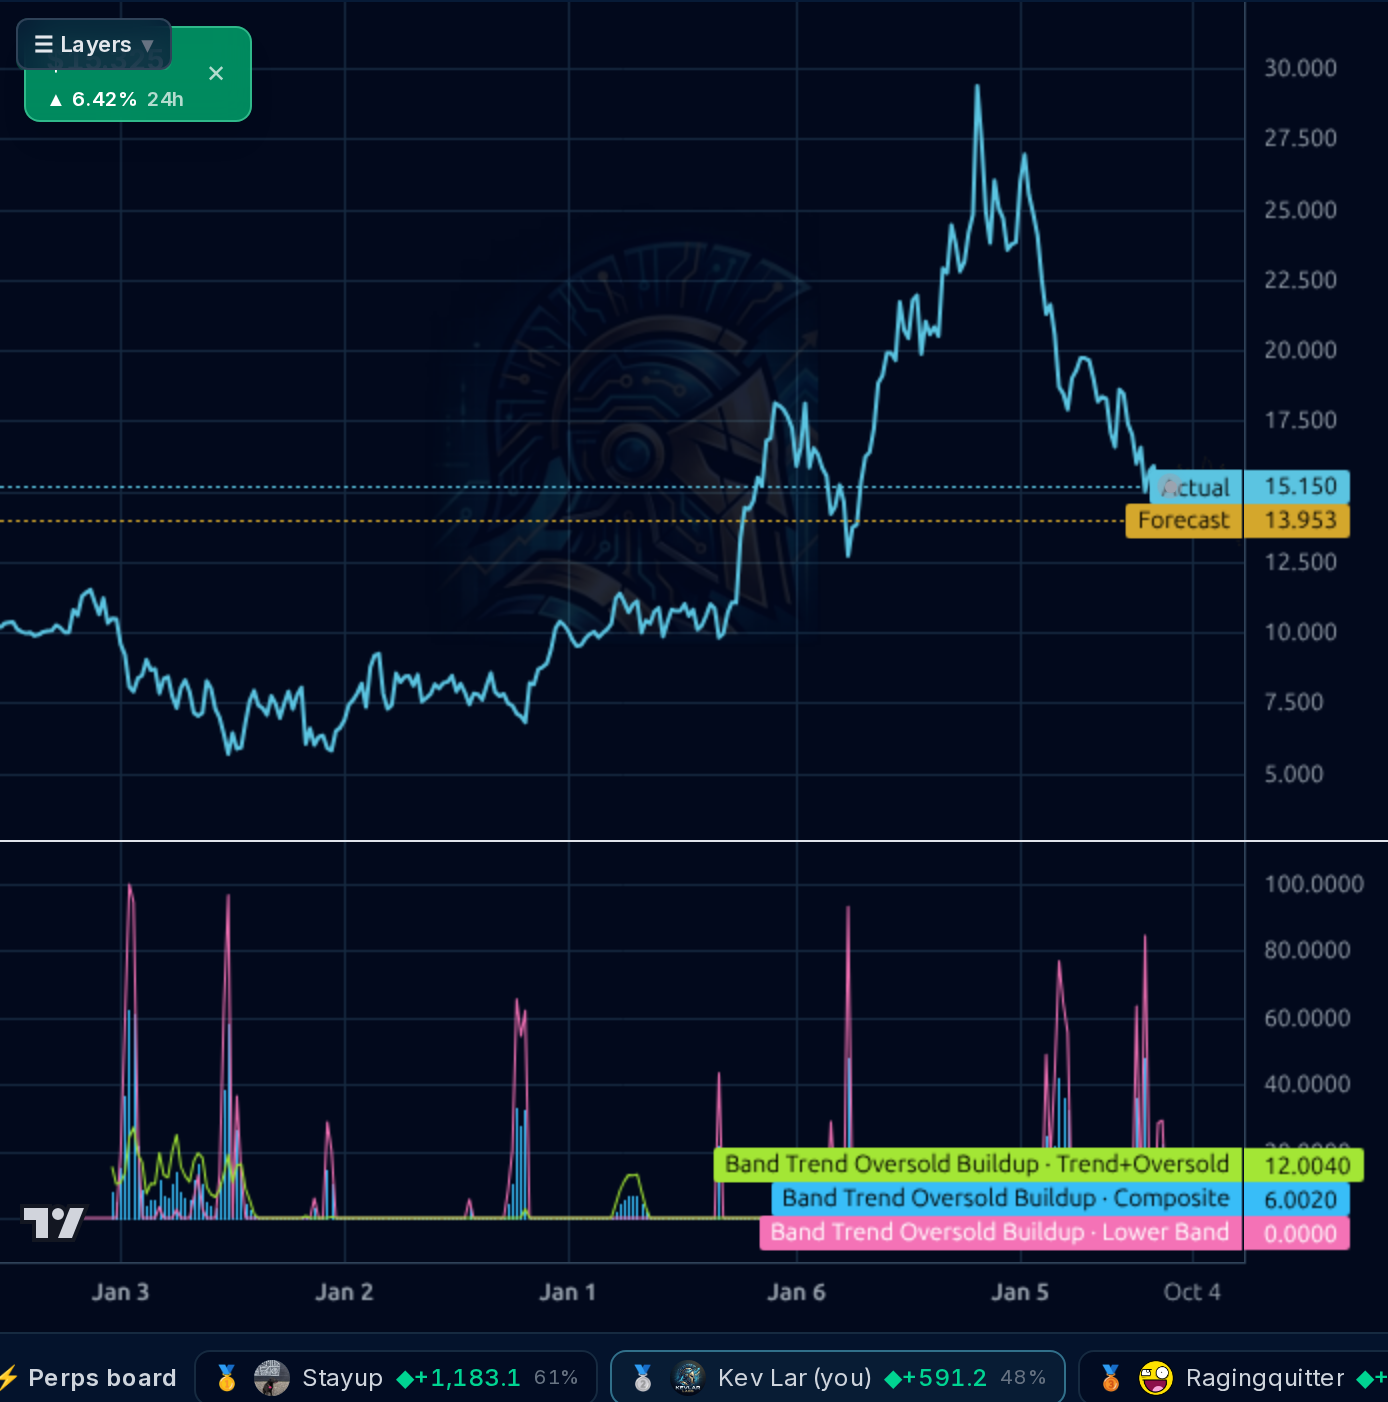
Maintain a cautious stance; wait for confirmation that the $14.11 52-week low holds or breaks decisively. A clear break above the $16.30 resistance level, ideally accompanied by positive Q3 FCF guidance, would be required to initiate accumulation. Invalidation below $13.00 suggests continued weakness.
The thesis hinges entirely on sustained Free Cash Flow (FCF) inflection—specifically, if annualized FCF can exceed $150M and GAAP margins expand significantly beyond the current 2.4%. If Q3 earnings confirm this operational improvement, a base case target of $16.50 becomes more credible; otherwise, the valuation gap is too wide.
The long-term thesis remains tied to secular growth in nuclear energy and medical imaging technology. The biggest structural risk is that high capital expenditure requirements combined with thin current profitability will lead to a prolonged period of cash burn or necessitate further dilution if capex outpaces operational cash generation.
Revenue shows positive momentum with Q2 revenue at $266.8M (up from $257.6M in Q1), indicating a 19.7% YoY growth rate mentioned in prior reports and supported by the 'Q2 orders +42% YoY' narrative. Gross margins are improving, moving from 46.2% (Q1) to 49.9% (Q2), suggesting operating leverage is beginning to flow through the Medical segment. However, profitability remains questionable; ROE is low at 1.51%, and the trailing P/E of 167x against a meager $0.09 EPS suggests that current earnings do not support the market's valuation expectations. The balance sheet shows significant debt ($1.23B) relative to cash flow, which requires careful monitoring.
The technical picture is bearish despite recent price action bouncing near the 52-week low of $14.11. The stock is trading significantly below key moving averages (SMA20: -1.08%, SMA50: -6.69%, SMA200: -25.38%), indicating a deep downtrend that has not been resolved. While the model's 1-day forecast accuracy is low (28% vs 73% naive baseline), the longer-term view suggests caution, as prior analysis noted failure to reclaim $16.30/$16.16 resistance zones. The current price action appears range-bound near support levels, awaiting a catalyst to break structure.
The most material news is the announcement of a $250 million buyback authorization (SEC 8-K on 8/31), which acts as an opportunistic floor signal by management. Sectorally, the narrative remains strong around the 'nuclear capex supercycle' and medical dosimetry demand, supported by reports of surging nuclear orders. However, this positive news is counterbalanced by general market skepticism reflected in analyst price target cuts and the stock trading at such a premium valuation.
- Sustaining the positive momentum seen in Q2's 19.7% YoY revenue growth, particularly validating the 'Q1 orders +42% YoY' backlog visibility through organic contract wins.
- Extreme valuation multiples (P/E ~168x) mean any GAAP profitability miss will be severely punished by the market.
- The stock is technically fragile, trading deep below key moving averages and near multi-year support levels ($14.11).
- High debt load relative to current free cash flow generation presents balance sheet risk if capital expenditure demands increase.
Get AI analysis on any stock
This is one of hundreds of Kronos AI reports — scored fundamentals & technicals, bull/base/bear price targets, a multi-horizon plan, and continuously-updated forecasts across the market. Create a free account to explore them all.
Create your free account →Already a member? Sign in · Join our Discord