MLCO — AI Stock Forecast & Price Targets
Published 8/5/2026 · A free sample of K3vl4r’s AI-powered analysis.
Kronos price forecasts, scored fundamentals & technicals, and a multi-horizon plan.
View the live MLCO price forecast →
MLCO sits at $5.58 with earnings on 2026-08-06, making any near-term positioning binary. The operational recovery is real (Q1 revenue +11% YoY, EBITDA +21% sequentially, EPS Q/Q +151%) and valuation is compressed at 6.8x forward P/E with a 0.35 PEG, but negative stockholders' equity of -$1.22B, $6.94B debt vs $942M cash, and a sub-1 current ratio keep this a leveraged cyclical bet rather than a clean compounder.
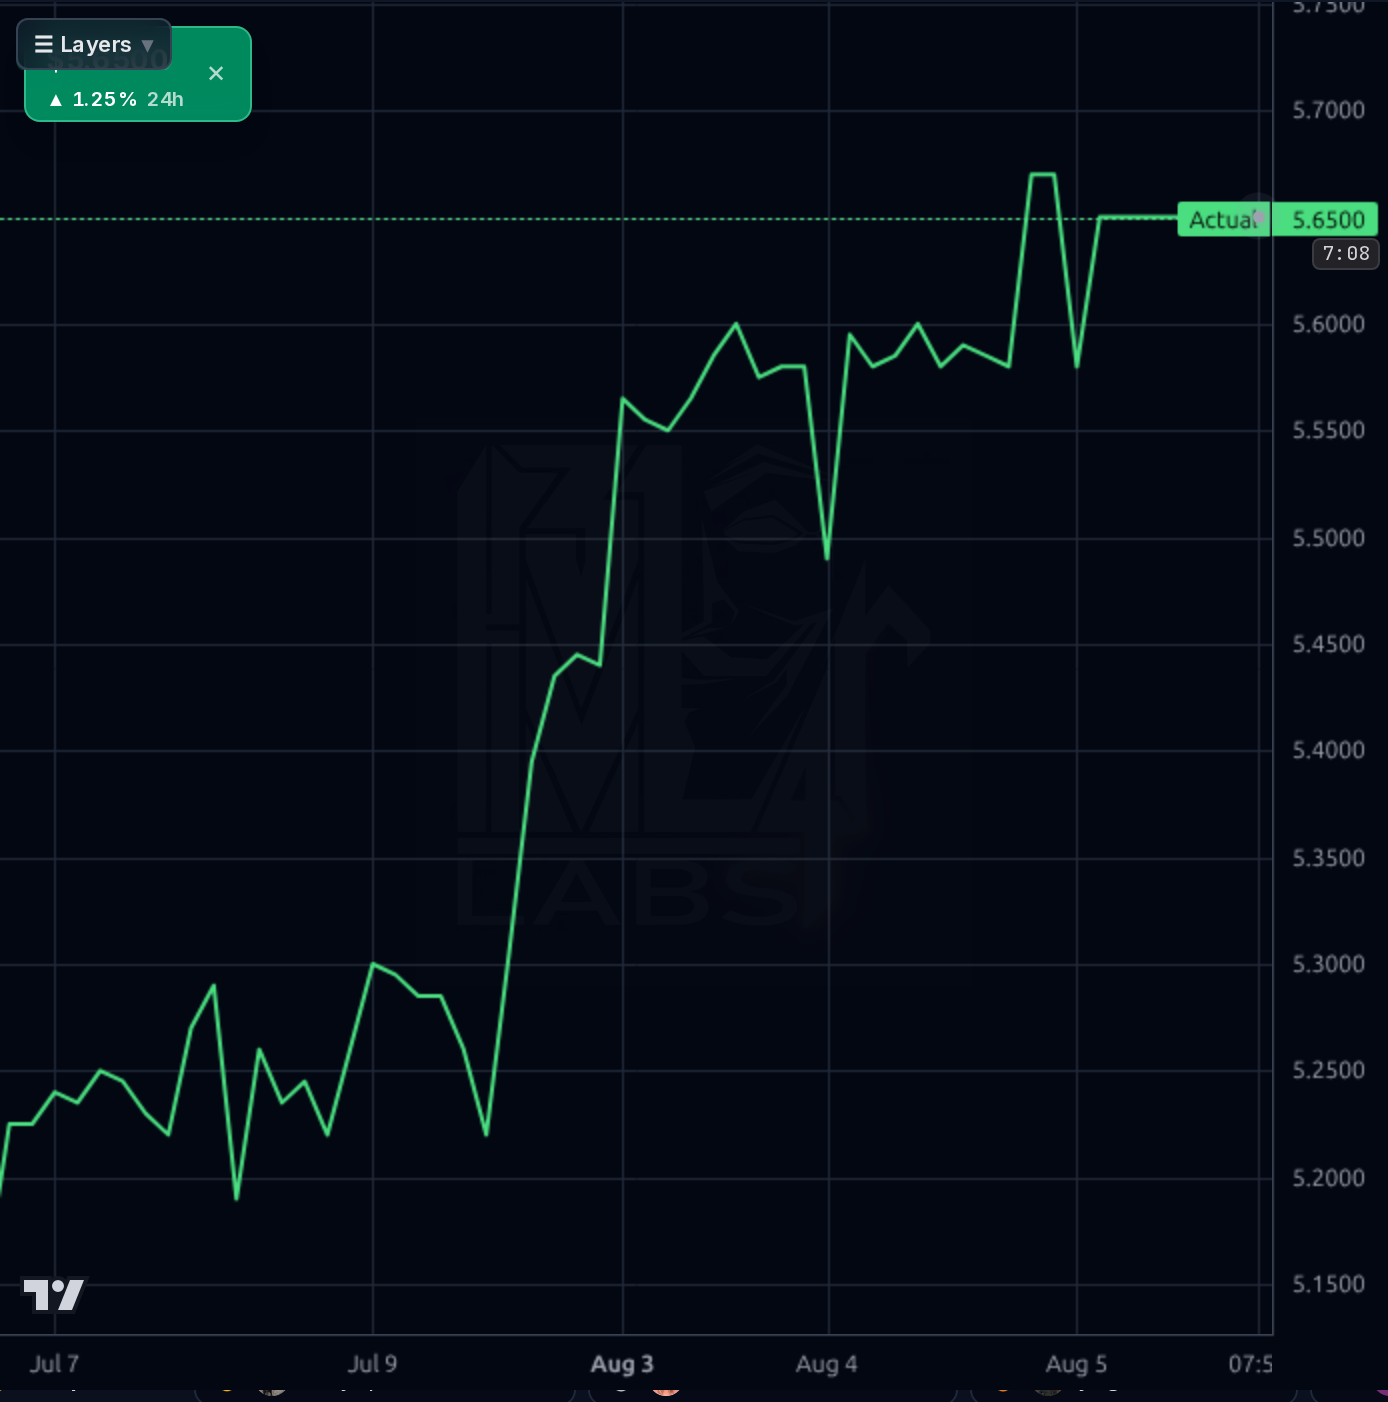
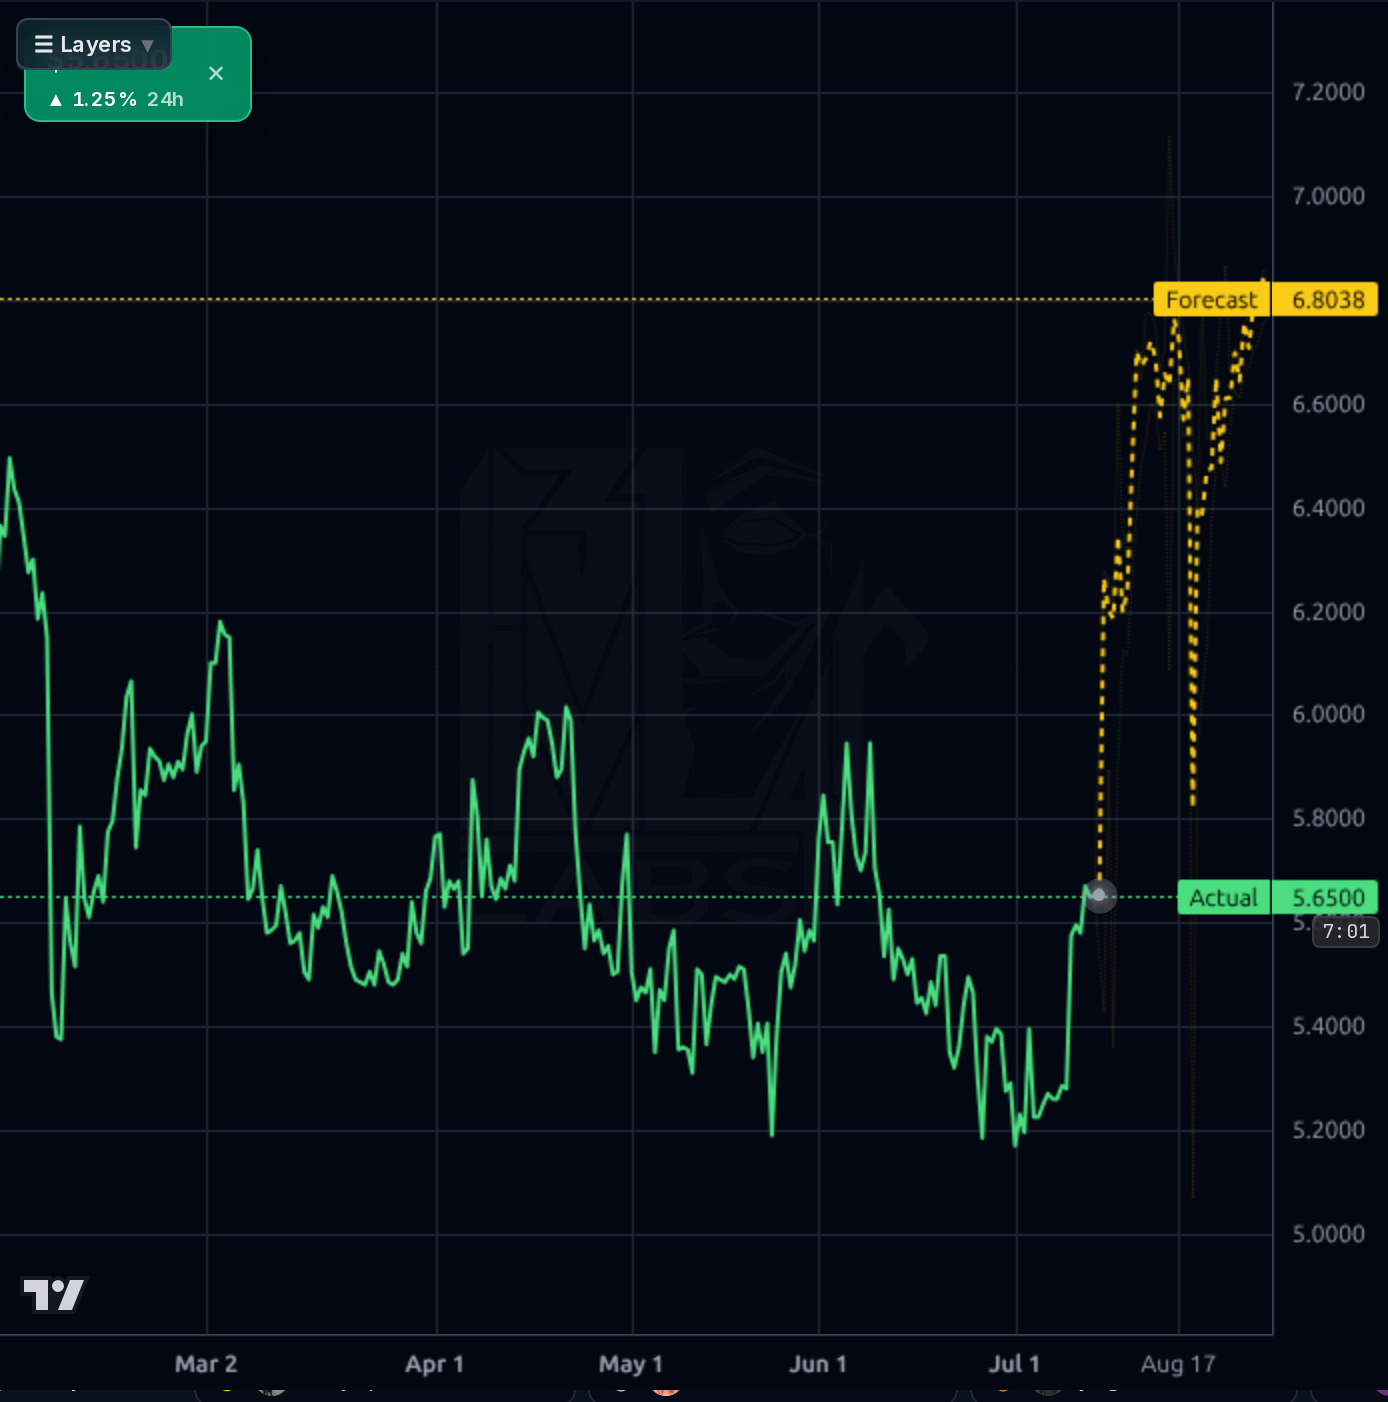
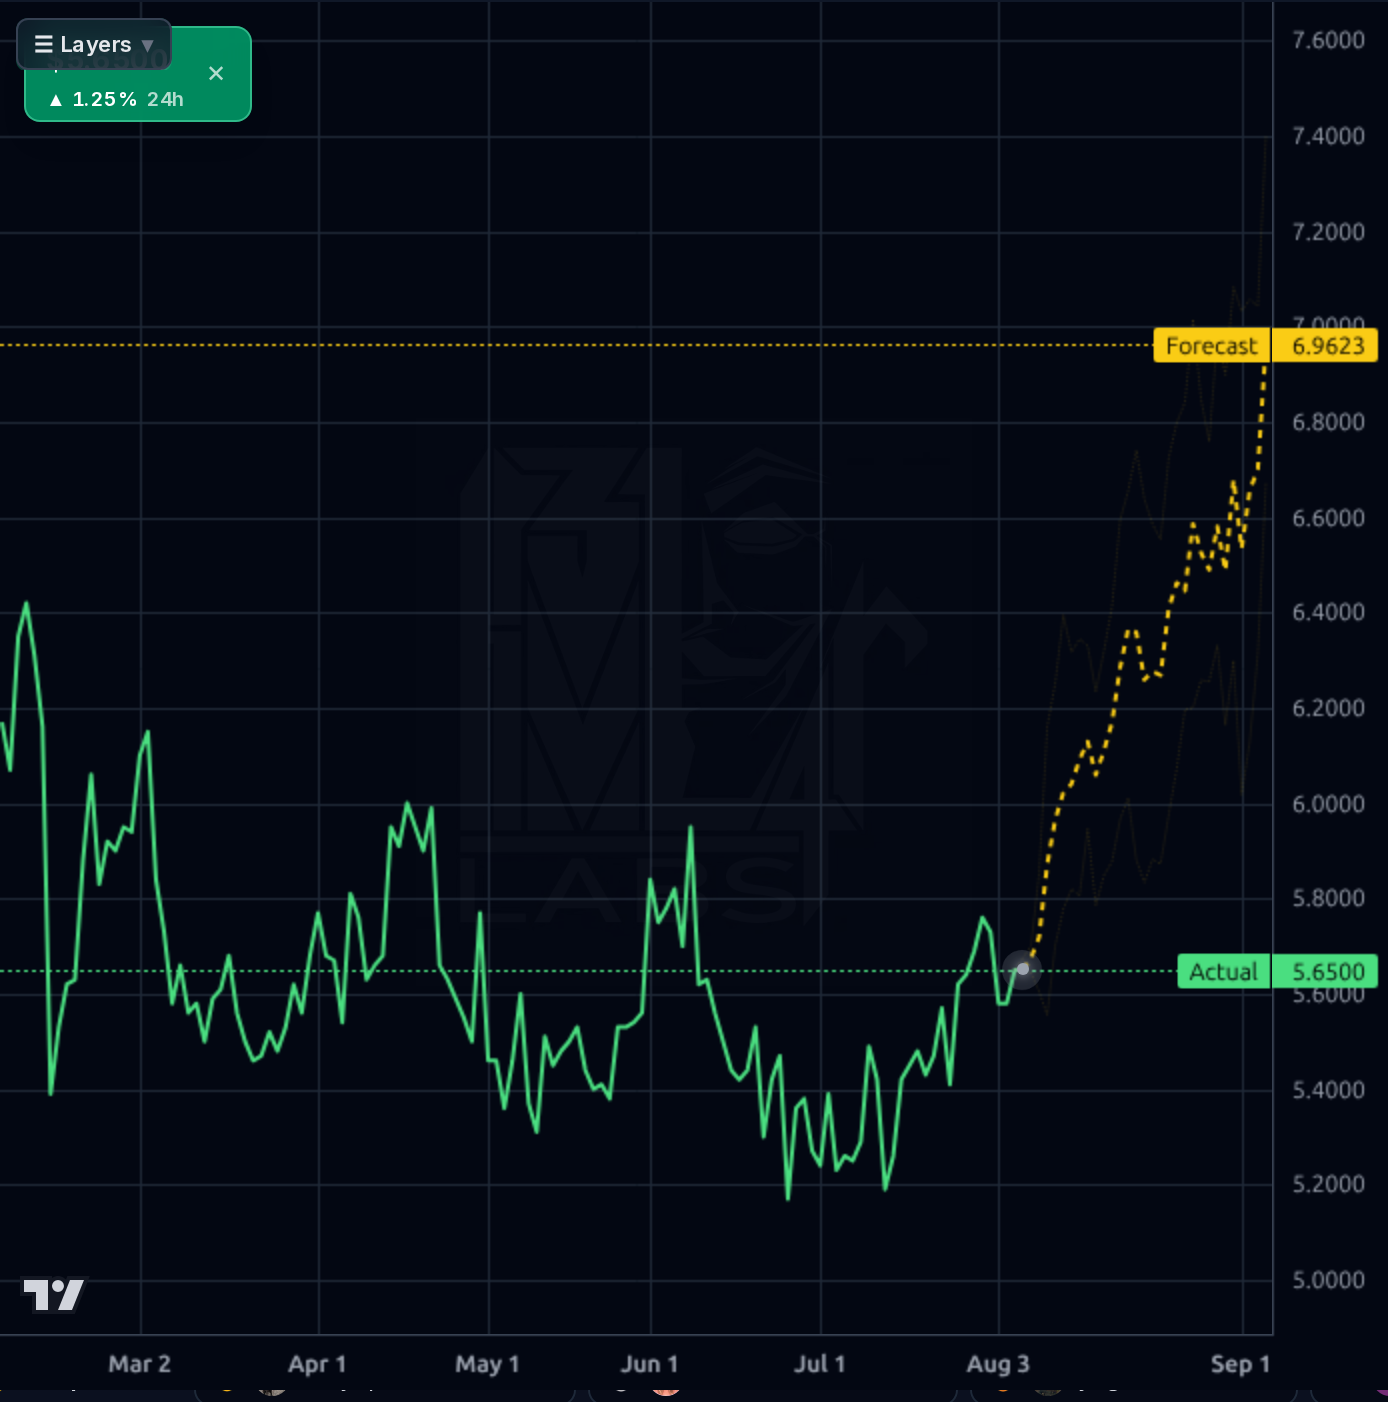
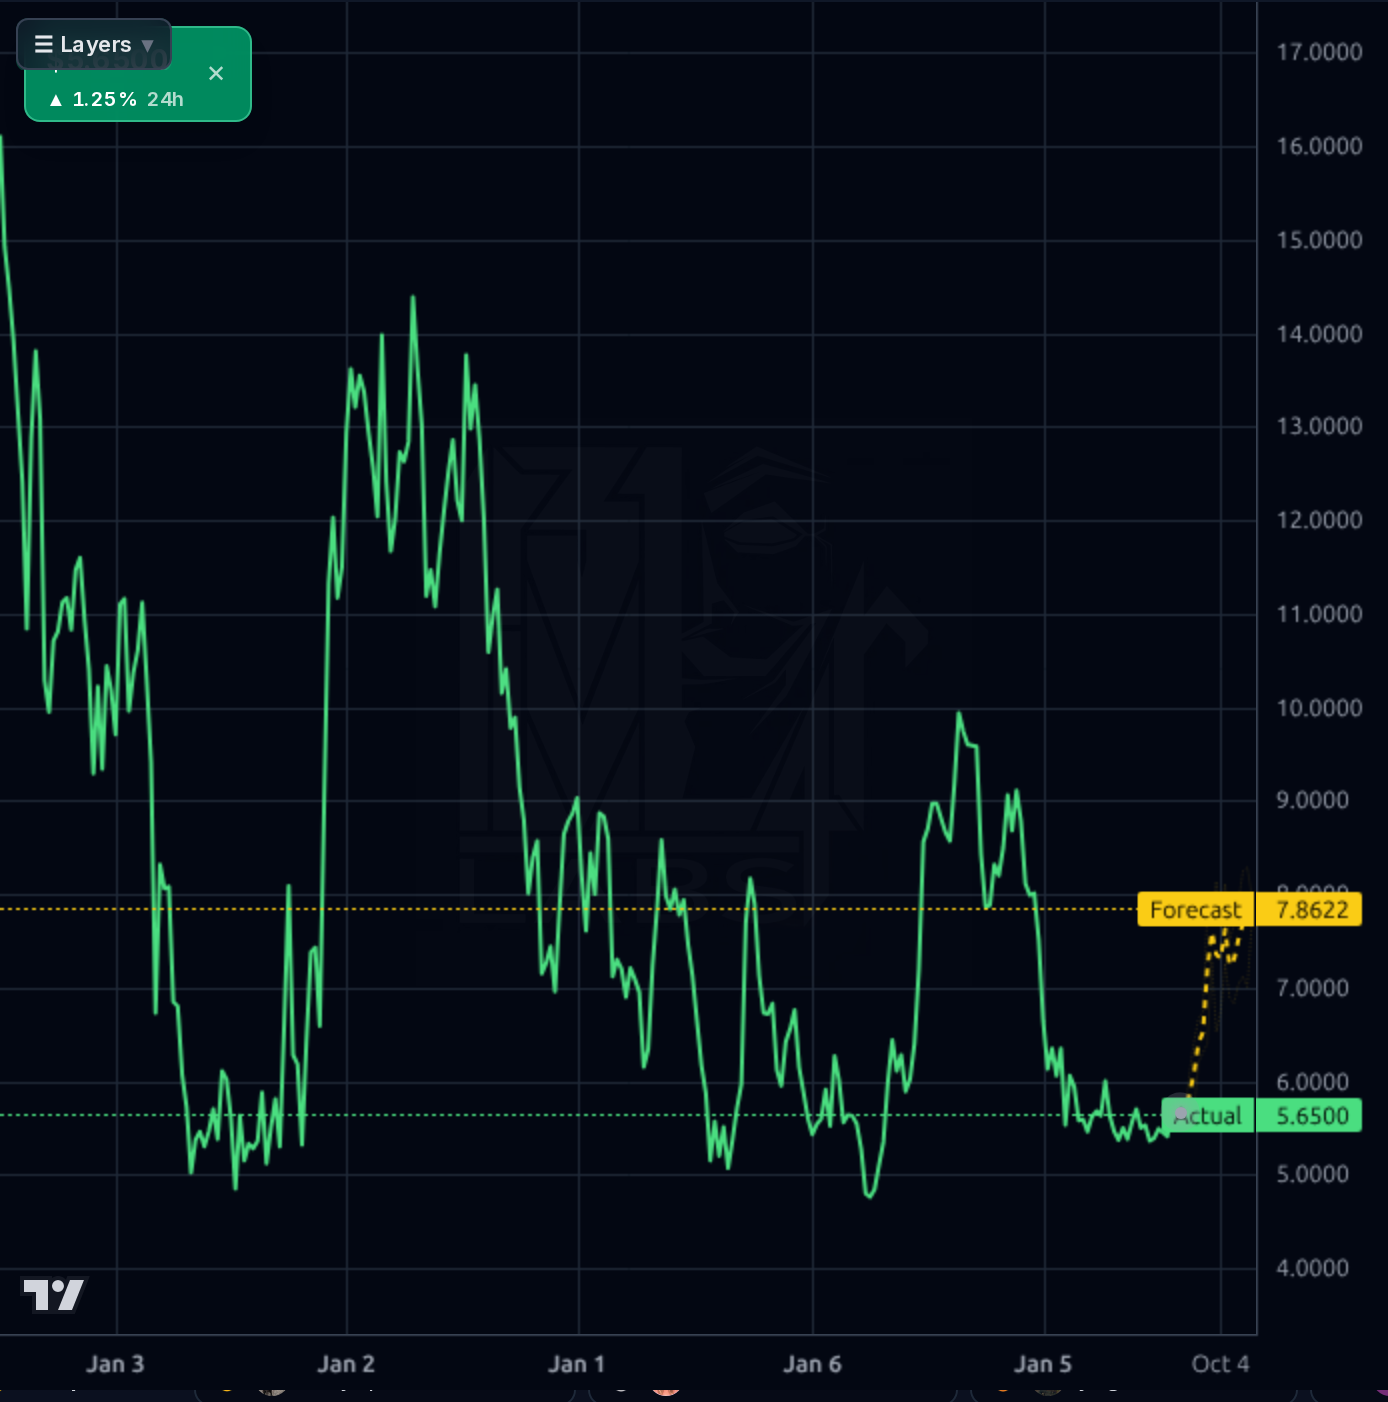
Earnings 2026-08-06 (~1 day away) is a binary event — I do NOT recommend initiating a swing trade into the print. Existing holders can size down or hedge; new capital should wait for the reaction. Above $5.75 post-print with a positive reaction, I'd look to add for a move to $6.00-$6.20. Invalidation is a close below $5.30 (loss of breakout base). The unanimous bullish forecast into a binary event combined with a bull-tilted crowd is exactly the setup where risk/reward asymmetry favors patience.
1-6 month base case is $6.00-$6.50 if Macau recovery continues to translate into EBITDA expansion and debt is refinanced without dilution. Expected return range 5-15% base, with -15% downside if the print disappoints or credit markets tighten. Catalysts: earnings, credit facility execution, Macau GGR monthly prints, any regulatory clarification. What changes my mind: a bad print with margin compression, or evidence of forced deleveraging (asset sales, equity raise).
1-3 year terminal thesis rests on Macau normalization to a mid-single-digit GGR growth regime plus deleveraging from ~$7B debt through free cash flow. If MLCO can hit consensus EPS growth trajectory ($0.82 forward EPS, growing ~23% for 5yr per sell-side), the stock could re-rate toward $9-11 as EV/EBITDA compresses and equity value builds. Biggest structural risk is not competition but the negative equity position: any prolonged revenue setback plus refinancing at higher rates could force equity issuance at a bad price, permanently impairing per-share value. This is a leveraged option on Asian gaming, not a core holding.
Operational trajectory is clearly improving: quarterly revenue climbed from $1.328B (Q2'25) → $1.293B (Q4'25) → $1.367B (Q1'26, +11.1% YoY), while EBITDA rebuilt from $273M to $331M and net margin expanded from 1.3% to 5.6% over four quarters. Gross margin at ~37% and operating margin ~13% are respectable for the industry. However, the balance sheet remains fragile: stockholders' equity is -$1.22B, total debt $6.94B against $942M cash, current ratio 0.84, and enterprise value $8.49B versus $2.17B market cap — meaning equity holders own a thin slice above a heavy debt stack. EV/EBITDA of 7.0x and forward P/E of 6.8x screen cheap, and PEG of 0.35 with EPS next-year growth of ~35% is attractive if delivered, but the -8.3pp cut to next-year EPS estimates (43.1% → 34.9%) shows sell-side is trimming. TTM EPS $0.58 gives real earnings power; sustaining it while amortizing debt is the whole game.
The 1h and 4h charts show a decisive breakout from the $5.20-$5.30 base in early August to $5.65, with the stock now +6.7% MoM and pressing against $5.66 resistance just below the intraday high near $5.68. Daily view confirms the stock has broken out of a five-month $5.20-$6.00 range on the upper end. SMA20 (+1.7%) and SMA50 (+1.55%) are now supportive, though SMA200 remains -13.7% overhead — the longer-term downtrend (-36.7% YoY, -26.3% YTD) is intact but flattening. RSI 52.95 is neutral, leaving room to run. The 1d forecast band projects $6.80-$6.96 into September (a +22-25% move), which historically for this ticker has been optimistic (past base targets of $6.46 sit +16% above current, still unfilled). Near-term directional accuracy (70%) trails the naive baseline (80%), so I heavily discount the 1-day bullish signal; the 1-week model is more reliable (83% vs 67% baseline). Key levels: support $5.45/$5.30, resistance $5.75, then $6.00 psychological.
The only stock-specific news is a Citigroup Buy reiteration but with a price target cut from $10.50 to $9.40 on 2026-07-10, and a July 15 sell-side piece framing MLCO as past the worst with 1Q26 EBITDA +16% YoY — both consistent with the improving operational data but tempered on magnitude. Consensus target of $7.72 (Recom 1.77 = Buy) implies ~38% upside but sell-side has been trimming estimates. Broader market news (Bloomin', Choice Hotels, CVS guidance updates) is not directly relevant. The macro backdrop of neutral risk with cyclical leadership is a mild tailwind. Retail sentiment is uniformly bullish but low-volume and includes obvious promotional spam, so I discount it heavily — if anything, the unanimous bullish tilt is a mild contrarian yellow flag.
- Continued Macau revenue rebound — Q1'26 revenue +11.1% YoY with EBITDA +21% sequentially
- City of Dreams Mediterranean (Cyprus) contribution to non-Macau diversification
- Sri Lanka City of Dreams project as a longer-dated growth optionality
- Potential credit facility extension to 2031 improving refinancing runway
- Forward EPS of $0.82 vs TTM $0.58 implies ~41% earnings expansion if consensus is right
- Negative stockholders' equity of -$1.22B and $6.94B total debt vs $942M cash — equity is structurally junior
- Current ratio 0.84 and working capital swung to -$234M in Q1'26 from +$85M in Q4'25 — liquidity trending wrong direction
- Earnings print in ~1 day is a binary event; sell-side already trimmed next-year EPS estimate -8.3pp
- Macau regulatory/policy risk remains unquantifiable and could reprice the whole complex
- Citigroup cut PT from $10.50 to $9.40 — even bulls are marking down expectations
- SMA200 still -13.7% overhead; -36.7% one-year performance shows sellers remain in control on longer timeframe
Get AI analysis on any stock
This is one of hundreds of Kronos AI reports — scored fundamentals & technicals, bull/base/bear price targets, a multi-horizon plan, and continuously-updated forecasts across the market. Create a free account to explore them all.
Create your free account →Already a member? Sign in · Join our Discord