MMS — AI Stock Forecast & Price Targets
Published 7/21/2026 · A free sample of K3vl4r’s AI-powered analysis.
Kronos price forecasts, scored fundamentals & technicals, and a multi-horizon plan.
View the live MMS price forecast →
MMS presents a stable profile underpinned by essential government contracts and attractive dividend metrics (2.33% yield), suggesting defensive appeal. However, high financial leverage (Debt/Equity near 1.0) and reliance on contract renewals introduce significant structural risk that must be monitored alongside the upcoming earnings report. The current valuation appears reasonable given its stability but lacks immediate high-growth catalysts.


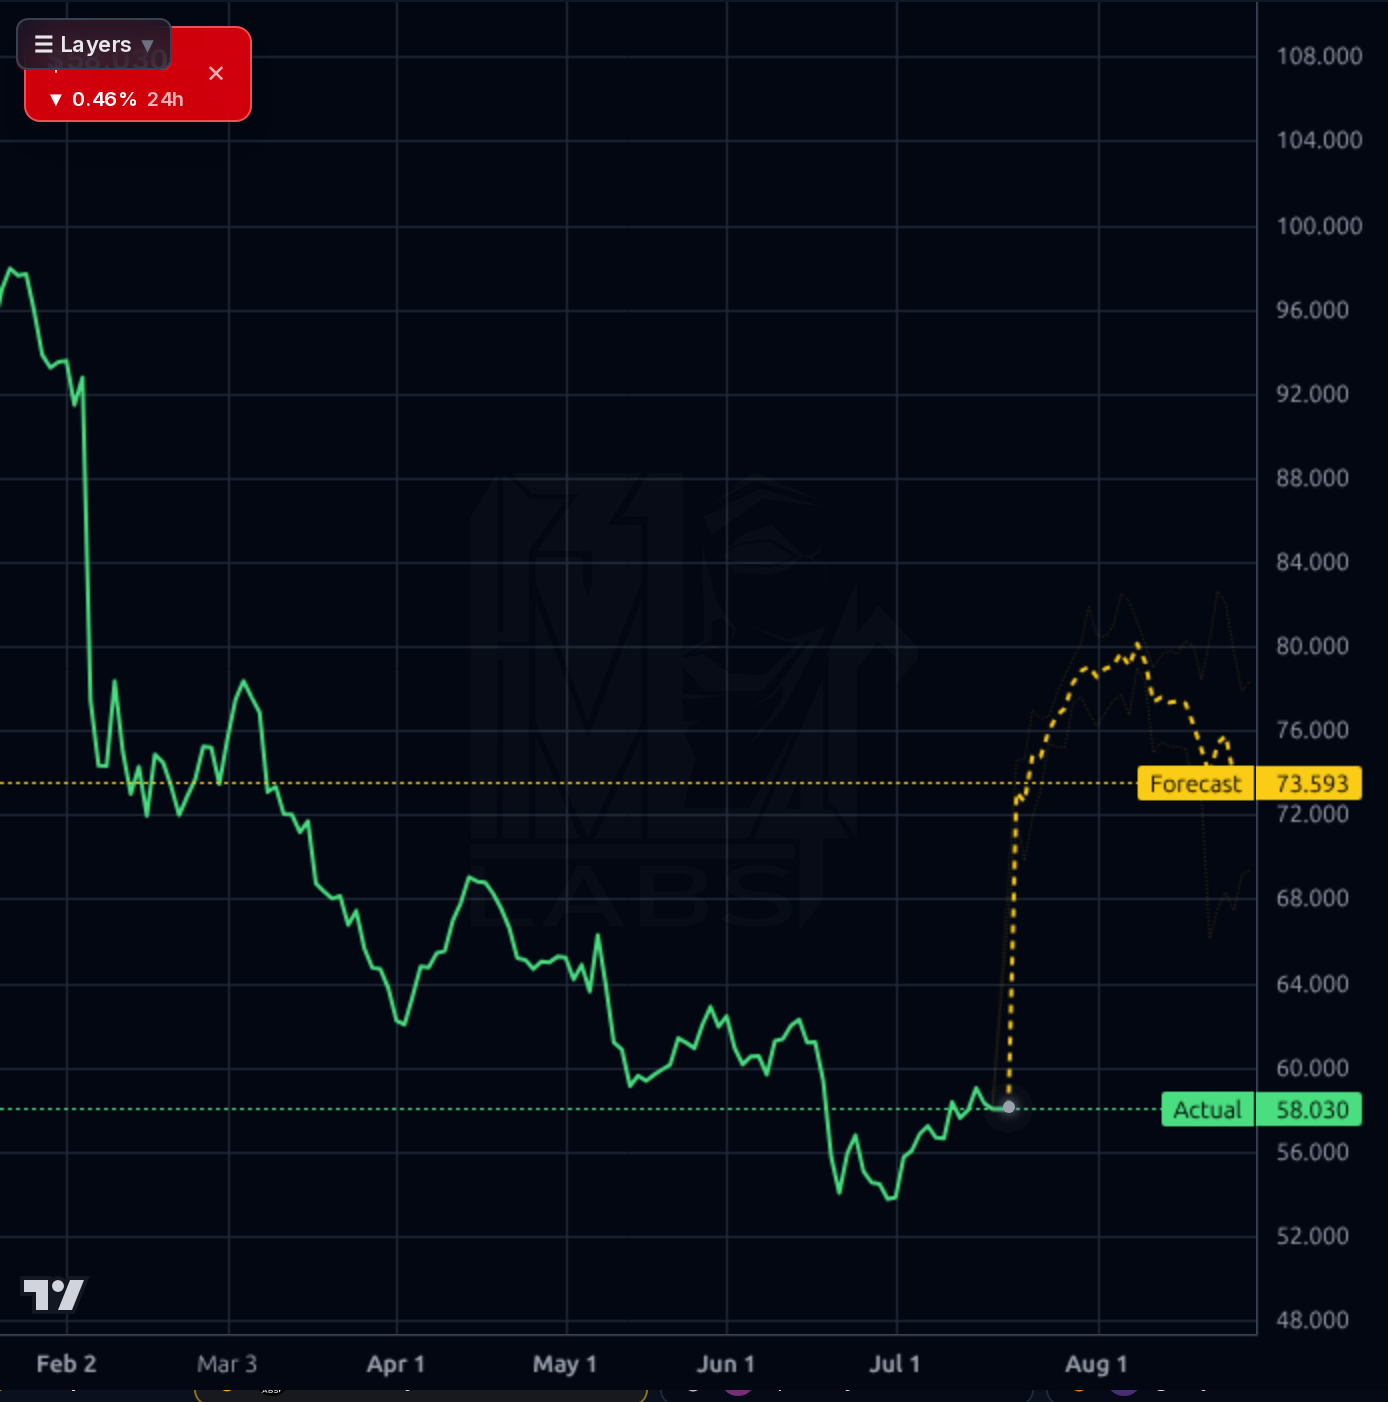
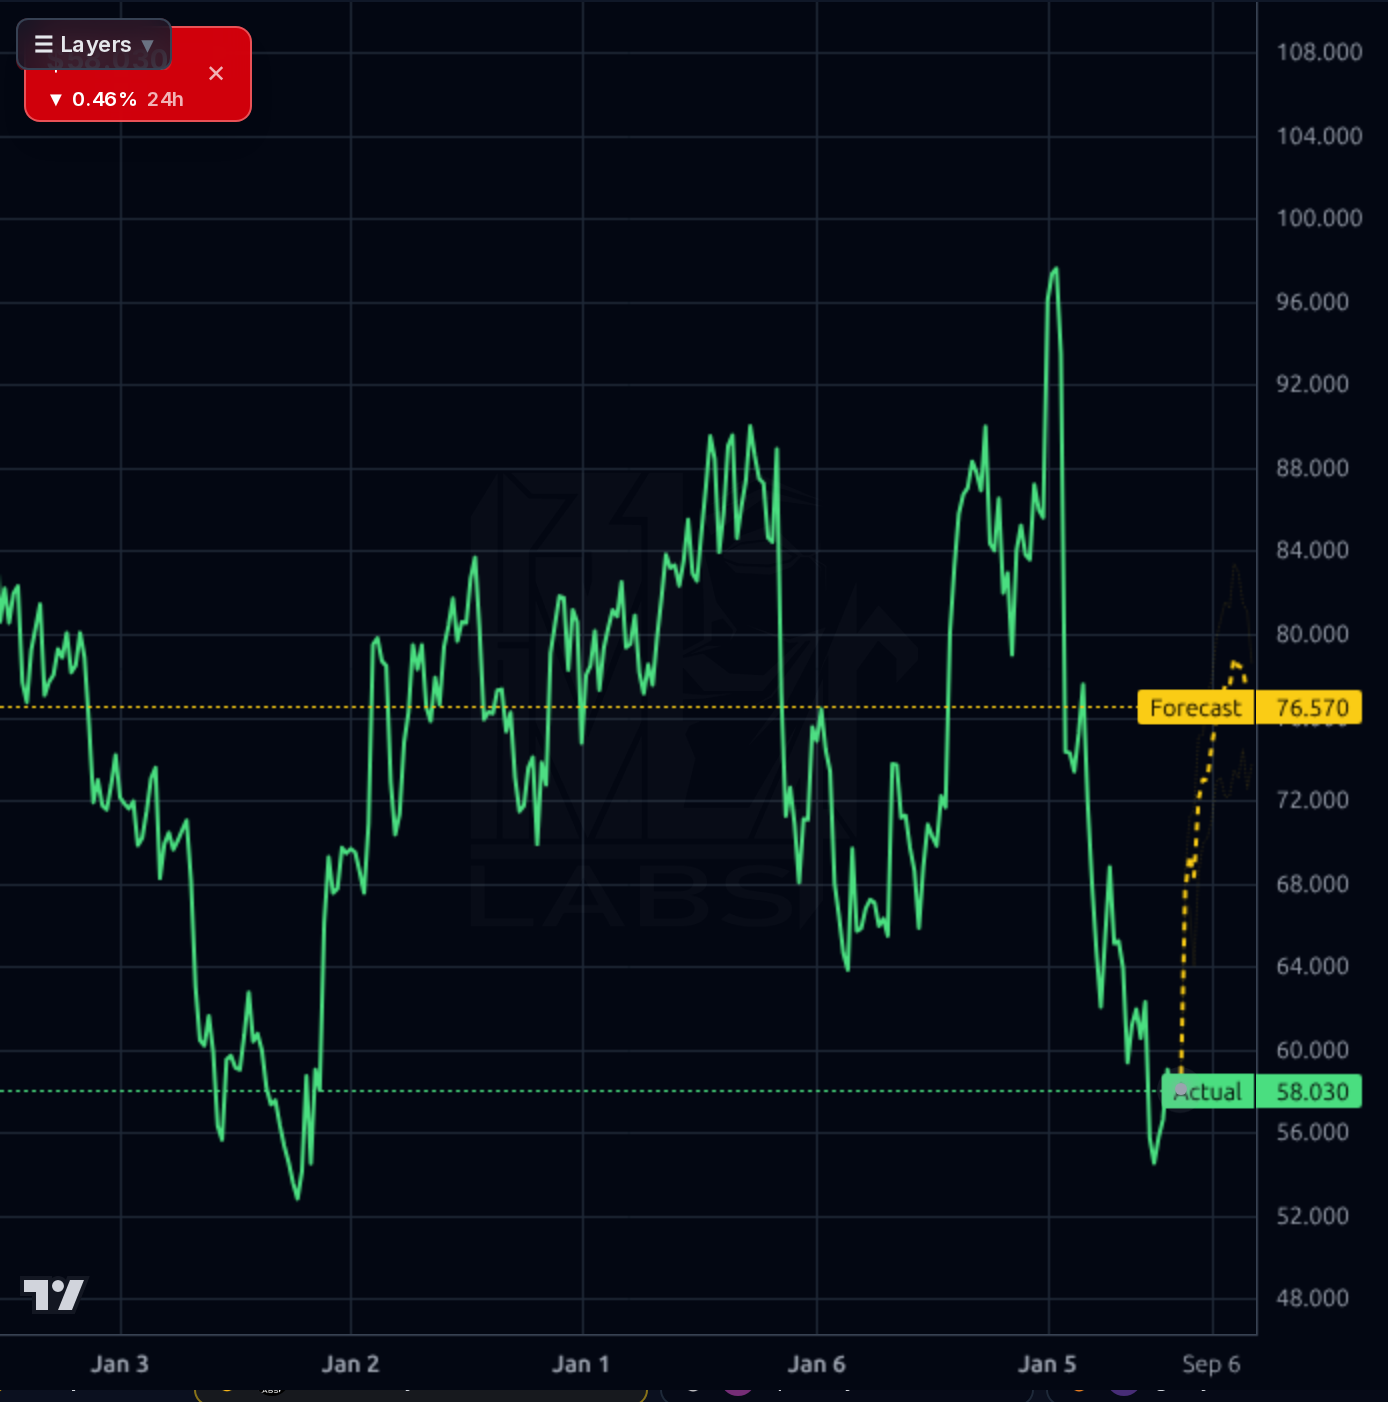
Wait for the August 6th earnings report; treat any pre-earnings target as speculative. Key immediate support is around $52.73 (historical floor). A break above recent resistance near $60 would signal a short-term reversal attempt, but caution is warranted due to high volatility.
The mid-term thesis hinges on management's ability to demonstrate concrete steps toward deleveraging the balance sheet while maintaining contract renewals. If earnings confirm stable cash flow generation relative to debt servicing needs, the base case target of $69.00 (from prior analysis) becomes more credible, suggesting a potential return range towards that level over 12-18 months.
The long-term thesis remains anchored in MMS's essential role in government services, providing predictable cash flows. The biggest structural risk is regulatory shifts or contract losses impacting the core revenue base, which could negate all positive financial metrics.
The company exhibits strong operational metrics with a Gross Margin of 23.83% and an Operating Margin of 10.81%, supported by recurring government contracts. Cash flow generation has been volatile, showing significant positive OCF in Q3 2025 ($649M) but negative swings previously. The primary weakness is the balance sheet: a Debt/Equity ratio near 0.96 (using latest data) indicates high leverage relative to equity. While profitability metrics like ROE (22.19%) are solid, capital allocation must prioritize deleveraging over aggressive expansion to satisfy creditors and investors.
The price action across both timeframes shows a clear downtrend punctuated by consolidation attempts near key support levels ($52.73 on the 1d chart). The model's forecast band suggests continued downward pressure towards the $58.00 level, while the current price is at $57.93. The technical picture is mixed; while short-term momentum indicators are neutral (RSI near 50), the overall trend remains bearish, suggesting caution until a decisive break above recent resistance levels is confirmed.
The most concrete news points to MMS being viewed as a 'High-Quality Dividend Stock' with strong fundamentals by sources like ChartMill, citing its 2.33% yield and low P/E of 7.57. Furthermore, the company benefits from recurring government contracts (Zacks report). The immediate focus is on the upcoming earnings call scheduled for August 6th, which will be a binary catalyst determining near-term sentiment. Broader market news provides context but does not directly impact MMS's core government revenue streams.
- Potential upside driven by successful expansion into non-government specialty markets, though execution risk must be monitored.
- High financial leverage (Debt/Equity near 1.0) remains a persistent concern for capital structure.
- Exposure to regulatory changes impacting core government contract revenue streams is the primary secular risk.
Get AI analysis on any stock
This is one of hundreds of Kronos AI reports — scored fundamentals & technicals, bull/base/bear price targets, a multi-horizon plan, and continuously-updated forecasts across the market. Create a free account to explore them all.
Create your free account →Already a member? Sign in · Join our Discord