MMS — AI Stock Forecast & Price Targets
Published 8/10/2026 · A free sample of K3vl4r’s AI-powered analysis.
Kronos price forecasts, scored fundamentals & technicals, and a multi-horizon plan.
View the live MMS price forecast →
MMS demonstrates resilient government services fundamentals but faces structural leverage risks and technical exhaustion. Recent Q3 results confirm operational stability with $1.28B revenue and 15% EBITDA margin, yet persistent revenue declines (-31.43% YTD) and high debt/equity (0.99) temper near-term upside. The chart shows a broken trend with forecast bands suggesting limited momentum despite strong FCF generation ($425-$475M guide).
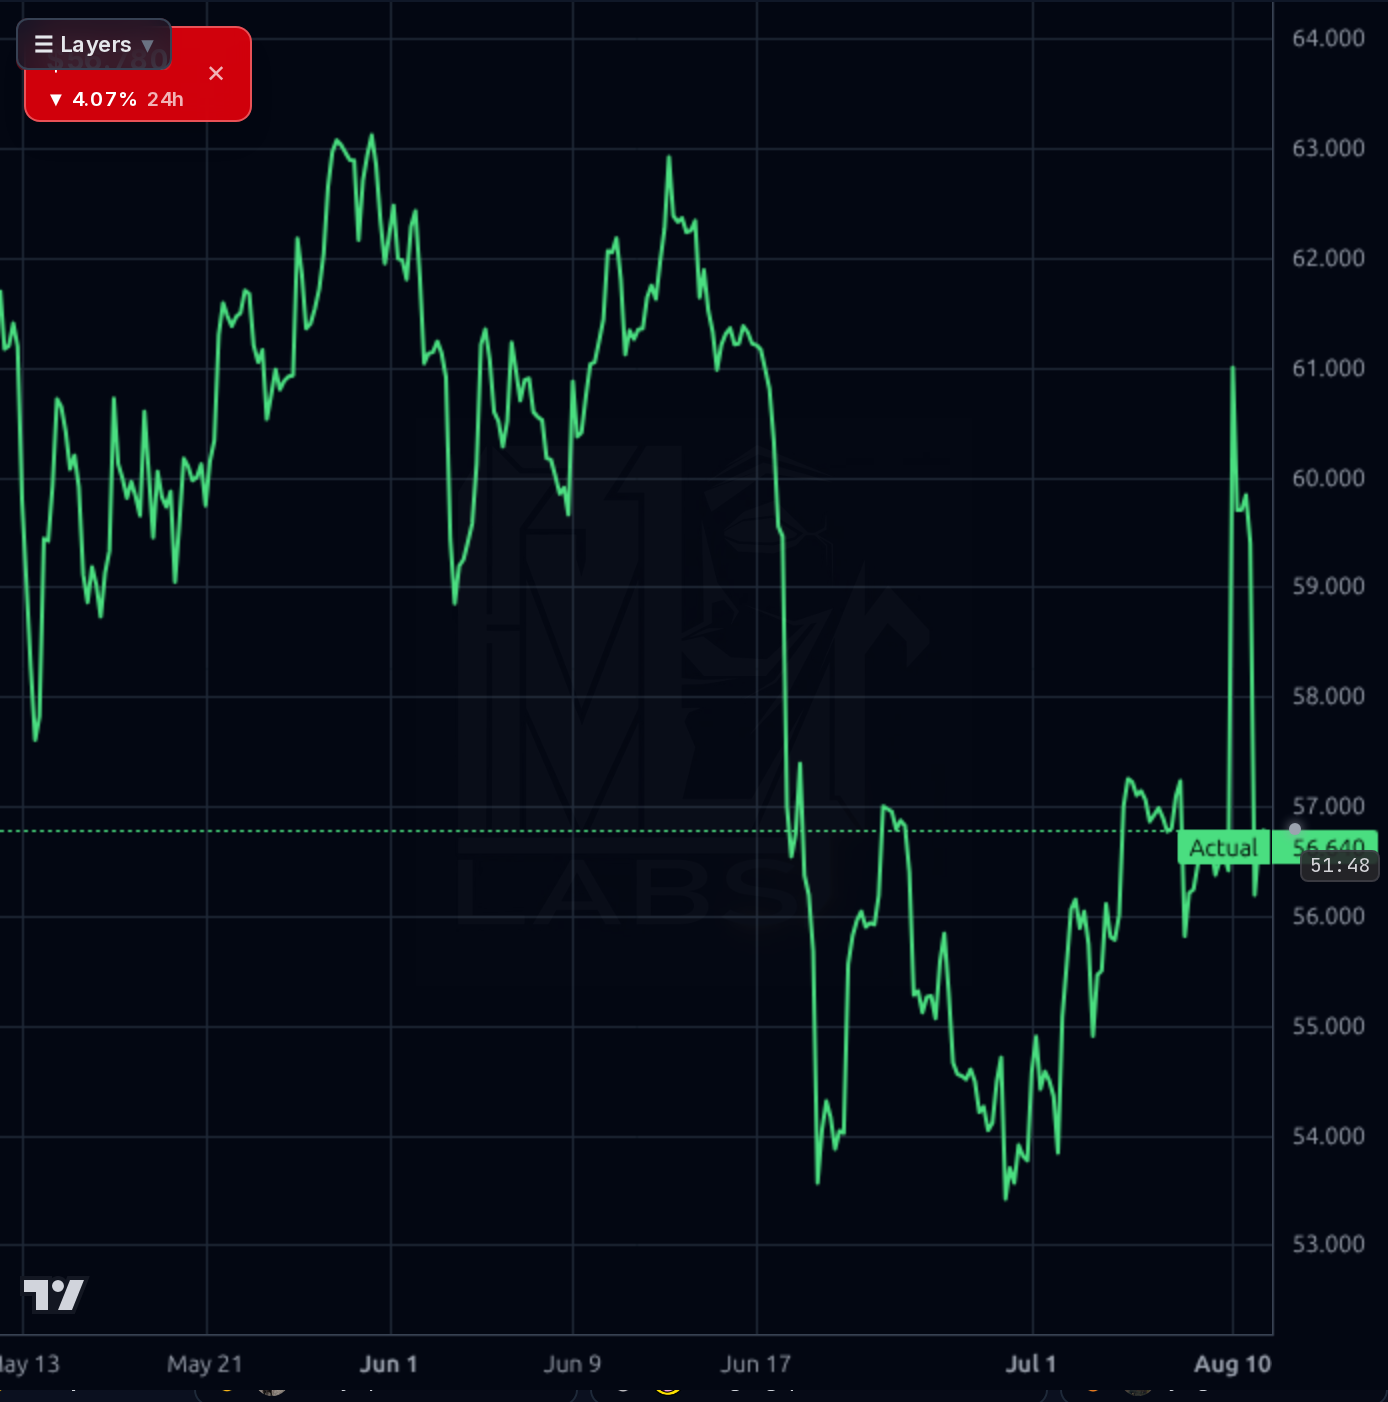
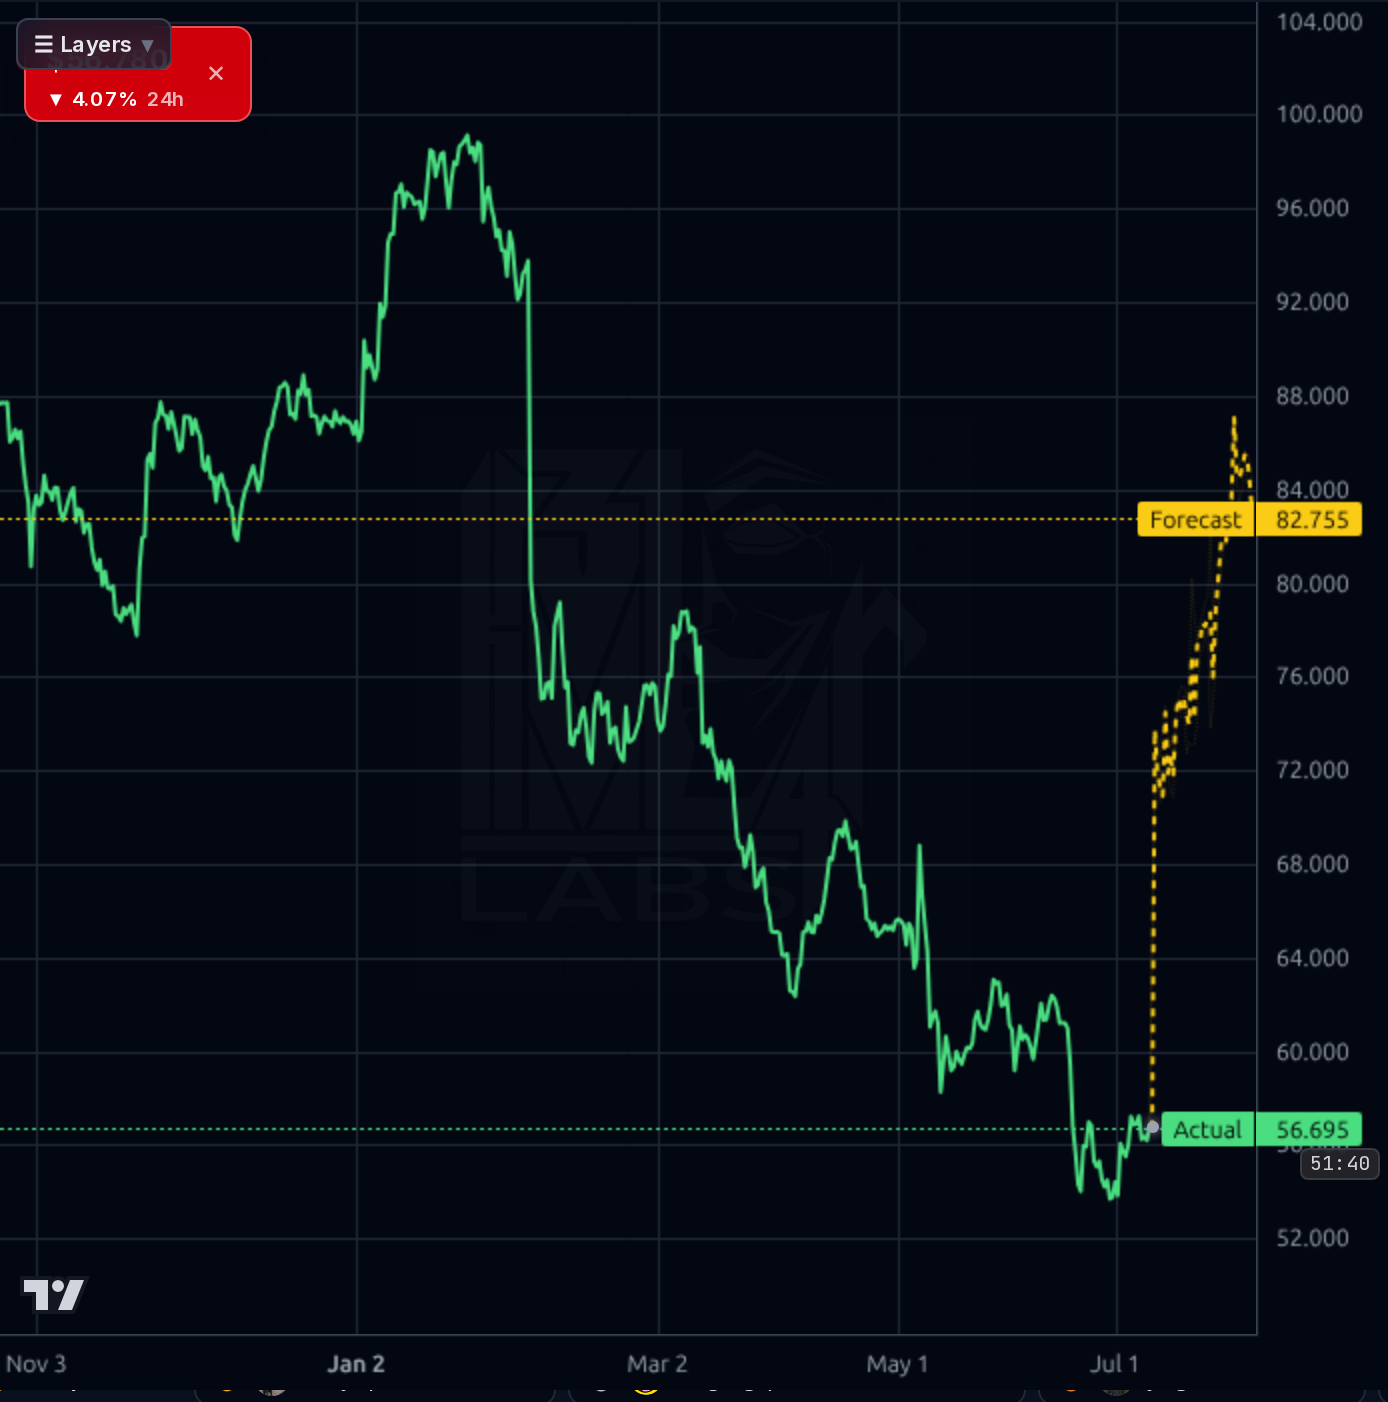
Hold below $60.00; invalidation is break of $52.73 support. Target $59.19 as current price, with potential for minor bounce to $60.00 if technical resistance holds. Avoid aggressive moves given the 4.07% 24h drop and broken trend.
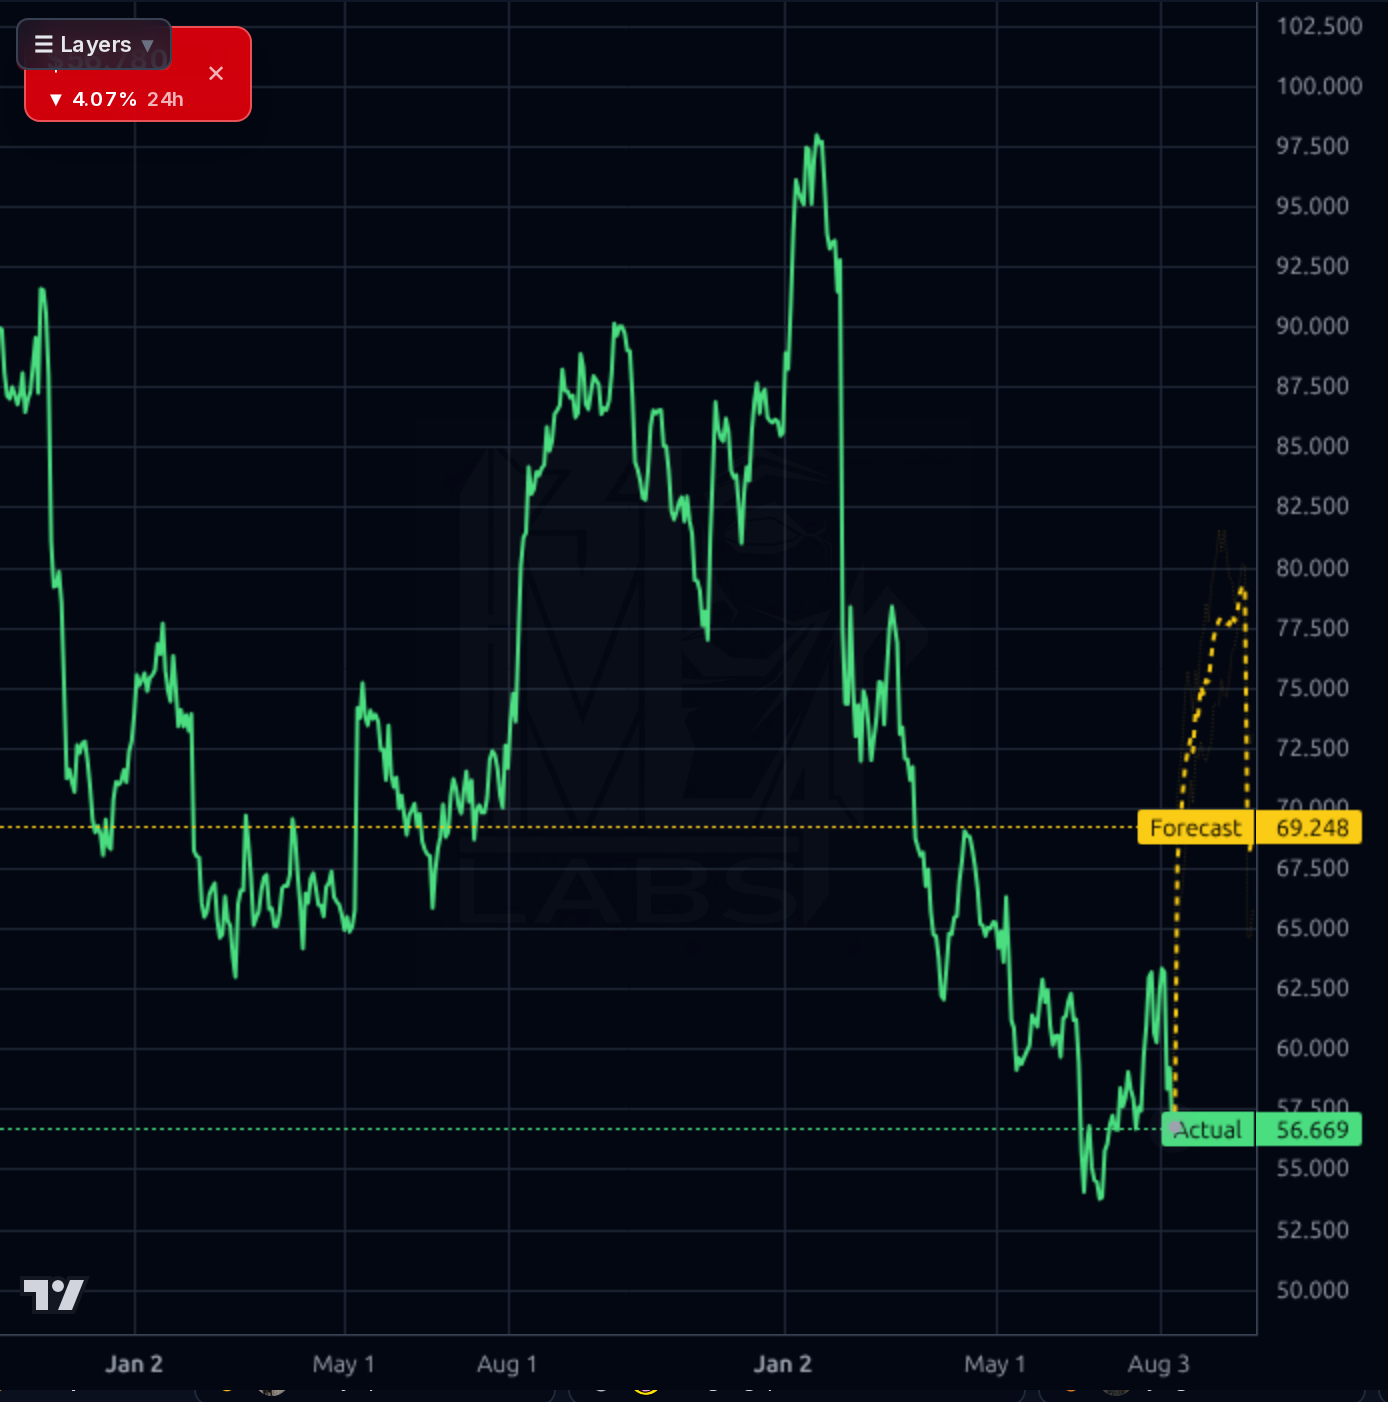
Accumulate on dips below $57.00; catalysts include Q4 operating cash flow validation and contract renewals. Target $69.00 as base, but realistic upside capped at $72.00 due to historical target misses (base targets +16% from live price). Key risk: failure to reverse revenue decline or deleverage progress.
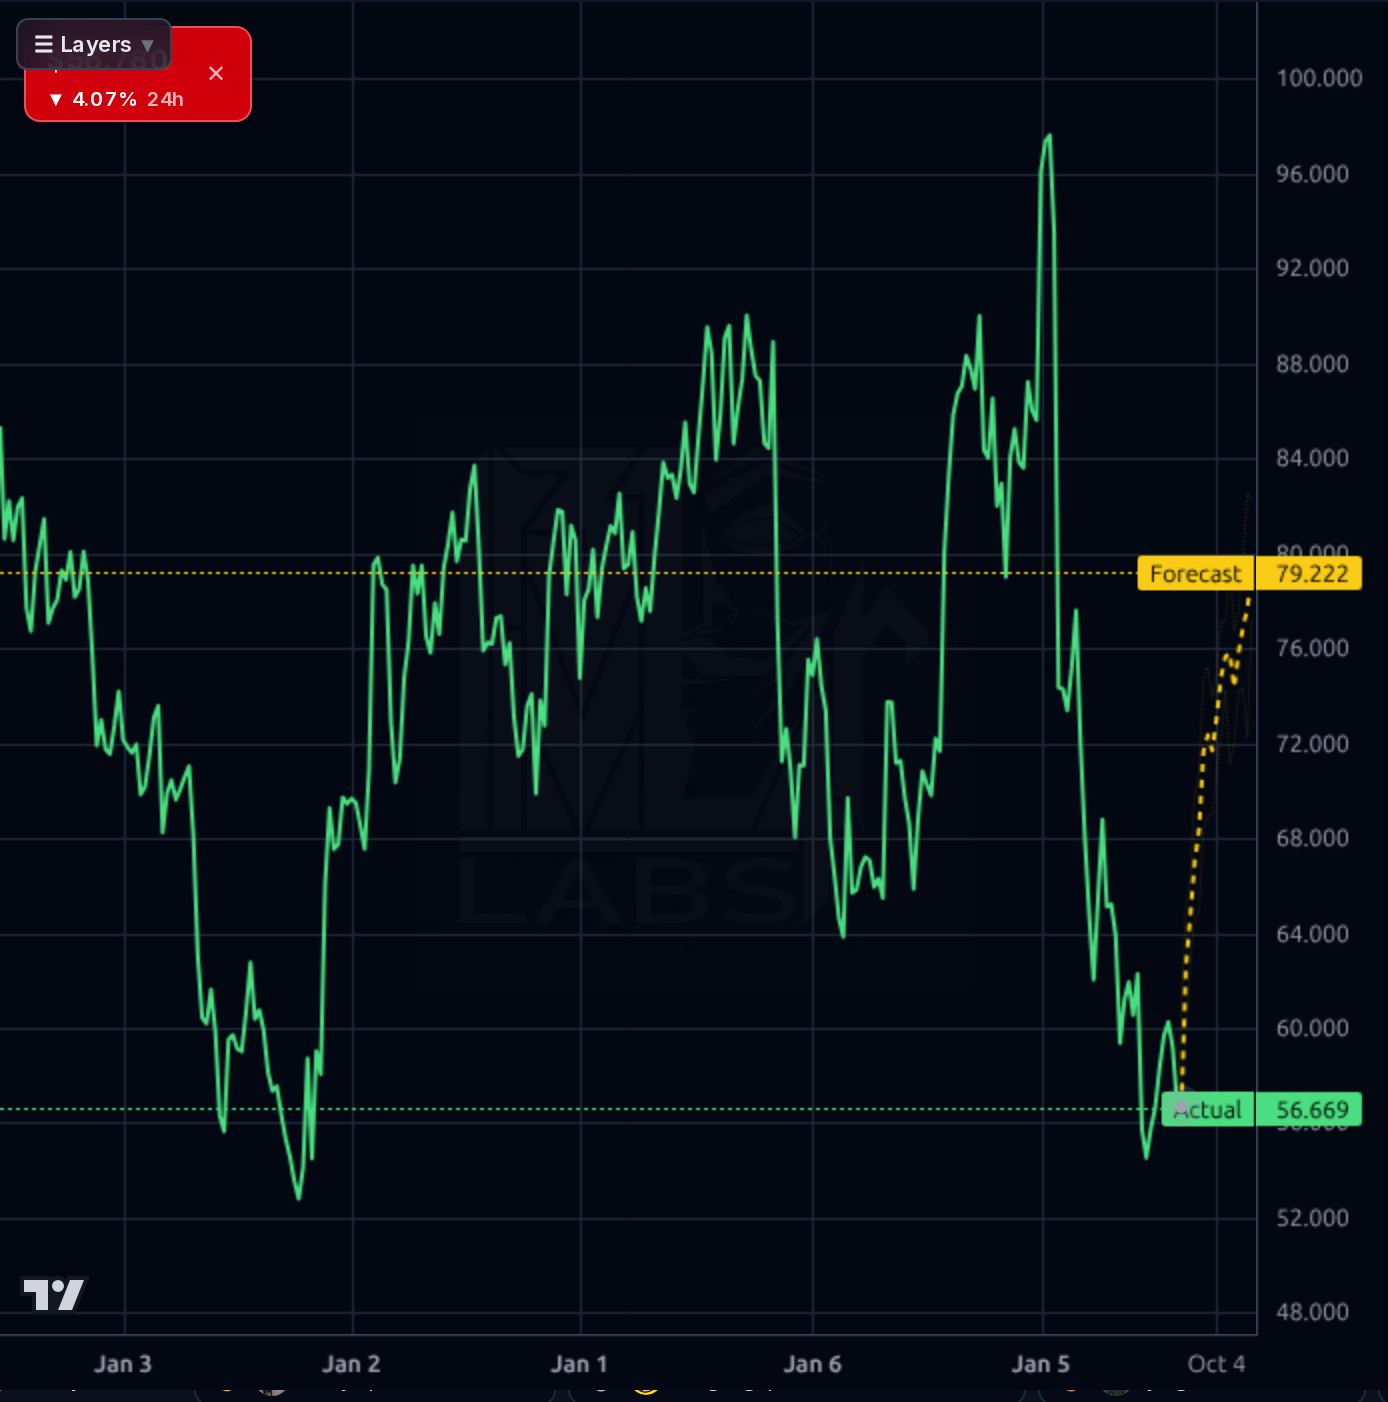
Terminal thesis is a value play with stable government contracts; long-term growth hinges on successful contract renewals and margin expansion. Structural risk remains high due to reliance on federal spending, but strong FCF generation ($425-$475M) provides buffer. Biggest risk: political shifts reducing federal funding or policy changes impacting HHS programs.
Revenue shows sequential decline (-5.15% QoQ) despite Q3 FY26 revenue of $1.28B meeting expectations, with gross margins expanding to 27.3% and operating margins at 12.6%. Balance sheet remains fragile with debt/equity near 1.0 (99.546), though strong FCF generation ($425-$475M guide) provides capital for dividends (2.23% yield). Capital allocation is constrained by high leverage and working capital deterioration impacting operating cash flow, while the 21.11% ROE suggests quality but not growth potential. The $59.19 price reflects deep value at 6.7x forward P/E, yet valuation already discounts significant pessimism with a -31.43% YTD drawdown.
The chart shows a broken uptrend with multiple failed rallies and overhead supply at key levels ($52.73 low). Forecast bands indicate limited upside momentum (yellow band) with the model predicting $69.248 as base target, but actual price is stuck near $59.19. Technical support holds at $52.73 (52-week low), while resistance at $60.00 remains untested. The 4.07% 24h drop suggests momentum exhaustion and potential for further downside if the $52.73 level breaks.
Q3 results confirm revenue stability ($1.28B) with improved EBITDA margin (15.0%) but sequential decline (-31.43% YTD) highlights structural challenges. The 2.26% dividend yield and sustainable payout ratio (18%) provide defensive appeal, though high leverage (debt/equity near 1.0) remains a concern. Recent news emphasizes valuation already pricing in pessimism with the stock down 31.5% YTD, but no concrete catalysts for immediate reversal.
- Q3 FY26 revenue of $1.28B meets expectations with improved EBITDA margin (15.0%)
- $425-$475M FCF guidance for FY26 validates capital allocation strategy
- High financial leverage (debt/equity near 1.0) combined with declining revenue signals significant balance sheet risk
- Reliance on future federal contract renewals makes the stock highly sensitive to government spending or policy shifts
- Working capital deterioration has recently impacted operating cash flow, complicating FCF validation
Get AI analysis on any stock
This is one of hundreds of Kronos AI reports — scored fundamentals & technicals, bull/base/bear price targets, a multi-horizon plan, and continuously-updated forecasts across the market. Create a free account to explore them all.
Create your free account →Already a member? Sign in · Join our Discord