MNSO — AI Stock Forecast & Price Targets
Published 7/13/2026 · A free sample of K3vl4r’s AI-powered analysis.
Kronos price forecasts, scored fundamentals & technicals, and a multi-horizon plan.
View the live MNSO price forecast →
MNSO trades at 7x forward P/E with 30.5% TTM revenue growth, a HK$2B buyback, insider buying, and a 5.65% dividend yield — a genuine deep-value setup — but shares are pinned at the $11.12 52-week low ahead of a binary August 20 earnings print. Prior forecast models have run systematically too bullish here (base targets averaging +17% above realized moves), so we discount the model's aggressive upside to $13.6-17.9 and derive a more realistic base near $13.20 mean-reversion, with $11.12 as hard invalidation.
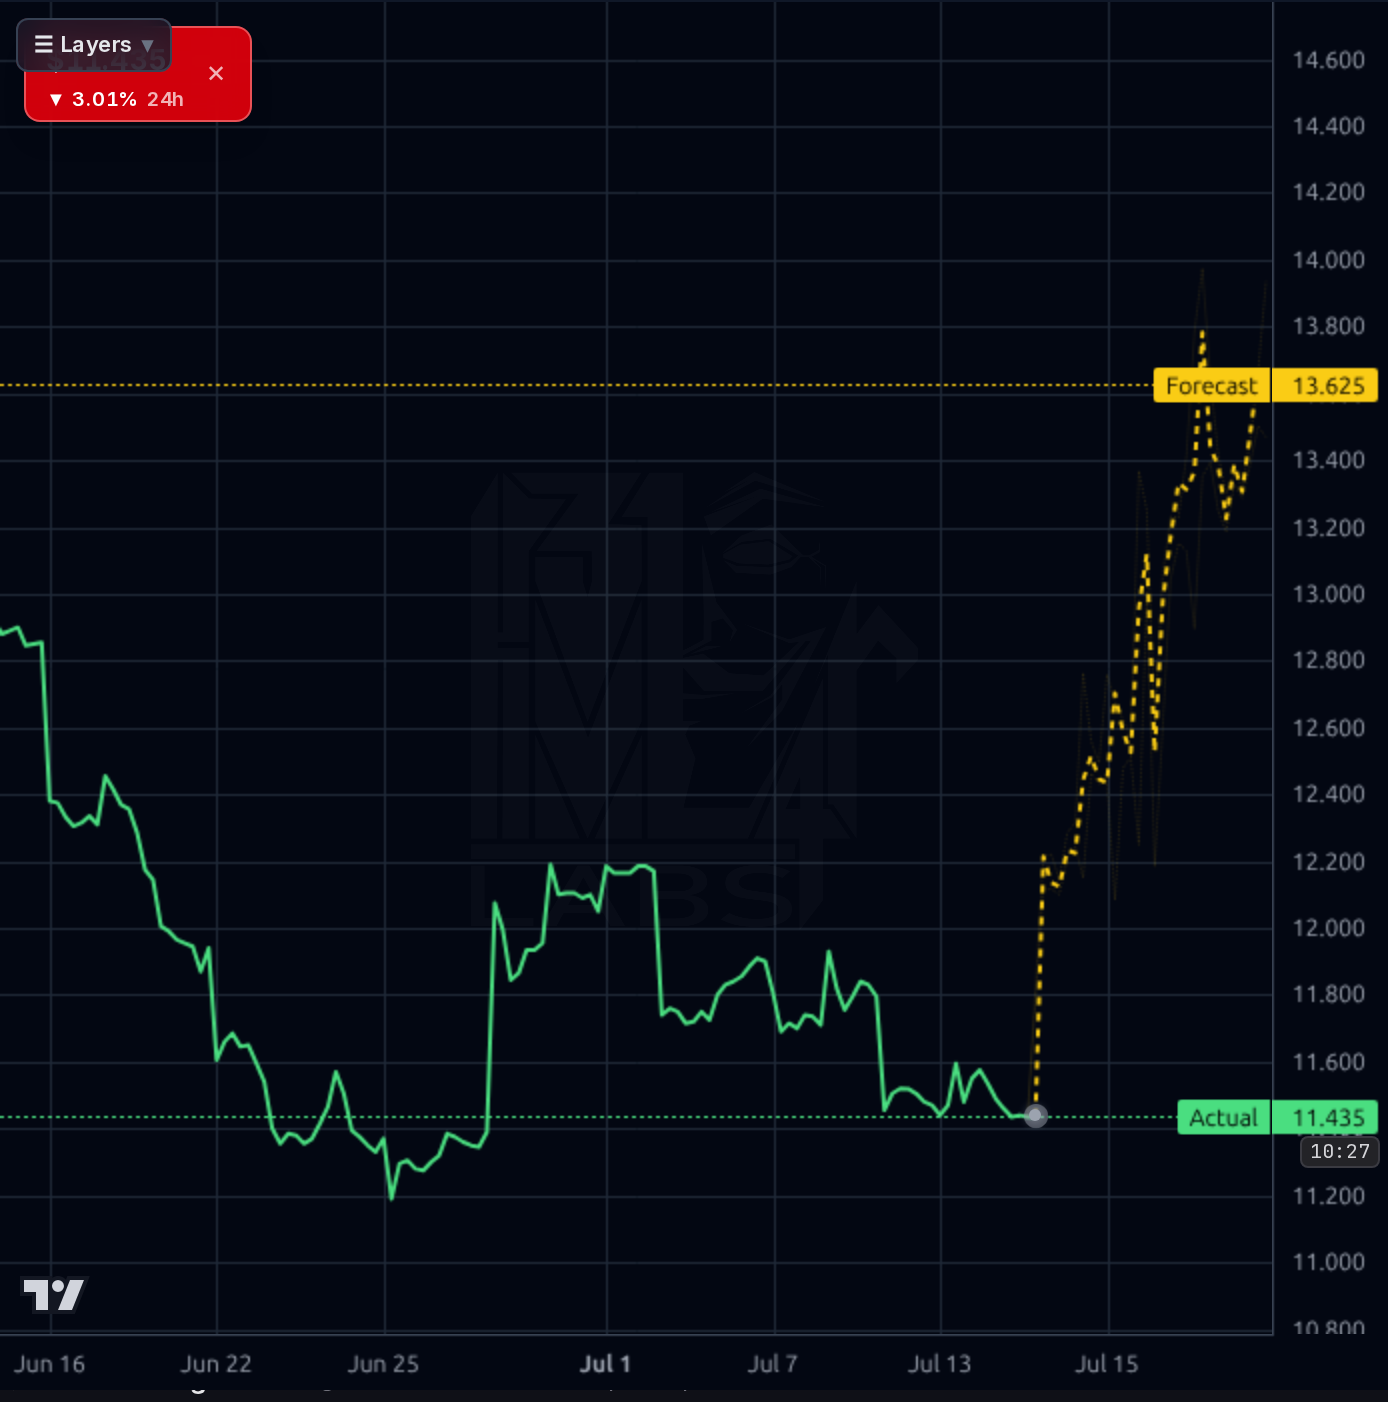
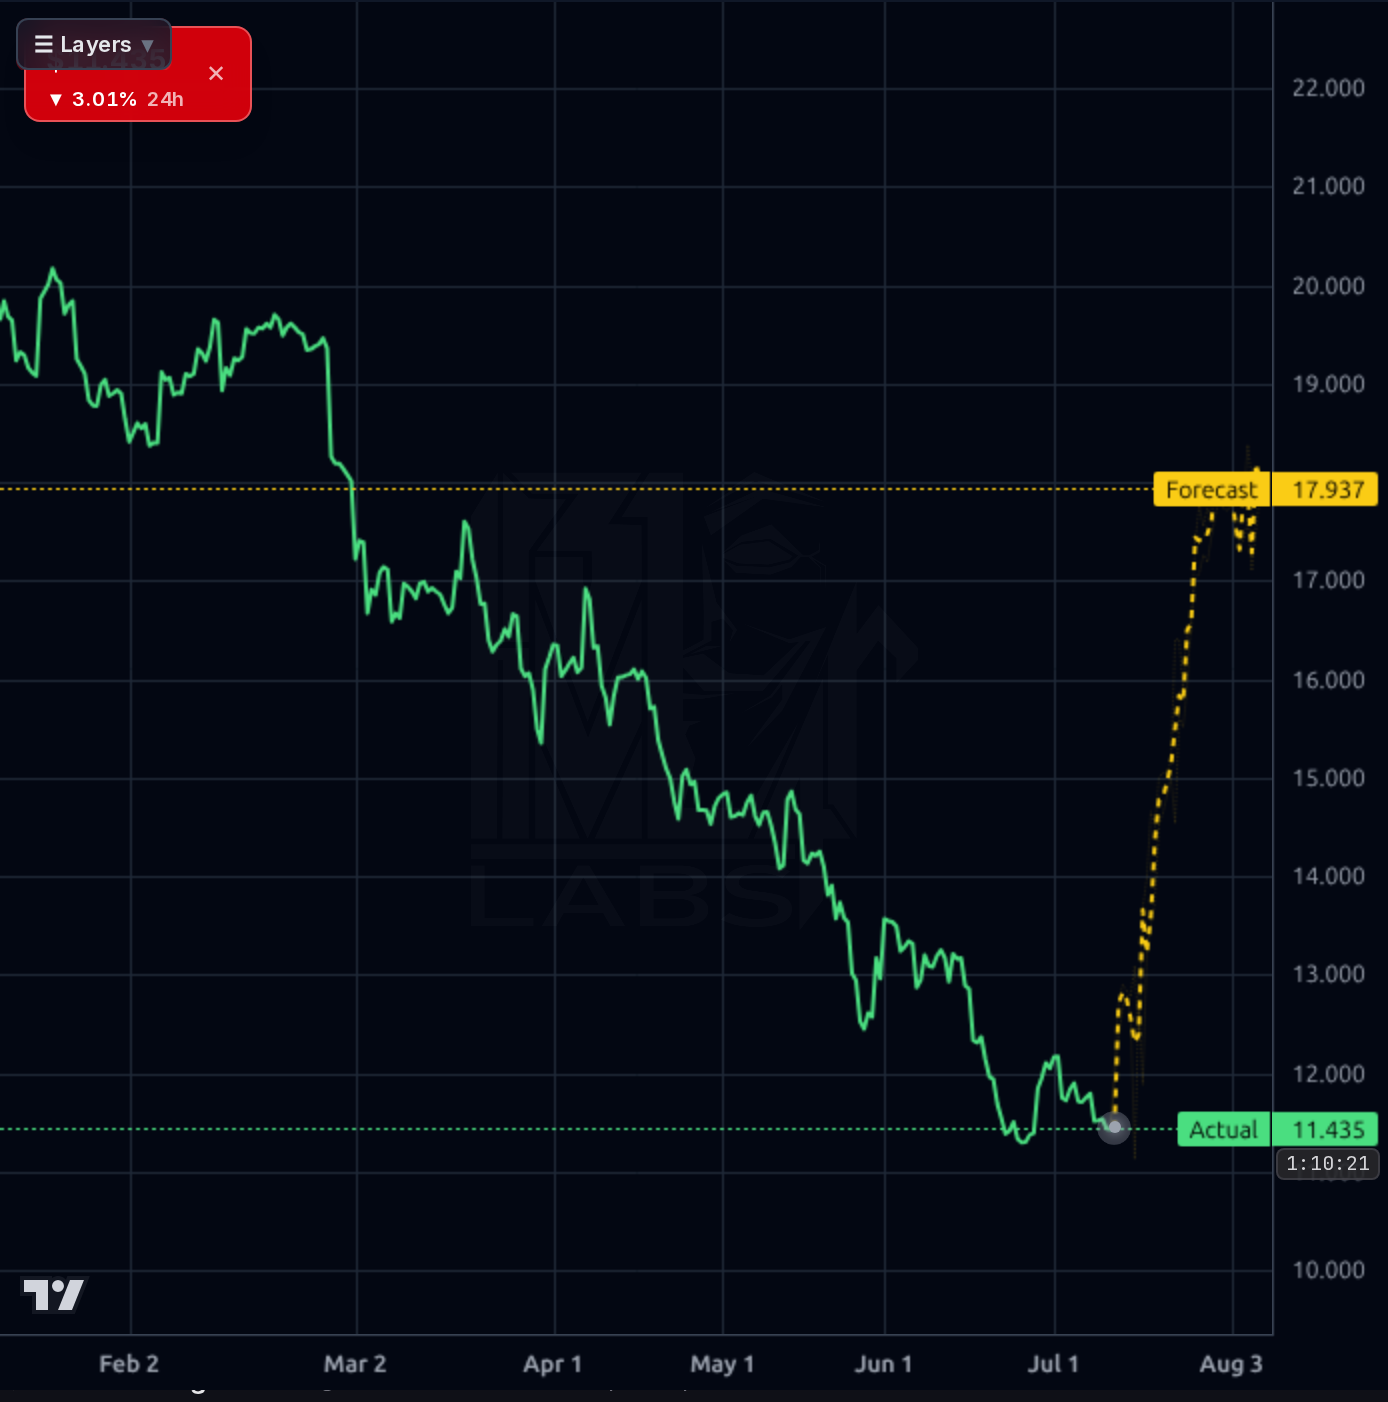
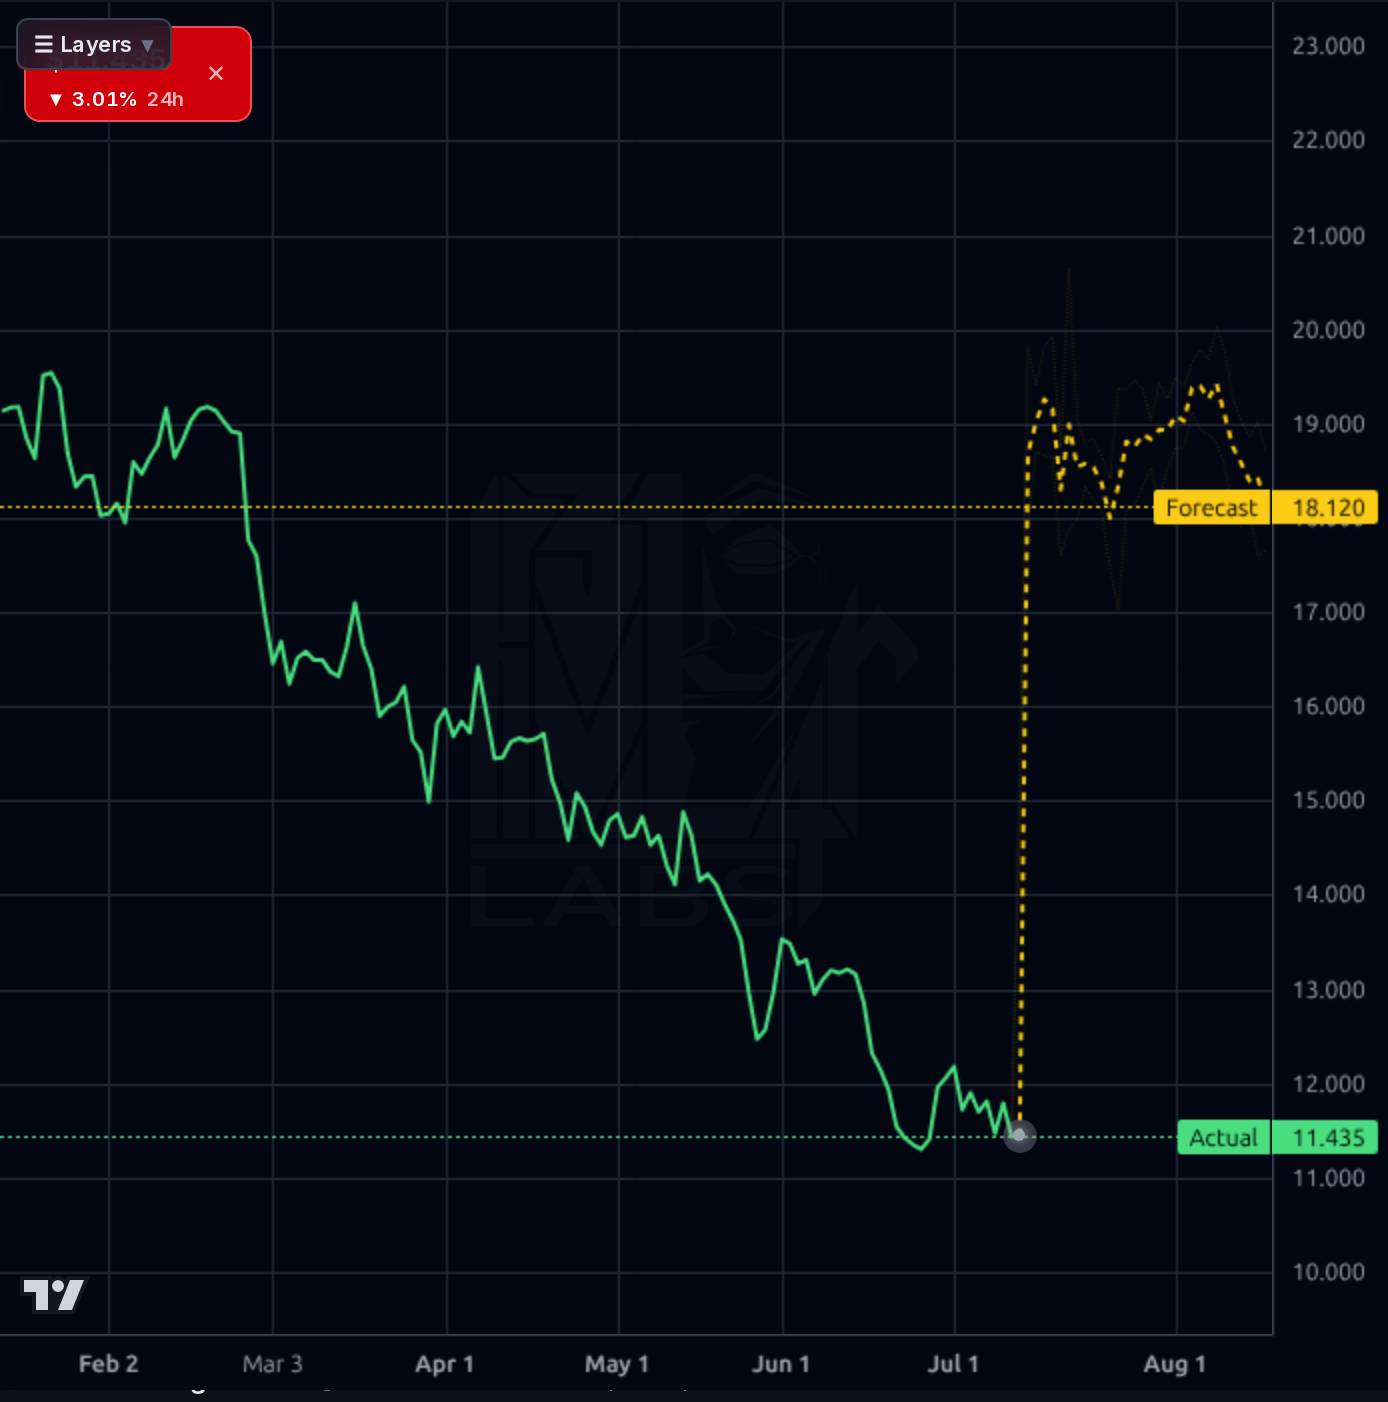
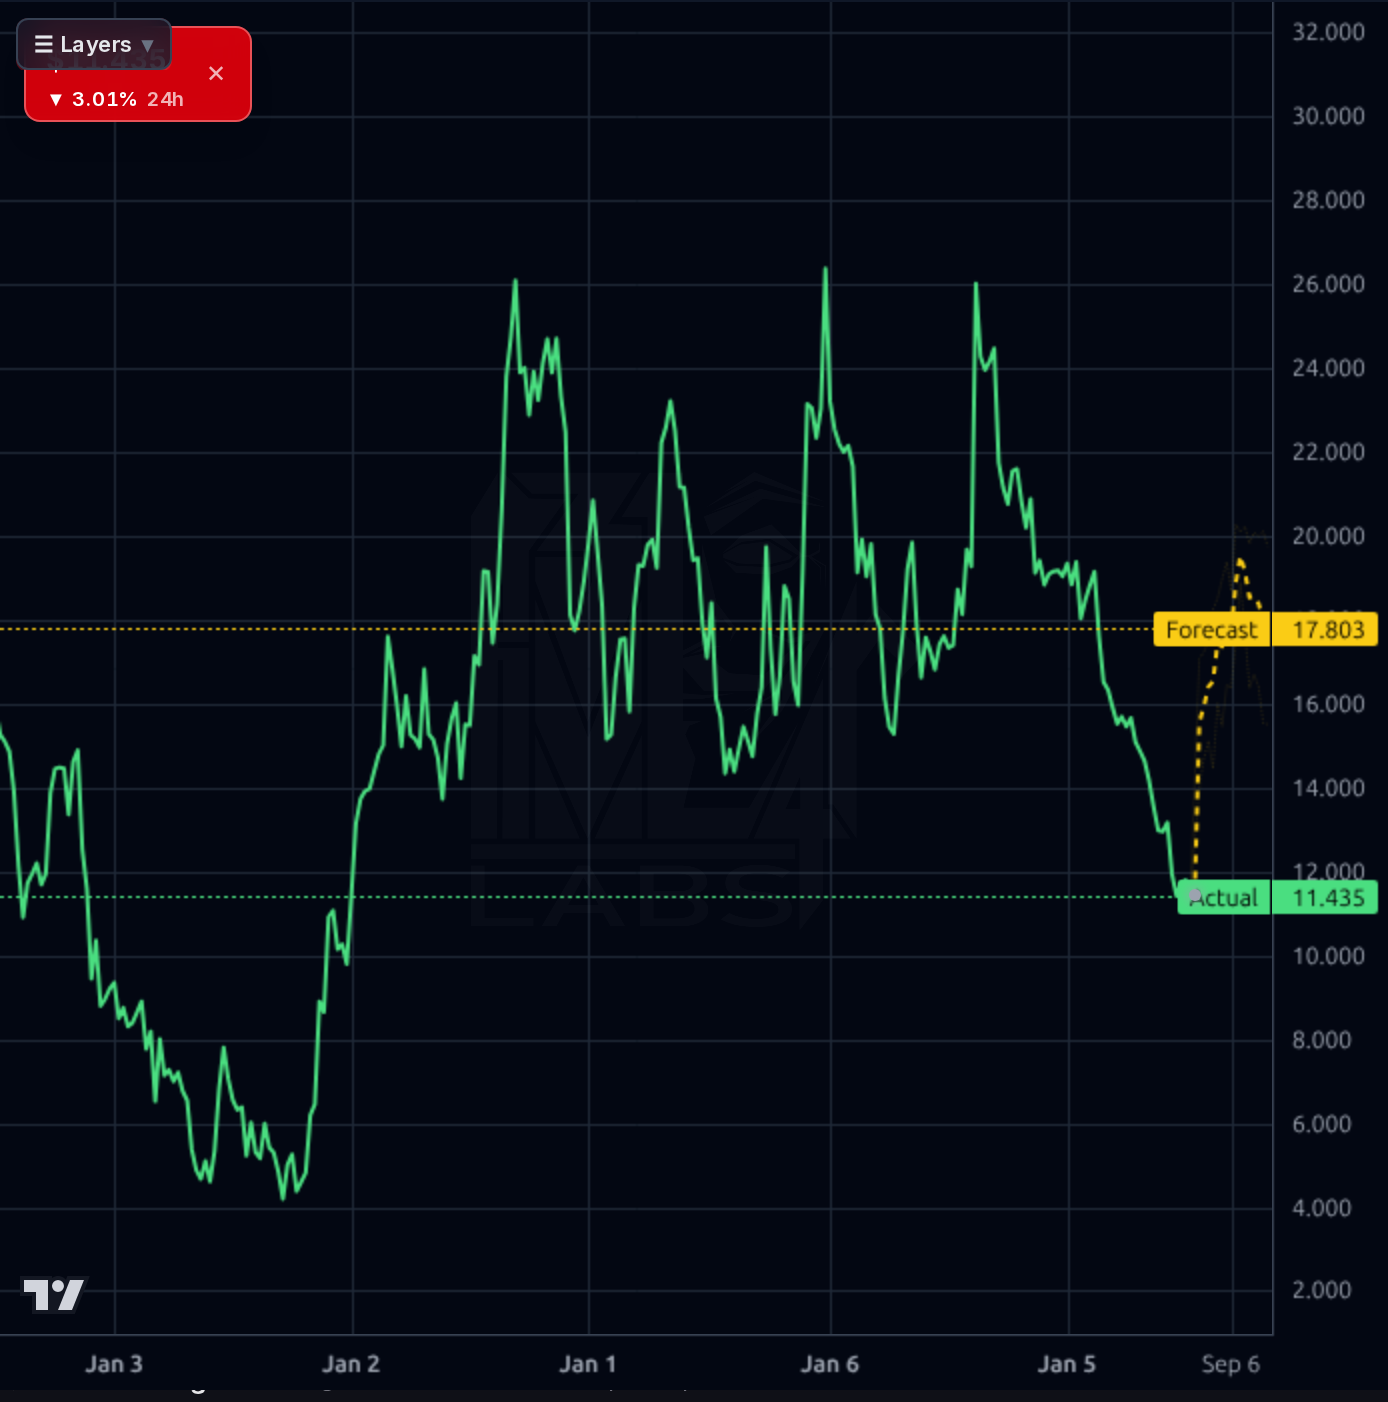
1-4 week view: Small starter accumulation zone $11.20-11.60 with a hard stop below $11.00 (invalidates 52W low support). Do NOT size for the August 20 earnings print — that is binary and 38 days out; any pre-earnings position should be sized to survive a -20% gap. First upside objective $12.00-12.20 (nearest supply), stretch $13.20 if pre-earnings positioning improves. Take partial profits into any $12.80+ pre-earnings ramp given the model's systematic upside overshoot. Earnings stance: HOLD THROUGH ONLY IF POSITION IS SMALL — this is a coin-flip catalyst.
1-6 month view: Accumulate on weakness with the thesis that the HK$2B buyback plus insider buying plus 30% top-line growth ultimately re-rate the stock toward $13-15 as multiple quarters confirm Q1 CY26's margin trajectory. Base case $13.20 (+12%), bull case $15.50 (+31%) requires a clean August print with margin north of 15% and no repeat of the Q4 CY25 anomalies. Bear case $9.50 (-19%) triggers on another loss quarter or dividend cut. Thesis changes if: (a) Q2 CY26 EBITDA reverts to Q4 CY25 lows, (b) dividend is cut, (c) buyback execution stalls, or (d) $11.00 breaks on volume.
1-3 year view: If MNSO can execute management's stated ¥33B revenue by 2029 target while maintaining 15-20% net margins and normalizing the dividend payout ratio below 60%, the current 7x forward P/E is materially too cheap and fair value sits closer to $20-25. TOP TOY IP monetization and international expansion (+21.9% YoY) are the two multi-year drivers. The biggest structural risk is the Chinese ADR overhang — PCAOB status, capital controls, and delisting tail risk remain latent — combined with the debt load (¥11.5B) limiting flexibility if consumer discretionary weakens further in China.
Top-line remains the strongest part of the story: TTM revenue growth of +30.5% with Q1 CY26 revenue of ¥5.69B (+28.5% YoY) marking the fifth consecutive quarter of acceleration, TOP TOY +51.4% YoY, and overseas +21.9%. Q1 CY26 net income of ¥1.25B translated to a 22% net margin — a significant snap-back from Q4 CY25's ¥141M net loss and unexplained EBITDA collapse (¥161M vs ¥735-795M in surrounding quarters). That volatility is the main fundamental blemish: cash swung ¥7.1B → ¥3.1B → ¥6.8B → ¥5.2B across four quarters, and gross margin ticked down from 46.4% to 43.3% Q/Q. Balance sheet has ¥5.2B cash against ¥11.5B debt (D/E 1.05, LT D/E 0.77), current ratio 1.53 — adequate but not fortress. Capital allocation is aggressive: HK$2B buyback authorized June 2026 through June 2027, CEO Ye Guofu personally bought $6.9M of shares in July, and a 5.65% dividend yield — though the TTM payout ratio of 118% is unsustainable absent forward EPS recovery. Forward P/E of 7.0, PEG 0.16, ROE 18.98%, ROIC 10.32% — the valuation math is compelling if margins hold.
The picture is unambiguously bearish across timeframes. The 1D and 1W charts show a persistent multi-quarter downtrend from ~$26 highs to the current $11.79, with price sitting -33% below SMA200 and -10% below SMA50, and the 52-week low at $11.12 just below. Weekly chart shows the entire 2026 range is a lower-low structure with no meaningful base yet built. The 1H chart shows a modest bounce off $11.20-11.40 support with green candles pushing toward $12, but this is a minor intraday reflex, not a trend change. RSI(14) at 41.77 is neutral-oversold. The model's forecast band projects $13.6 (1H), $17.9 (4H), and $18.1 (1D) — but calibration is critical here: the model's 1D directional accuracy (57%) matches naive baseline with a 47% MAPE, meaning it is effectively unreliable in this regime, and prior bullish projections have consistently overshot realized moves by ~17%. Key structural levels: $11.12 is hard invalidation (52W low), $12.00-12.20 is nearest supply/resistance, $13.20-13.50 is the realistic mean-reversion target zone, and $15+ is earnings-conditional.
The news flow is meaningfully constructive but has not yet moved the tape. The June 29 announcement of a HK$2B share repurchase program (running through June 2027) explicitly cited shares trading below intrinsic value — a governance-signal that matters when combined with the CEO's $6.9M personal share purchase and JPMorgan's Overweight rating (though target was cut from $26 to $16). The June 18 AGM passed all resolutions cleanly. Q1 CY26 earnings (May 26) showed a fifth consecutive quarter of revenue acceleration and strong TOP TOY growth. Analyst consensus is Strong Buy (recom 1.19) with a $19.94 price target implying ~69% upside. Broader market news is context-only noise. The signal-to-noise ratio favors the bulls, but the market is discounting all of it pending the August 20 earnings print, which will confirm or reject whether Q1 CY26's margin snap-back is durable or a one-quarter anomaly following the Q4 CY25 loss.
- TOP TOY segment +51.4% YoY — highest-growth vertical with IP-led pop toy monetization tailwind
- International expansion delivering +21.9% YoY overseas revenue, diversifying away from pure China consumer risk
- HK$2B (~$255M) buyback executing June 2026-June 2027 provides mechanical per-share tailwind on ~7% of float
- Management guidance to ¥33B revenue by 2029 vs ¥22.7B TTM implies ~10% CAGR through the decade
- Store base of 6,868+ MINISO plus TOPTOY locations providing operating leverage as store-level economics mature
- Q1 CY26 net margin of 22% (vs 9.9% Q1 CY25) — if sustainable, would drive material forward EPS upside vs consensus
- August 20 earnings is a binary catalyst — a repeat of Q4 CY25's ¥141M net loss would break the thesis and retest $10-11
- TTM dividend payout ratio at 118% is unsustainable — a cut would trigger heavy income-oriented selling
- Unexplained Q4 CY25 EBITDA collapse (¥161M vs ¥735-795M surrounding quarters) suggests possible accounting/working-capital stress not yet fully explained
- Persistent bearish trend with SMA200 -33% below price; a $11.12 break invalidates the setup and opens downside to $9-10
- Chinese ADR structural risk: PCAOB, delisting, capital controls remain latent tail risks
- Debt load of ¥11.5B against ¥5.2B cash (D/E 1.05) limits flexibility if consumer discretionary weakens further
- JPMorgan cut price target from $26 to $16 — sell-side is capitulating on near-term upside even while maintaining Overweight
- Forecast models have run systematically bullish on this name (0-1/8 recent calls printing upside targets), and 1D MAPE of 47% signals model unreliability in this regime
Get AI analysis on any stock
This is one of hundreds of Kronos AI reports — scored fundamentals & technicals, bull/base/bear price targets, a multi-horizon plan, and continuously-updated forecasts across the market. Create a free account to explore them all.
Create your free account →Already a member? Sign in · Join our Discord