MNSO — AI Stock Forecast & Price Targets
Published 8/5/2026 · A free sample of K3vl4r’s AI-powered analysis.
Kronos price forecasts, scored fundamentals & technicals, and a multi-horizon plan.
View the live MNSO price forecast →
MNSO is a deep-value Chinese specialty retailer trading at 7.3x forward P/E with 30.5% TTM sales growth, a 5.1% yield, and an active HK$2B buyback, but leverage (D/E ~1.05) and earnings quality concerns cap conviction ahead of the binary August 20 print. Price is consolidating at $12.39 just above the $11.12 52-week low, with structural resistance at $13.00-$13.50 and a stretched analyst target of $19.42 that the market clearly doesn't yet believe.
Do nothing new pre-earnings. With the print ~15 days out, IV will expand and any long position risks a binary gap. If already long, trim into any bounce toward $13.00-$13.30 to reduce exposure below full size. Invalidation: a close below $11.90 (loss of the shelf) triggers stop-out; upside trigger would be two daily closes above $13.00 on volume, but even that shouldn't be chased into the print. Do not size a swing trade around the model's $17-$19 forecast — the 1wk directional accuracy is 17% vs 50% baseline, that signal is unreliable here.
Post-earnings re-underwriting is the whole game. Bull path: operating margin holds >13%, management guides FY revenue growth >20%, and the Q1 net margin is contextualized as one-off — in that case $13.50 base breaks and $15.00-$15.50 becomes the target over 3-4 months. Bear path: operating margin compresses, opex creep from Seeking Alpha concerns is confirmed, or dividend/buyback pace is throttled — retest of $11.12 and potentially $10.00 opens up. Expected 4-month return range: -20% to +25%, skew slightly positive given valuation floor but capped by leverage overhang. What changes my mind: clean margin print + deleveraging commentary would upgrade to BUY; a net-loss quarter or dividend cut moves this to AVOID.
The 1-3 year thesis rests on Top Toy IP monetization (+111% YoY per prior dossier) and international mix shift providing structural margin lift and geopolitical hedge. If MNSO can prove Top Toy as a genuine second pillar and the international business scales past 40% of revenue, a re-rating to 10-12x forward earnings from today's 7.3x is plausible, implying $18-$22 over 24-36 months on modest EPS growth. The biggest structural risk is that China domestic discretionary spending remains weak while D/E stays >1.0, forcing a dividend cut and destroying the yield support that anchors current valuation. Secondary risk: US-China ADR de-listing / regulatory noise, which the 0.13 beta masks.
Top-line momentum is genuine: TTM revenue is CN¥22.7B (+30.5% Y/Y), Q1 CY26 revenue was CN¥5.69B (+35% Q/Q on the snapshot), and the four quarterly prints show sequential revenue expansion. Gross margin is holding in the 43-46% band, and operating margin ran 12-16% across the last four quarters — solid for specialty retail. However, Q1 CY26's headline net income of CN¥1.25B (22% net margin) is clearly out of line with the CN¥700M operating income for the same quarter, implying a large non-operating gain that will not recur — this is the core earnings-quality risk. Balance sheet shows CN¥7.0B cash against CN¥11.5B debt (net debt ~CN¥4.5B, D/E ~1.05), a current ratio of 1.53, and ROE of 18.98% / ROIC of 10.32%. Capital allocation is shareholder-friendly (5.1% yield, HK$2B buyback), but the 118% payout ratio and net debt position mean returns are partially debt-financed. Free cash flow data is not disclosed in the snapshot — a gap worth flagging.
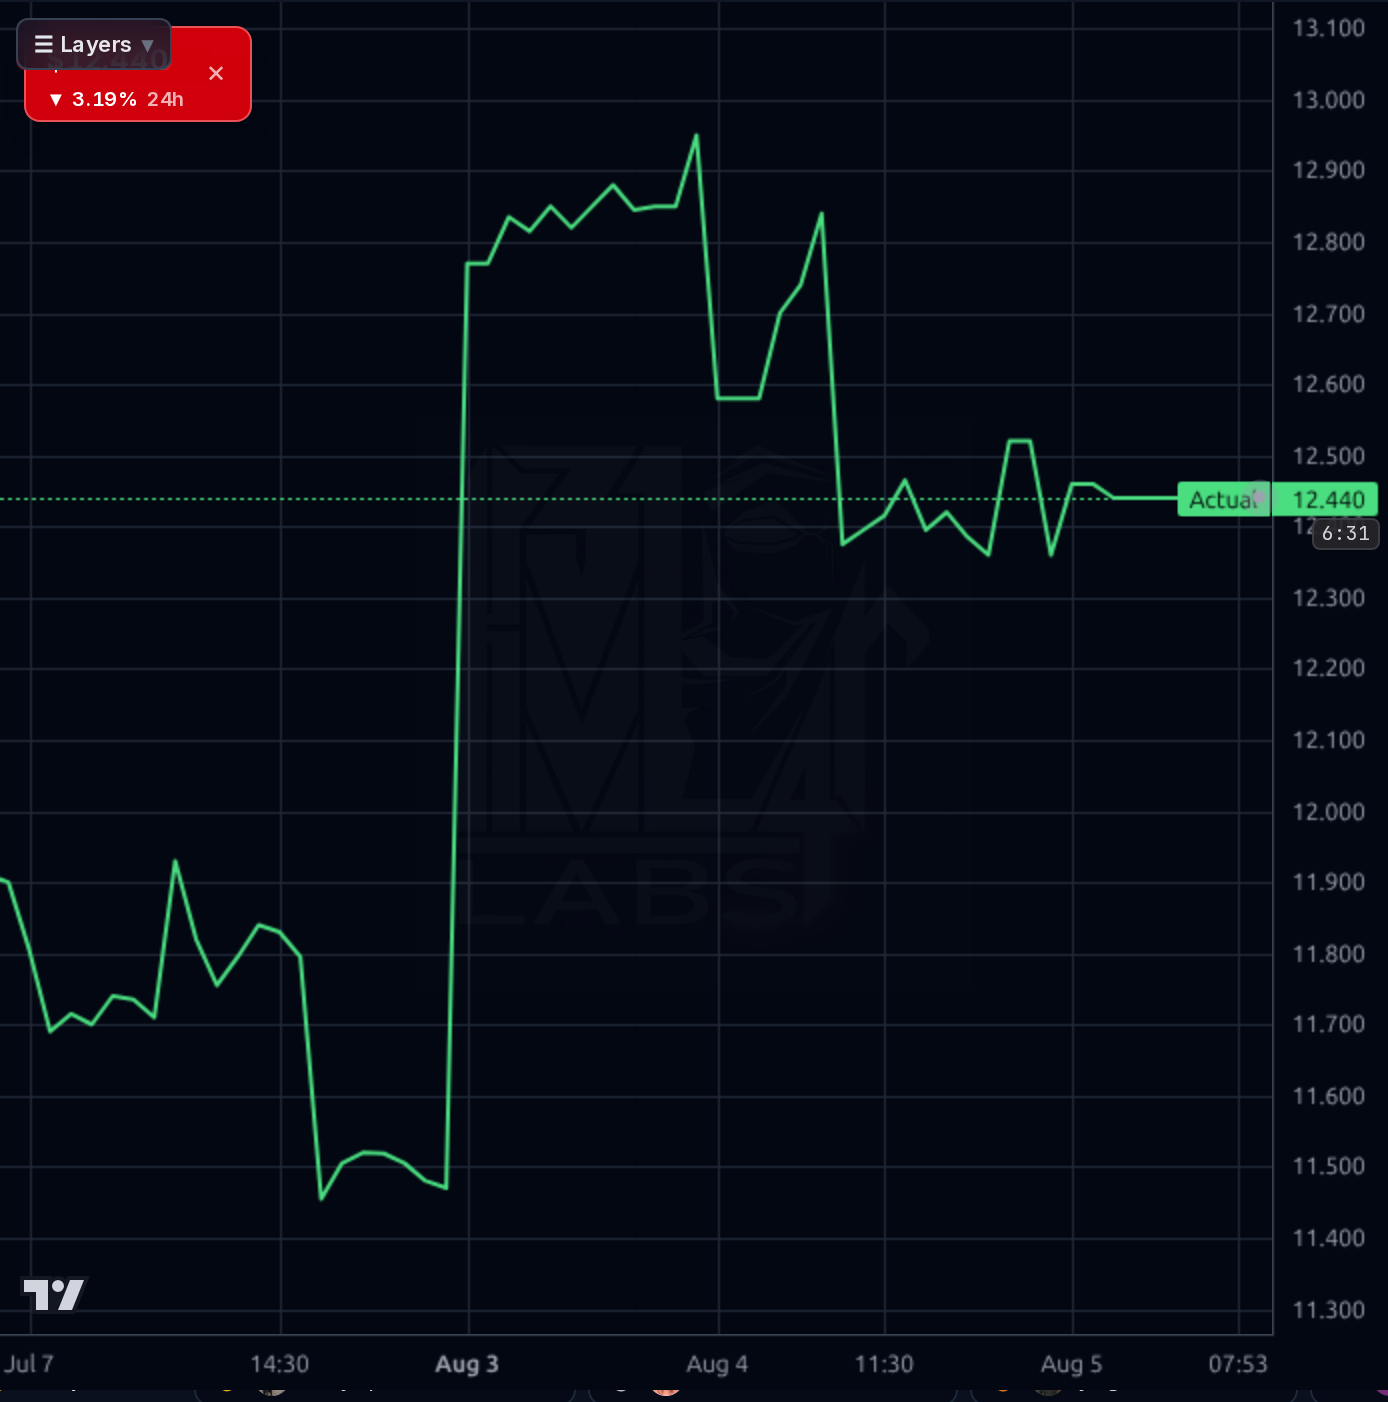
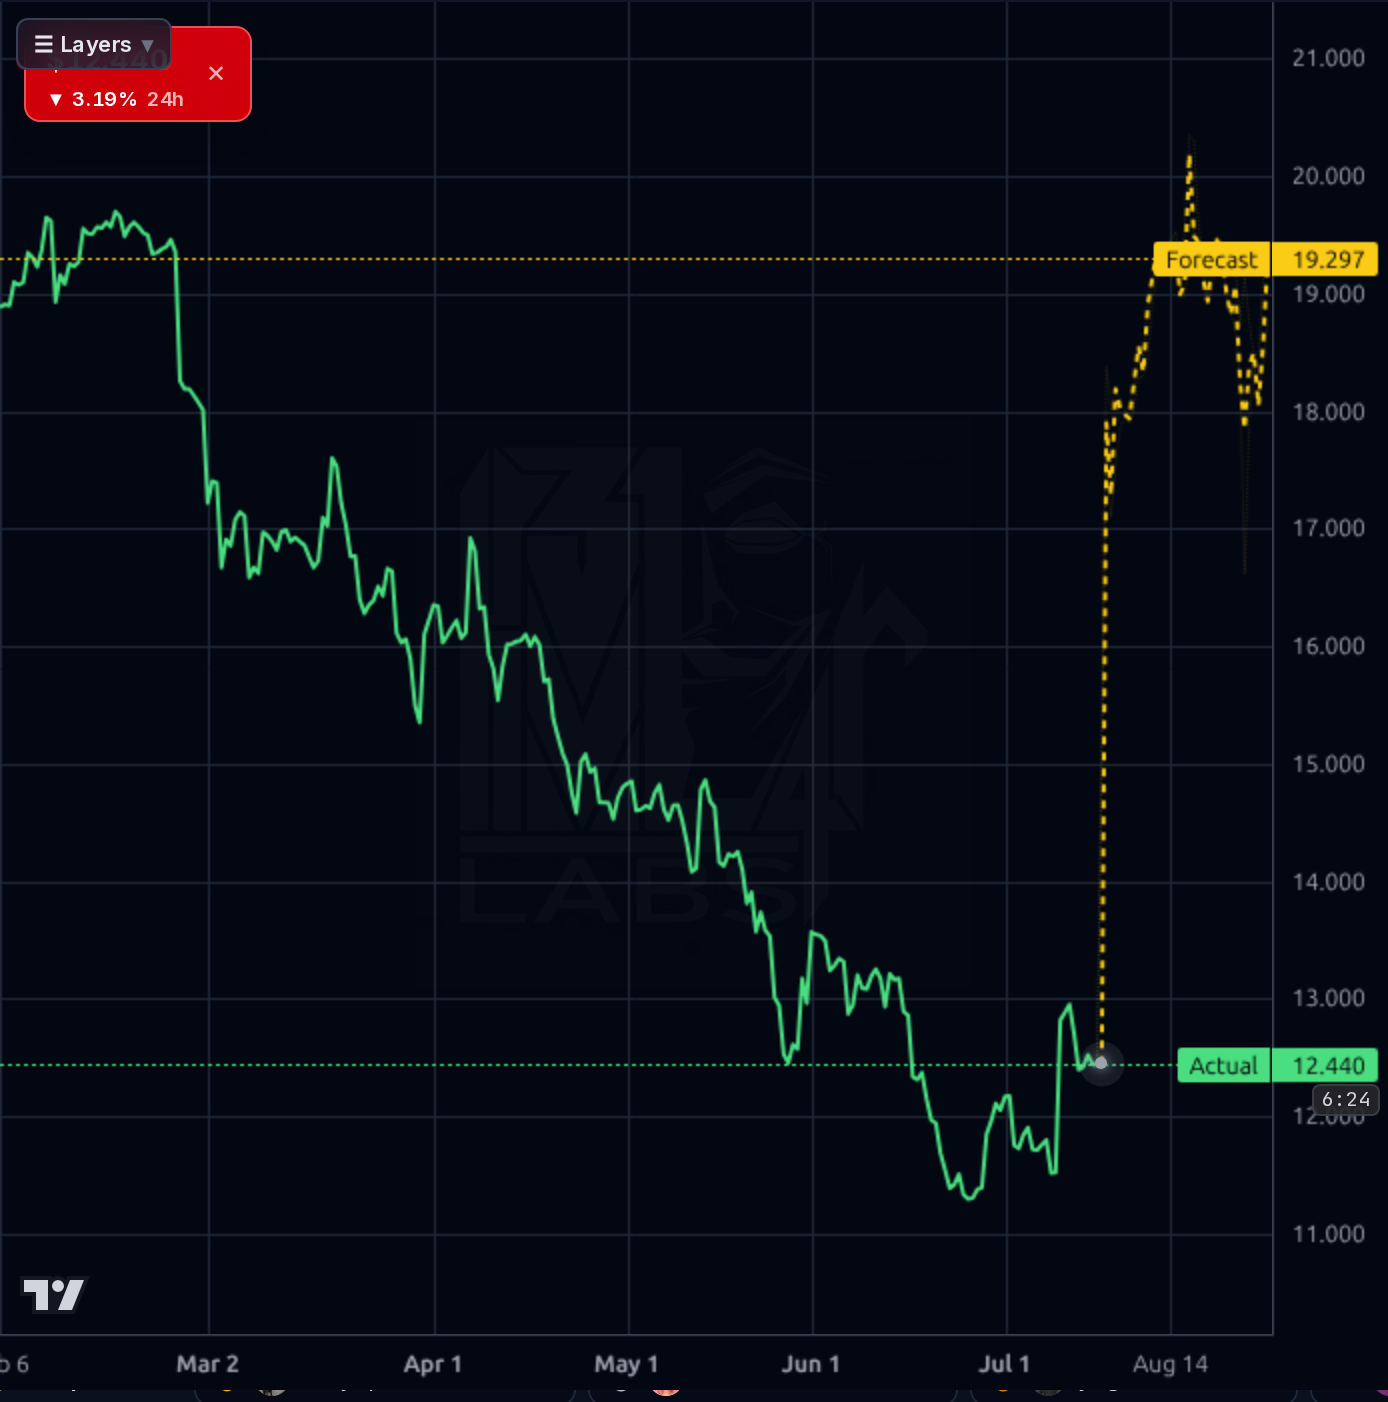
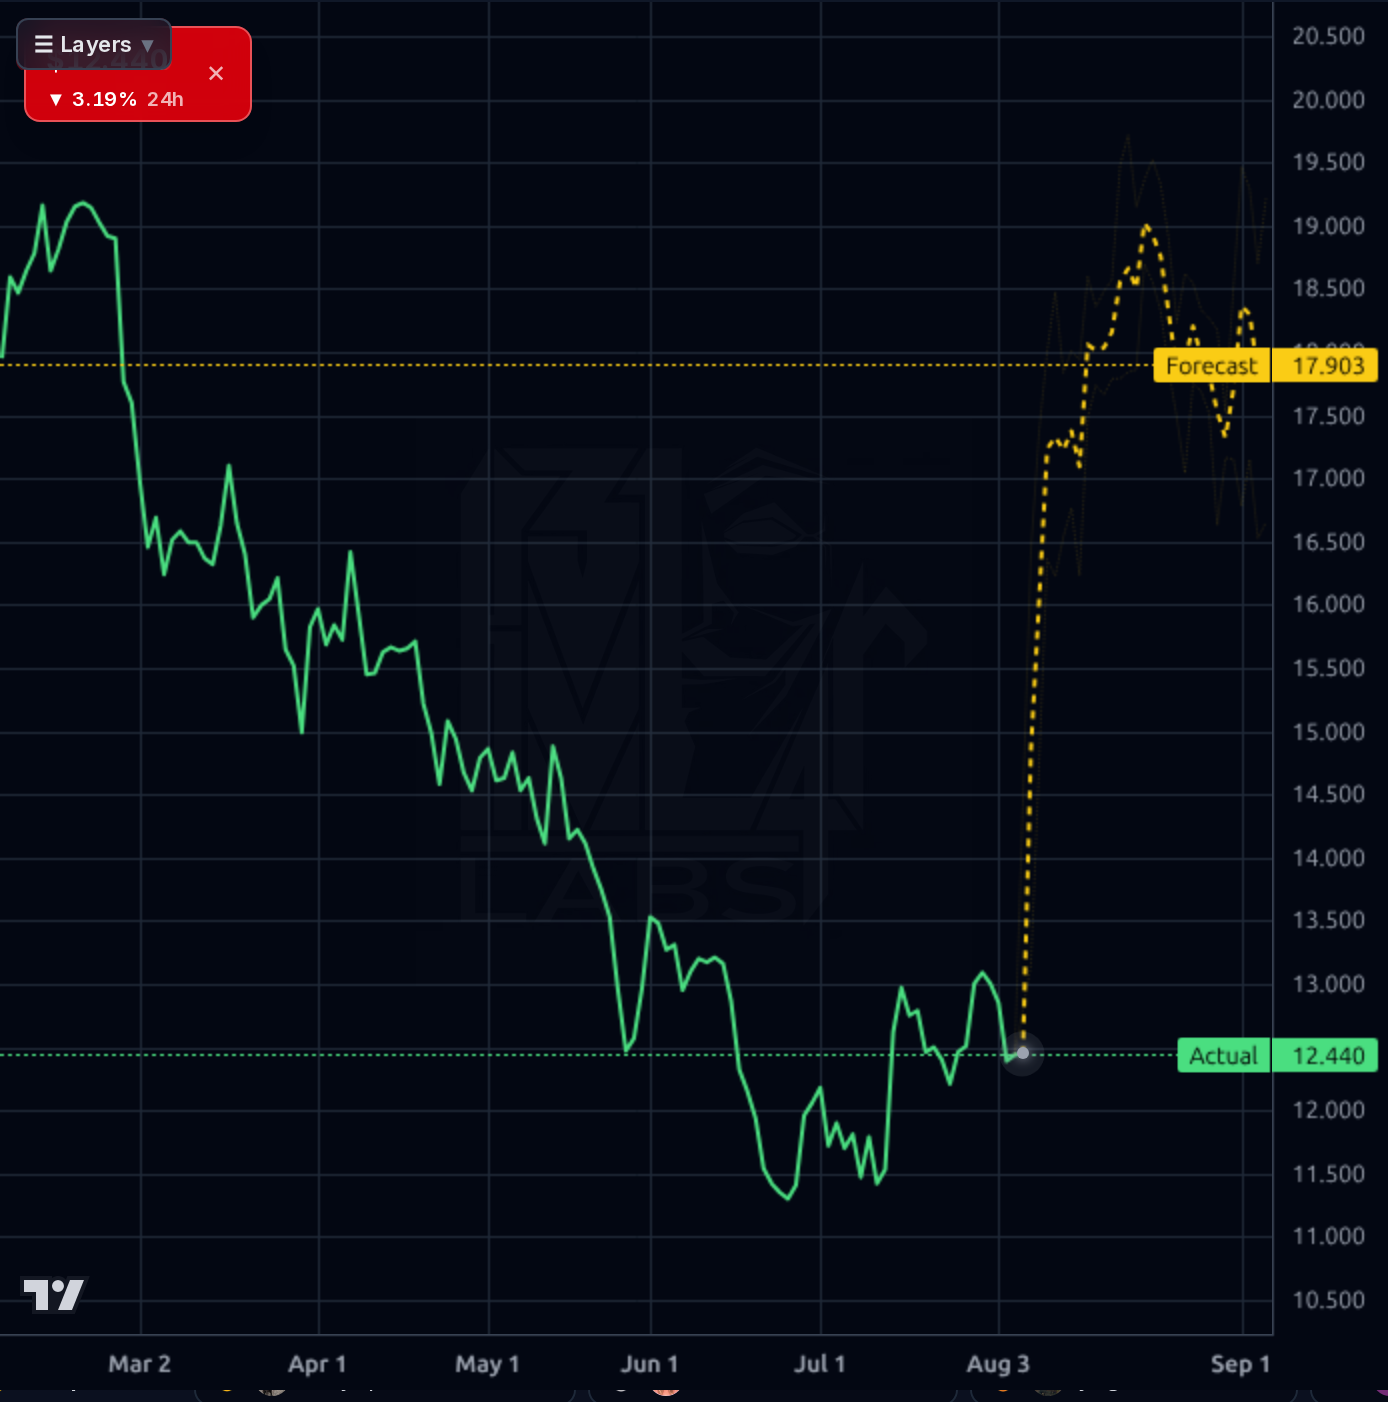
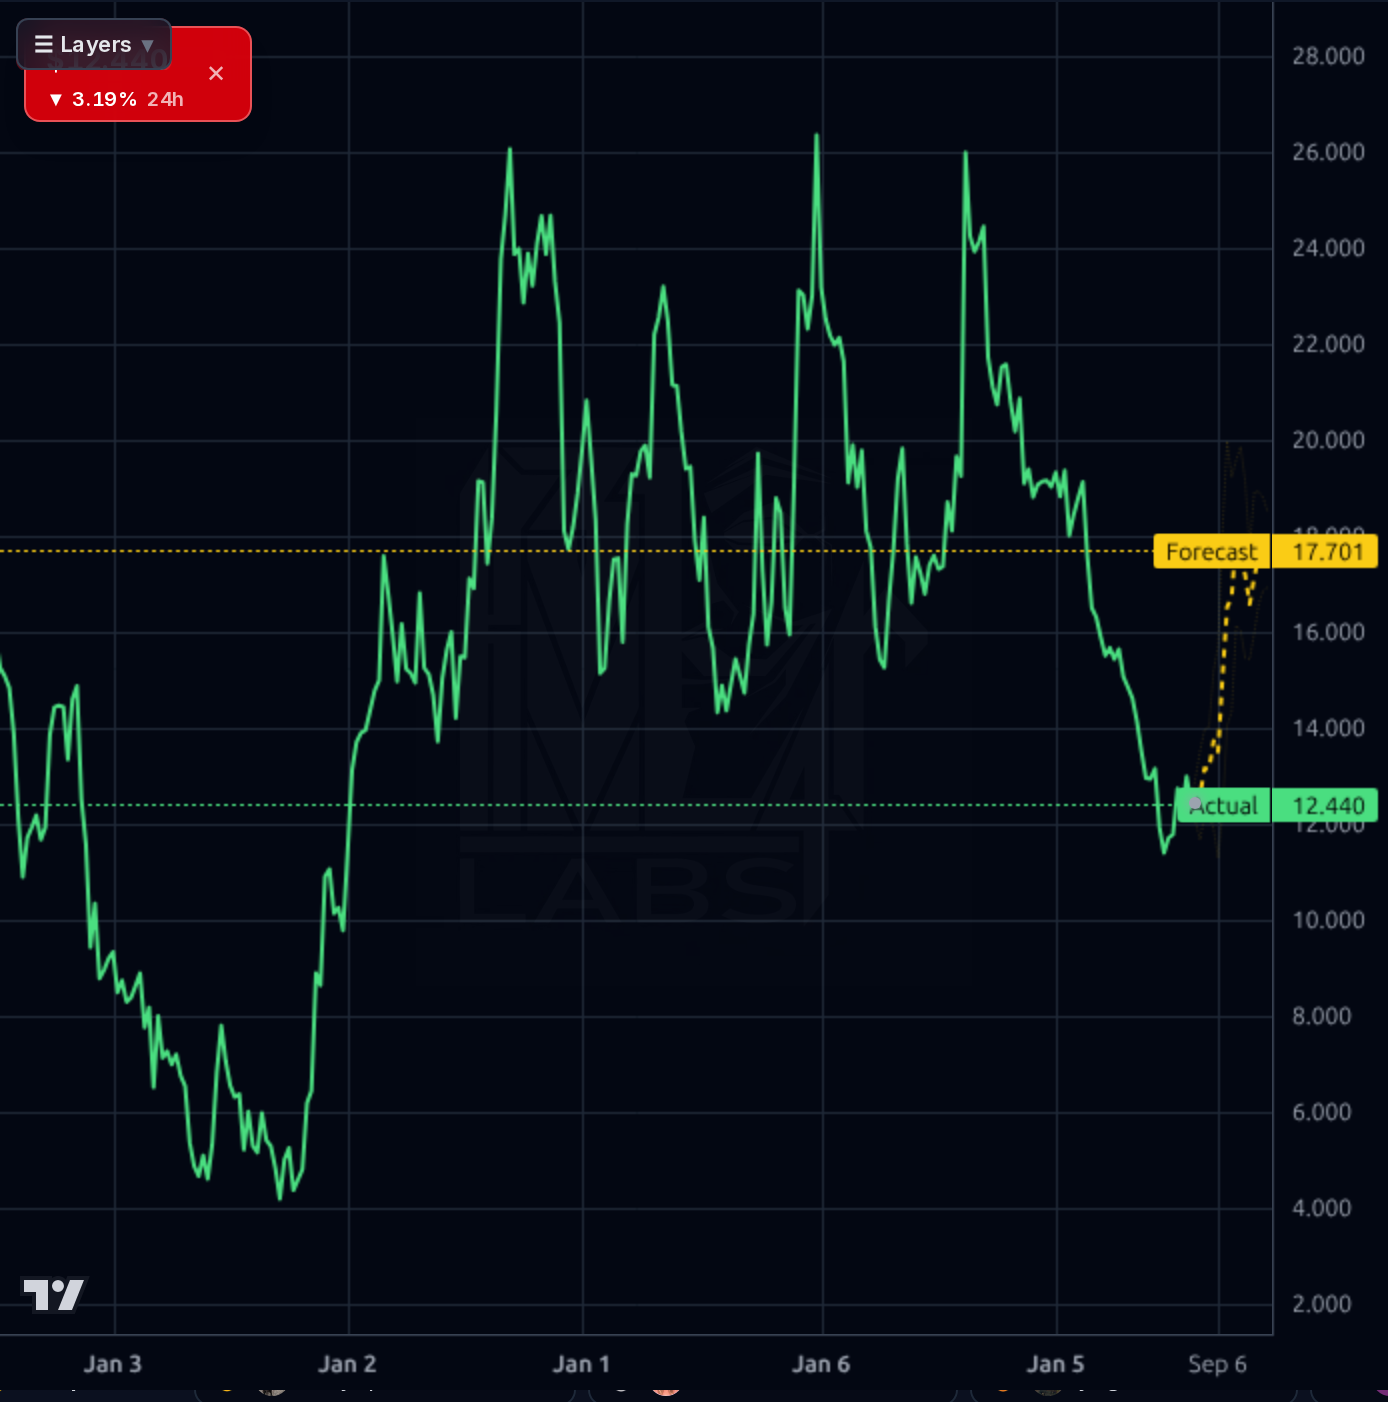
Across timeframes the picture is a broken downtrend attempting to base. The weekly chart shows a multi-year decline from the mid-$20s to a $11.12 low, with price now at $12.39, well below the SMA200 (-26.5%) — this is a bottoming attempt, not a confirmed uptrend. The daily chart confirms a July reclaim of the $12.00 shelf followed by rejection at ~$13.00, with the stock now sitting on the 20/50 SMAs (-0.09%/-0.52%) and RSI at 48 — neutral, no momentum. The 1h chart captures the last two sessions: a spike to ~$12.95 on Aug 3, then a fade to $12.40 with 24h down 3.19%. Support: $12.00-$12.20 (must hold), then $11.50 and the $11.12 low. Resistance: $12.90-$13.00, then $13.50 and the structural $15.00-$15.50 zone. The model's forecast band ($17.90-$19.30) is aggressive and, given that the multi-day/weekly directional accuracy (17%) is below naive baseline, should be heavily discounted — it has repeatedly failed to print on this name.
News flow is mixed and largely valuation-focused rather than catalyst-driven. Simply Wall St. (Aug 4) notes MNSO is -34.1% YTD and argues shares may be pricing in more pessimism than fundamentals warrant. Zacks (Jul 29) flags a bullish ABR consensus but warns to be skeptical of it. The most substantive piece is a Seeking Alpha downgrade to Hold (Jul 28) citing the Yonghui investment overhang, execution risks, and rising opex — this is the sell-side pushback that matters and aligns with the earnings-quality concern. The remaining items are daily price-move recaps and add no signal. Retail sentiment on social is uniformly bullish and mentions a Chiikawa IP collaboration driving foot traffic — consistent with the Top Toy segment strength but treat as noise. Broader market news (BLMN, CVS, ZBH guidance updates) is unrelated. Net: no new catalyst, the $19.42 street target is stale relative to price action, and the Aug 20 print is the only event that matters.
- Top Toy segment scaling as a second pillar — prior dossier flags +111% YoY growth in this IP-driven business, aligned with retail chatter about the Chiikawa collaboration
- International revenue mix expansion providing margin accretion vs. mature domestic China stores
- HK$2B buyback executing into a depressed share price, providing per-share support even if fundamentals only tread water
- Q1 CY26 sales +35% Q/Q signals store-count expansion and same-store growth are both still contributing
- Forward EPS of CN¥1.69 vs TTM CN¥0.95 (+78%) if consensus is right, would drive the forward P/E to ~7.3x and force multiple expansion
- Earnings quality: Q1 CY26 net income of CN¥1.25B far exceeded operating income of CN¥700M, implying non-recurring gains — Aug 20 print will expose this
- Leverage: CN¥11.5B total debt vs CN¥7.0B cash and 118% dividend payout ratio — capital returns are partially debt-financed
- Seeking Alpha (Jul 28) flags Yonghui investment overhang and rising opex as concrete deterioration signals
- SMA200 distance of -26.5% and YTD -33.9% confirm a broken long-term trend that a single earnings print cannot fully repair
- Chinese consumer discretionary cycle risk — cyclical exposure with limited pricing power
- Model's own multi-day forecast accuracy (17%) is below naive baseline, meaning the bullish $17-$19 forecast band should be heavily discounted
- ADR / geopolitical tail risk on any US-China regulatory escalation
Get AI analysis on any stock
This is one of hundreds of Kronos AI reports — scored fundamentals & technicals, bull/base/bear price targets, a multi-horizon plan, and continuously-updated forecasts across the market. Create a free account to explore them all.
Create your free account →Already a member? Sign in · Join our Discord