
MORN— AI Stock Forecast & Price Targets
Published 6/19/2026 · A free sample of K3vl4r’s AI-powered analysis.
Kronos price forecasts, scored fundamentals & technicals, and a multi-horizon plan.
View the live MORN price forecast →
Morningstar is a high-quality data/analytics franchise (30.7% ROE, ~16% net margin, 53.97% gross margin) trading at a sharp discount after a -45% 12-month drawdown, with the stock at $164 vs. a $246 sell-side target and a 0.59 PEG. However, the Kronos forecast and price action point to continued near-term weakness toward $150-155 before any sustained recovery, and the leveraged balance sheet (Debt/Eq 1.87) plus a Q1'26 working capital squeeze warrant caution before sizing up.
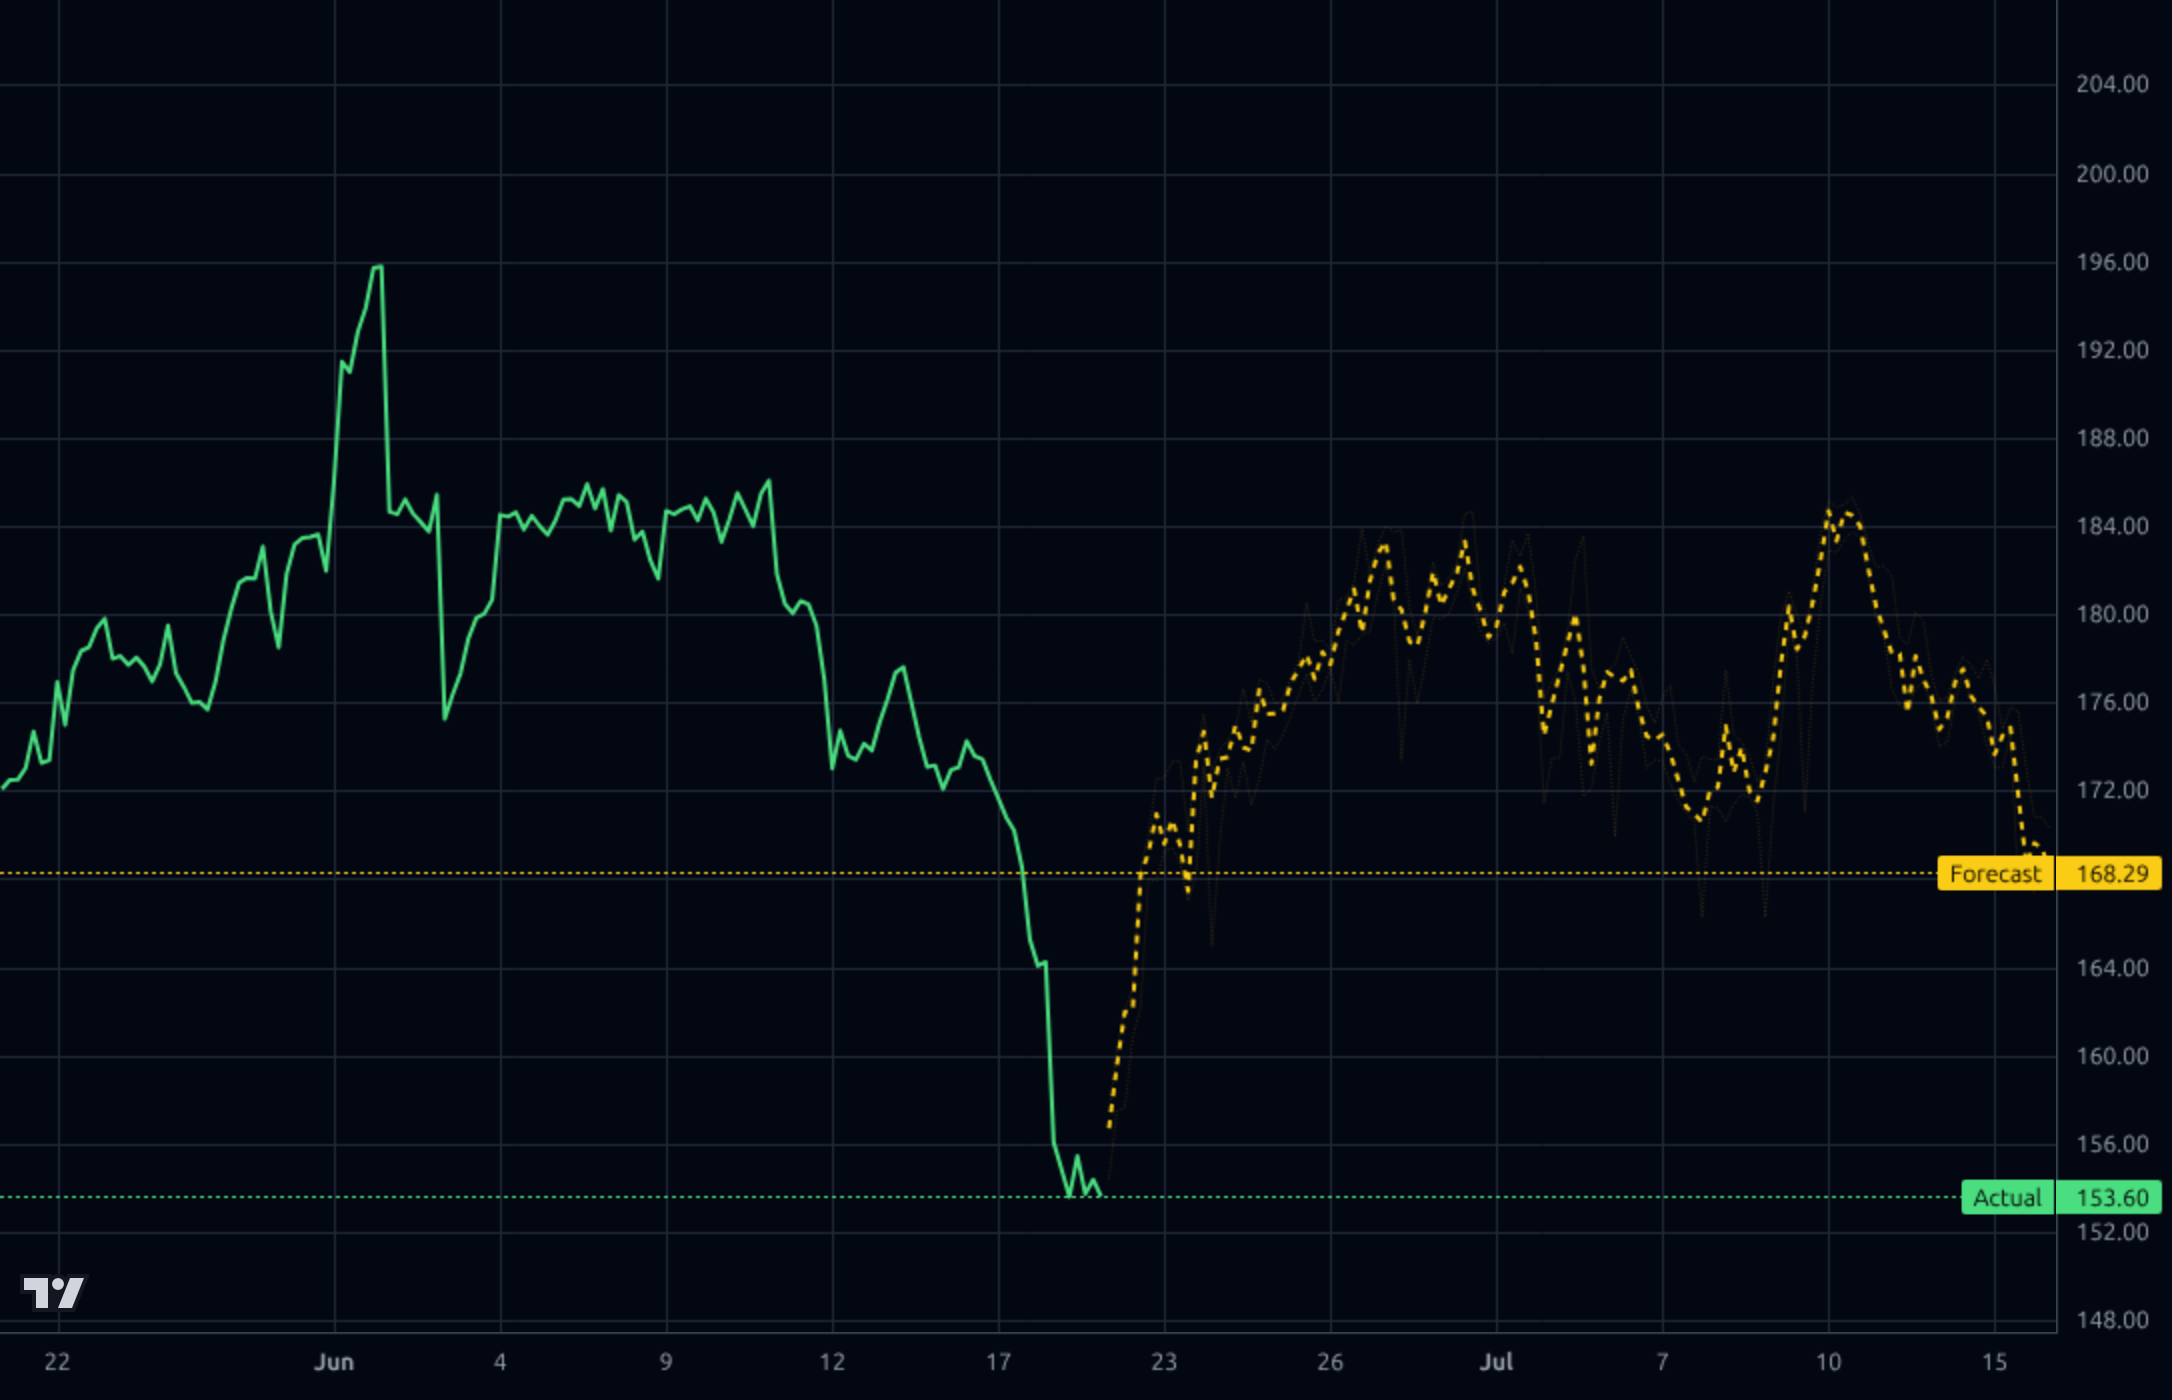
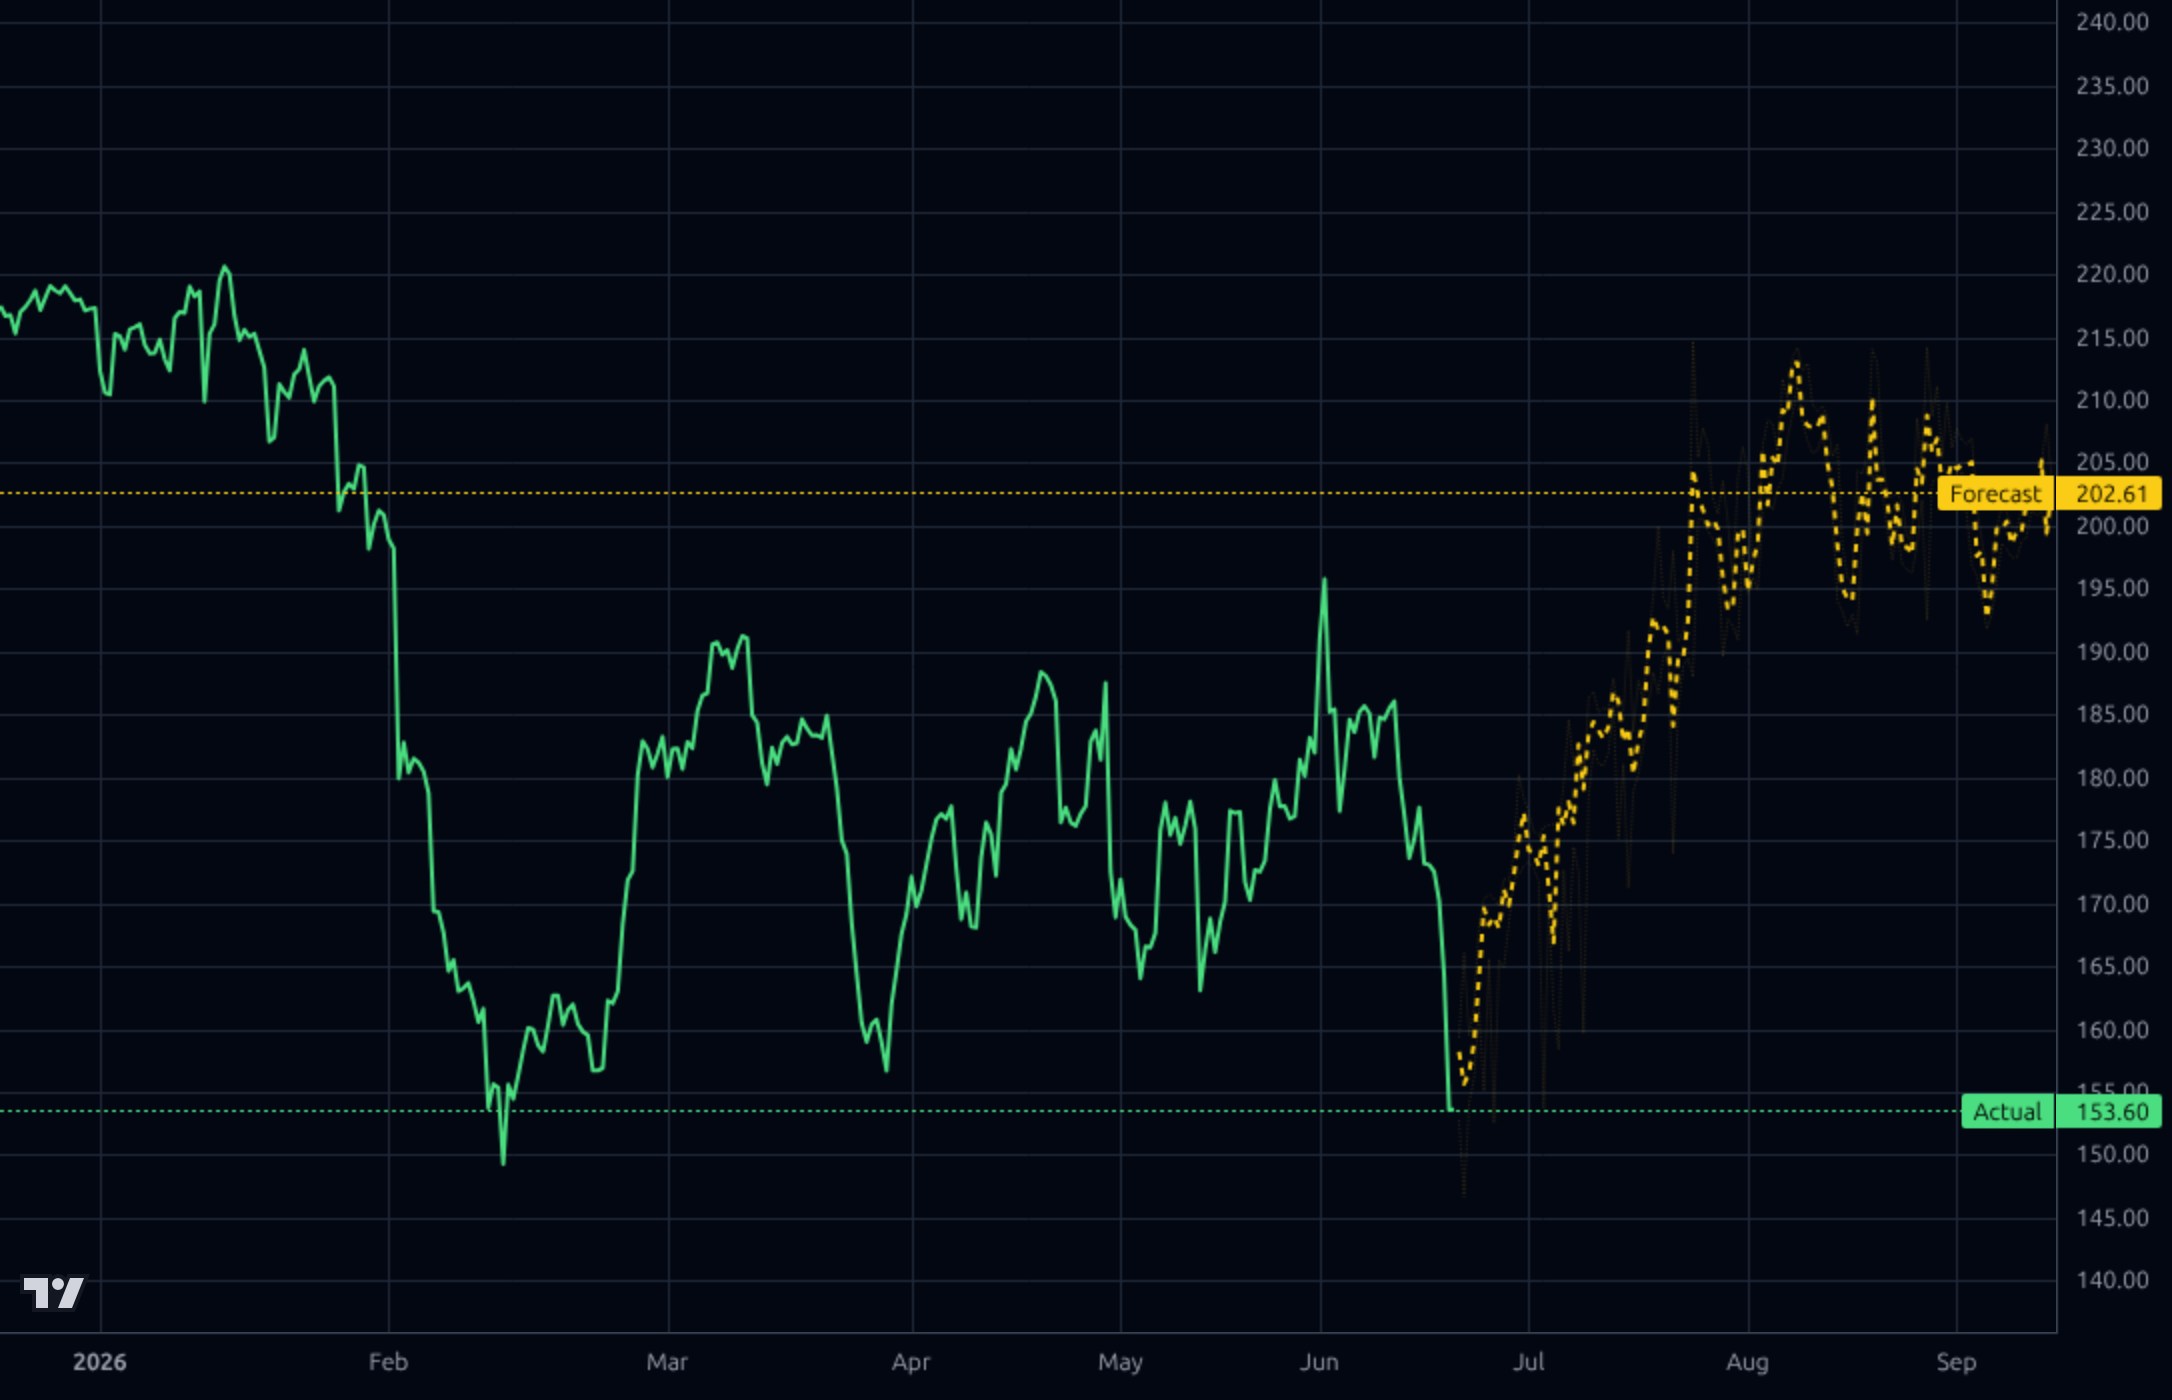
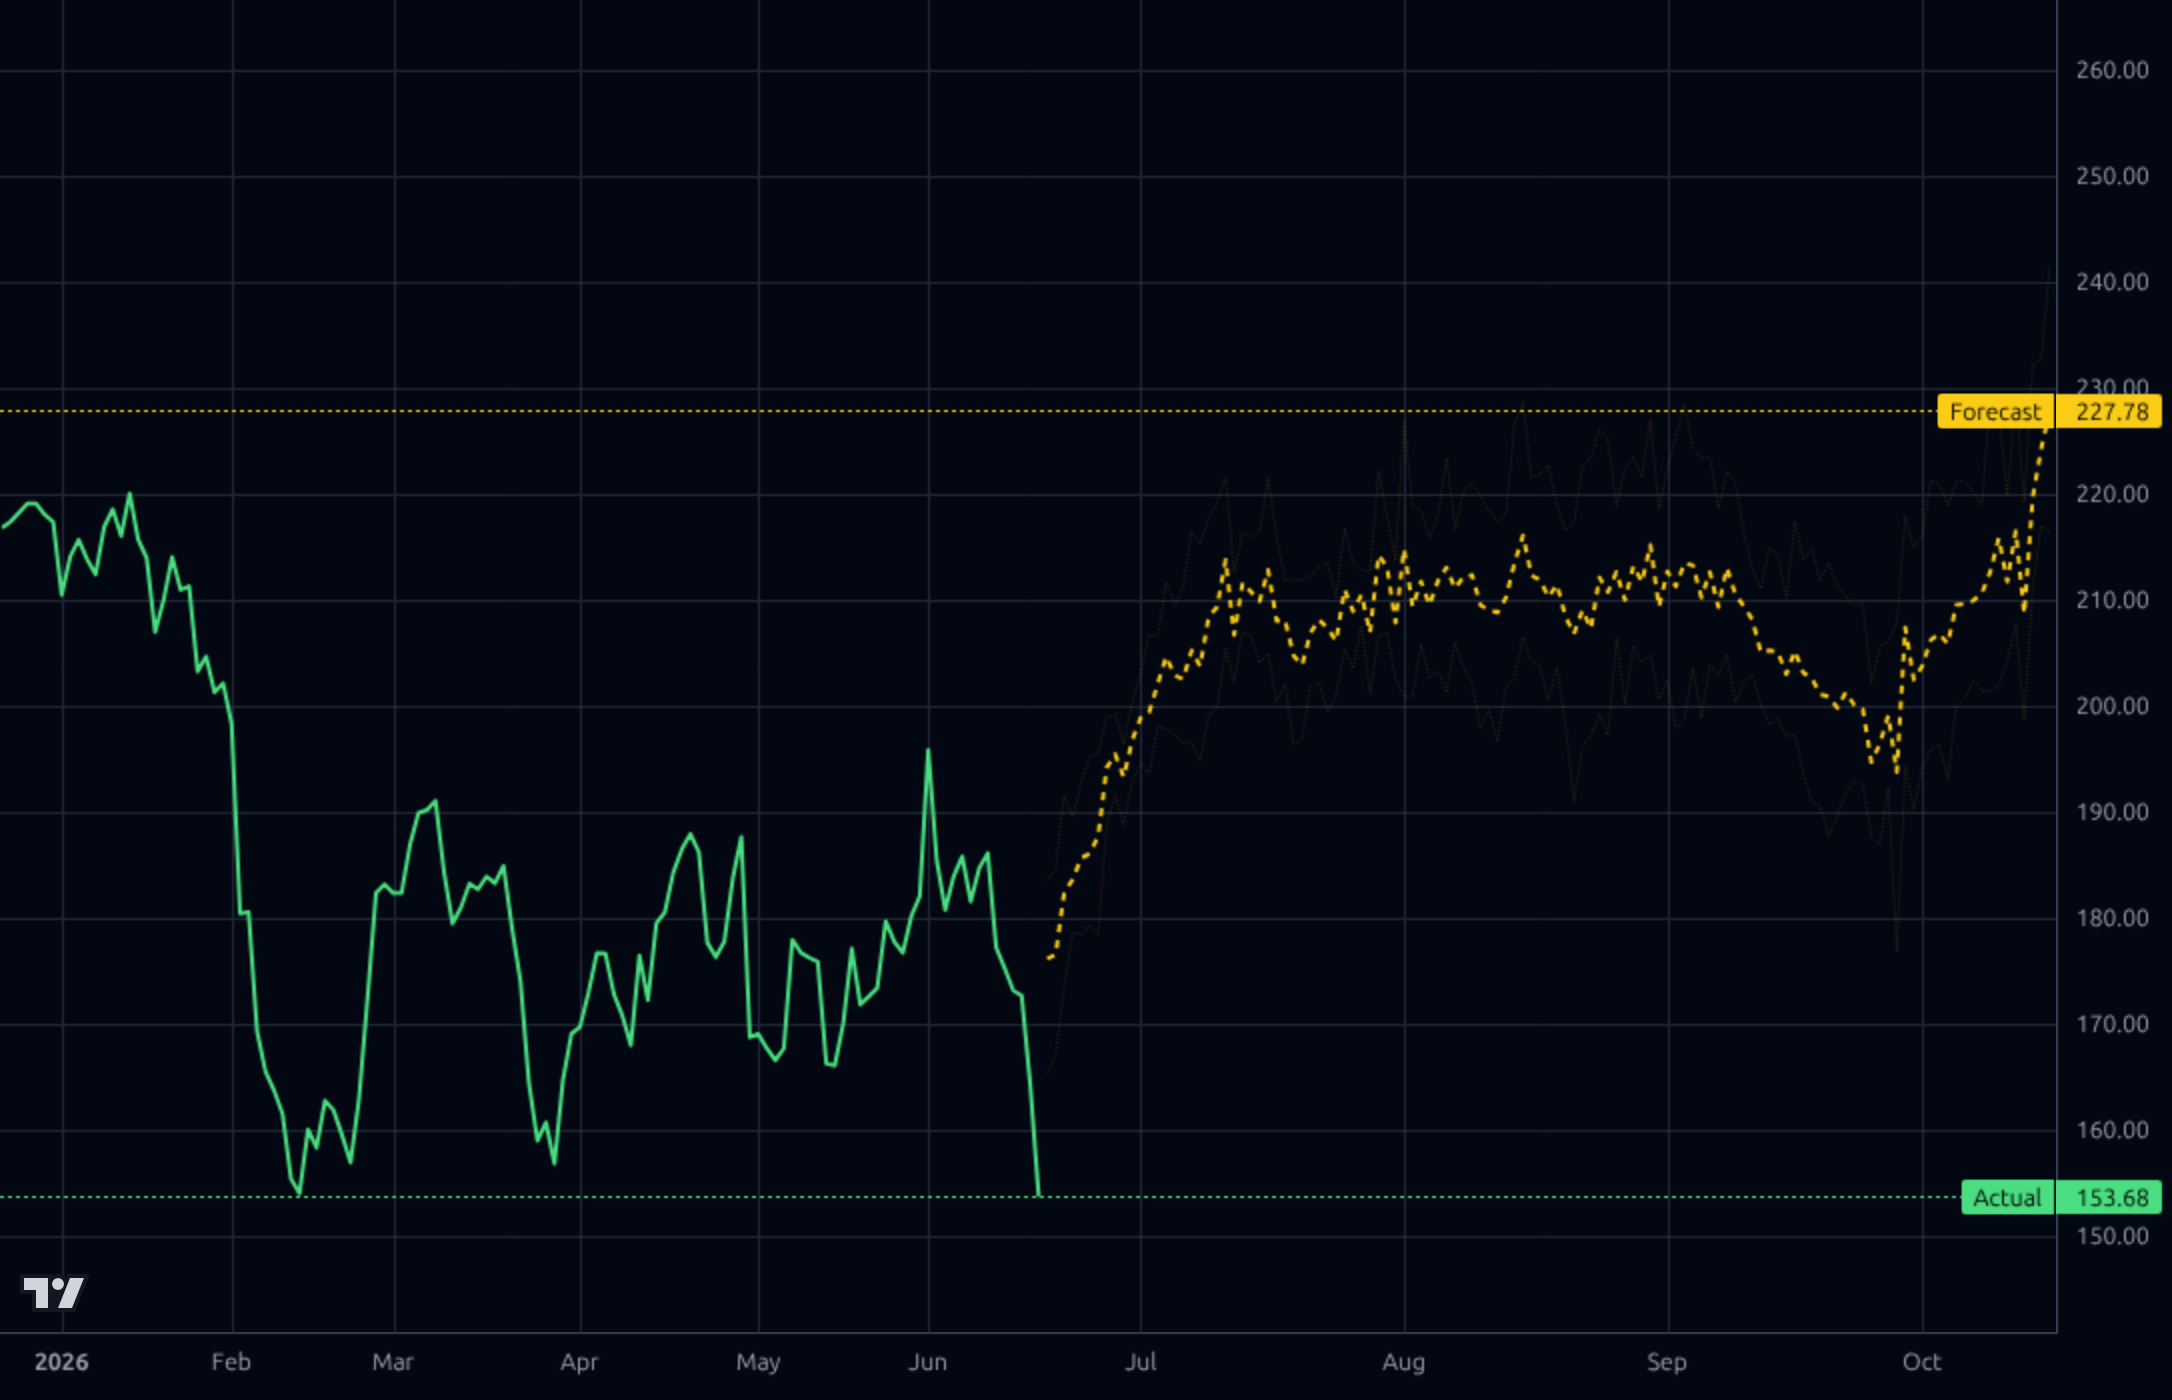
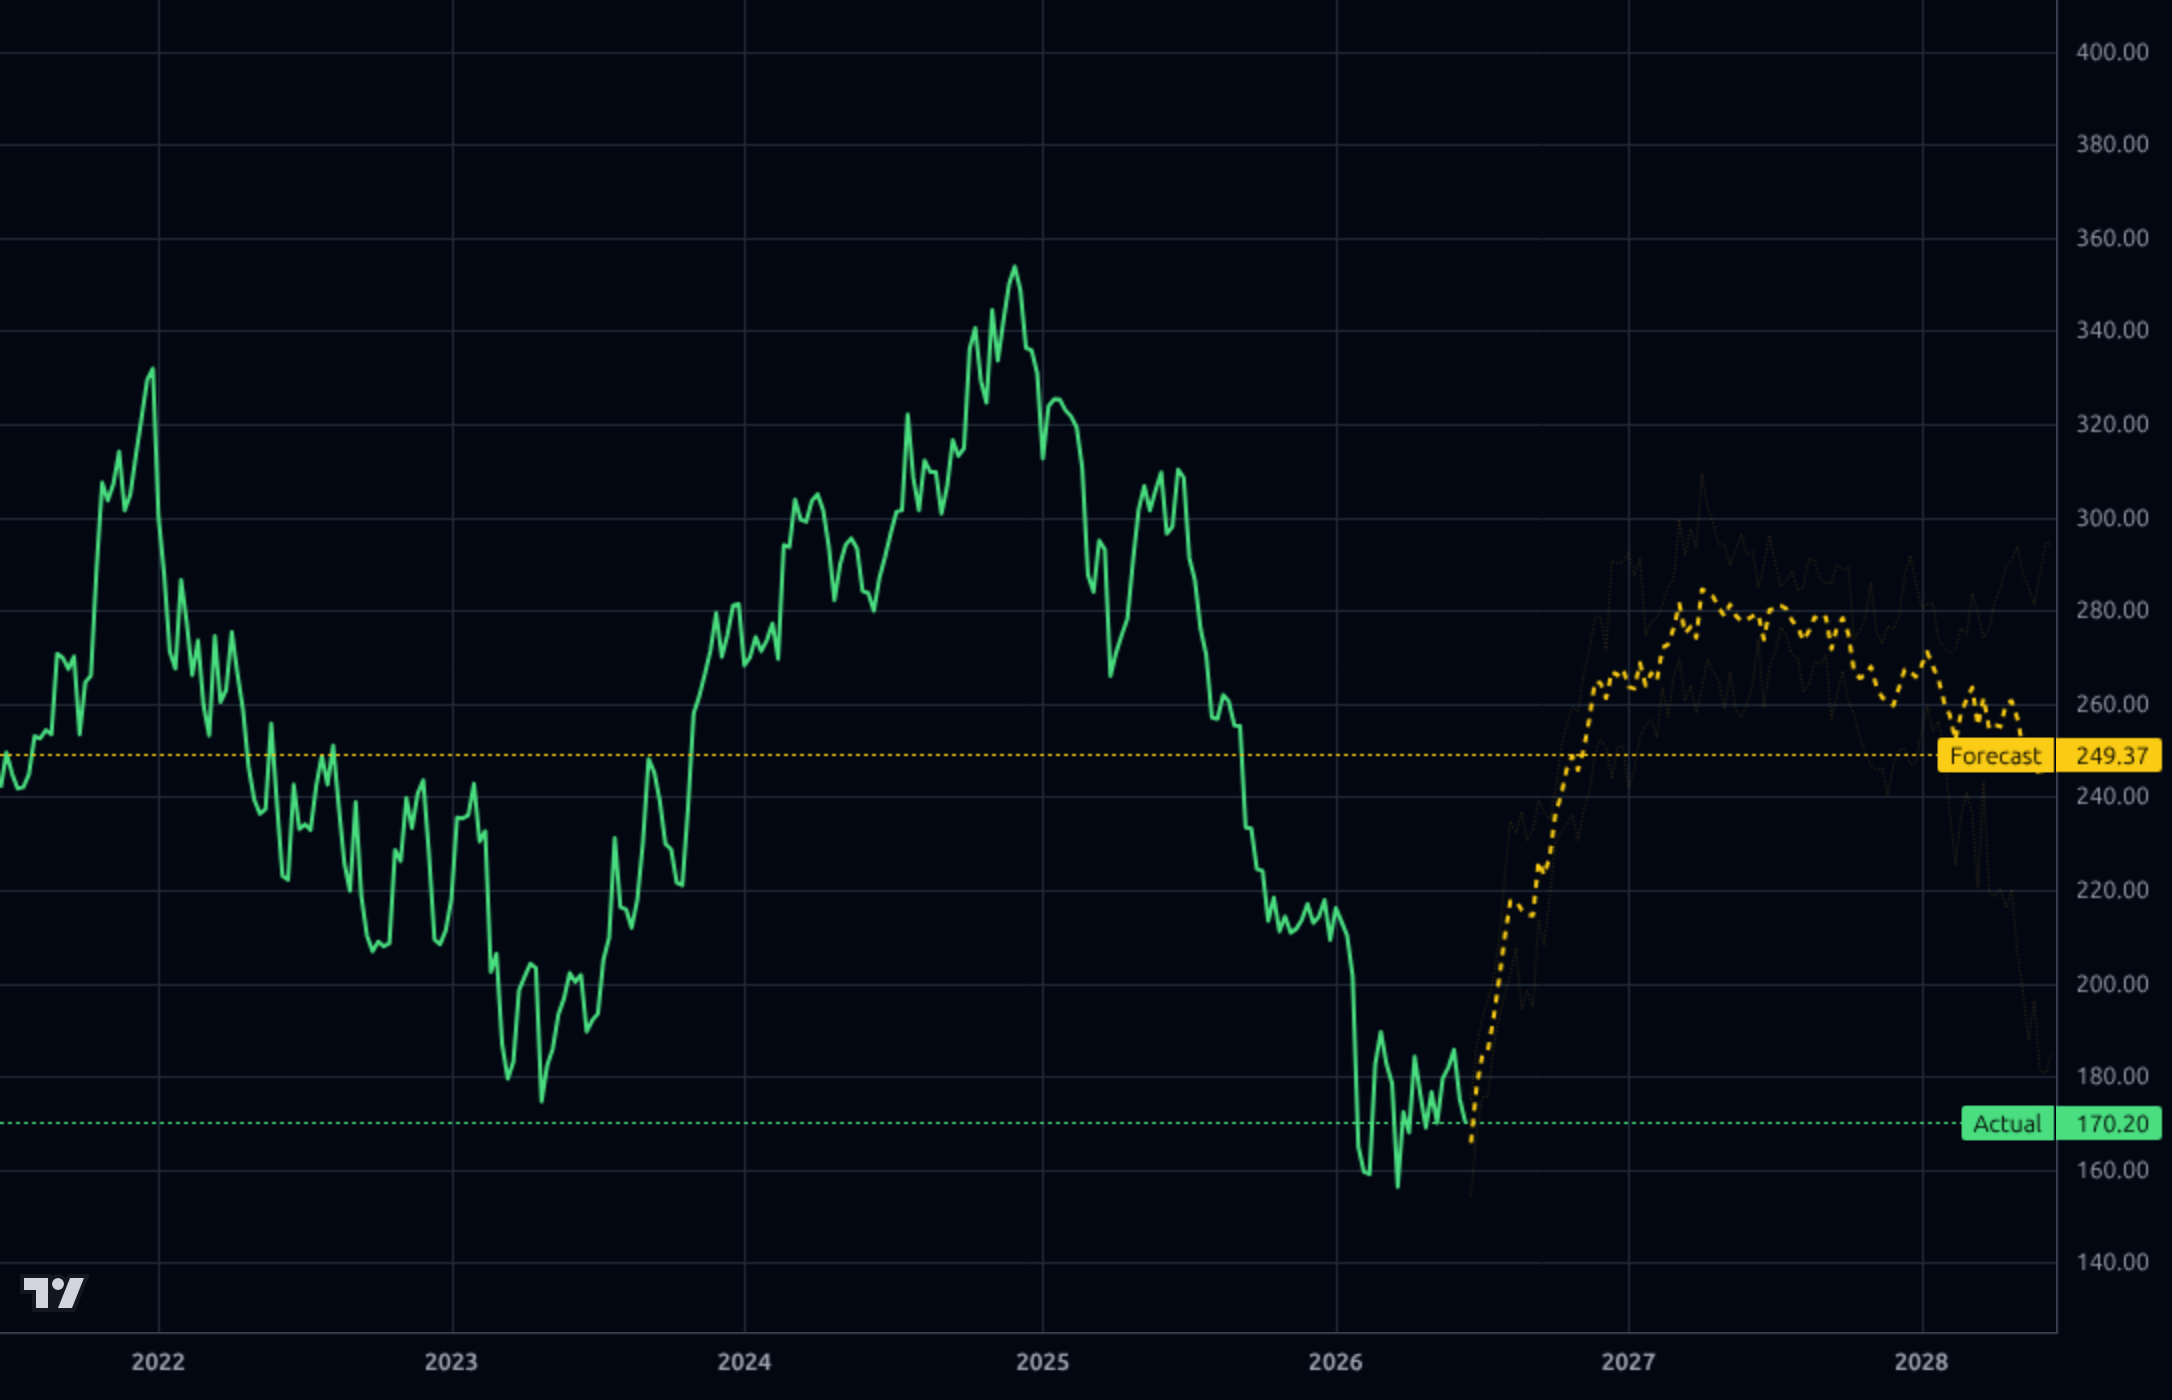
Wait. The stock just lost 12% in a week and printed a fresh low at $153.60 with no reversal signal yet. RSI 37 has room lower. I would not chase. A defined-risk starter (¼ position) only on either (a) a reclaim of $172 with volume, or (b) a tag of $148-150 (prior Jan low / 52w low $149.08) with a bullish reversal candle. Hard invalidation below $145 on a daily close — that opens $135. Avoid catching the falling knife inside the gap.
Over 1-6 months the setup is asymmetric if balance sheet concerns prove transitory. Forward P/E of 12.1 and PEG 0.59 on a 30%+ ROE business with 20%+ next-5Y EPS growth estimates is genuinely cheap. Catalysts: (1) Q2 earnings late July clarifying the debt jump and FCF dip; (2) traction in the Apollo/Franklin/JPM public-private models; (3) PitchBook/private-markets pipeline. Base case re-rating to $190-205 (~22-25% upside) over 3-6 months if Q2 confirms margin trajectory. Thesis breaks if Q2 prints decelerating organic revenue, or if the $645M debt increase relates to an underwhelming acquisition.
Over 1-3 years, MORN remains a high-quality compounder with a defensible data/analytics moat (PitchBook, Morningstar Direct, Wealth platform, credit ratings) and an emerging private-markets distribution angle that should be margin-accretive. Insider ownership of 48.77% (Joe Mansueto) aligns capital allocation. The 10-year performance of +102% with 8-12% organic revenue growth supports a re-rating back toward $250+ over the cycle. The biggest structural risk is secular pricing pressure on ratings/data from passive flows and AI-driven research substitution, plus rising competition from S&P, MSCI, and FactSet in private markets data.
Revenue growth is steady and accelerating modestly: quarterly revenue stepped from $605.1M (Q2'25) → $617.4M → $641.1M → $644.8M (Q1'26), with Sales Y/Y TTM of 8.39% and Sales Q/Q of 10.81%. Profitability is improving: gross margin expanded to 62.9% in Q1'26 from 61.9% a year earlier, operating margin hit 24.2% (vs. 20.7% in Q2'25), and EBITDA reached $209.1M. EPS Q/Q growth of 49.6% and EPS past 3Y of 75.4% reflect strong operating leverage on the data/research franchise. Returns are excellent: ROE 30.66%, ROIC 14.06%, ROA 10.64%. The concern sits on the balance sheet — total debt jumped to $1.906B in Q1'26 from $1.261B in Q4'25 (Debt/Eq 1.87, LT Debt/Eq 1.81), equity dropped to $1.019B from $1.514B in Q3'25, and working capital is razor-thin at $32.6M with Current/Quick ratios both 1.00. Q1'26 operating cash flow ($91.5M) and FCF ($53.6M) were also notably weaker than Q4'25 ($204M / $161.3M), suggesting some seasonality or a one-time hit. Trailing FCF still supports the 21% payout ratio and the recently declared $0.50 quarterly dividend.
The tape is broken across every timeframe. The 1h chart shows a vertical break from ~$185 on June 12 to $153.60 by June 19 (-17% in a week, consistent with the -11.7% weekly print). On the 4h chart, $153.60 is now a fresh multi-month low; the prior late-Jan low was ~$150, making $148-150 the next critical support — a break opens air pocket risk. RSI(14) at 37.6 is oversold but not capitulation-level; price sits -8.4% below SMA20, -7.2% below SMA50, and -17.7% below SMA200, confirming a stage-4 downtrend. The Kronos forecasts are constructive on a 1-3 month horizon (1h targets $168, 4h targets $202, 1d targets $227) — implying a mean-reversion bounce — but the weekly forecast at $249 only matches the analyst target and would require a full trend repair. Worth flagging: the model's recent 30d accuracy is poor (directional accuracy 0/10, MAPE 13%, MAE $20.7), so the forecast magnitudes should be discounted. Short float of 9.94% with a 3.8 short ratio adds squeeze fuel if $153 holds. Key levels: support $150/$149 (52w low), resistance $172 (prior shelf) then $185.
The signal item is the June 17 announcement that Morningstar Wealth is partnering with Apollo, Franklin Templeton, and JPMorgan Asset Management to launch a suite of public/private model portfolios — a meaningful strategic pivot into private markets distribution for advisors, leveraging Morningstar's independent research brand. This is reinforced by Reuters and Daily Upside coverage and aligns with the secular trend of retail access to private credit/equity via interval funds. Separately, the board declared a $0.50 quarterly dividend (consistent with April), and the StepStone/PitchBook deal-level benchmarking launch is a competitive read-across — PitchBook (a Morningstar property) is deepening institutional data integrations, defending its private-markets data moat. Noise items include the generic small-cap and advisor-switching articles. Net: news flow is incrementally bullish on strategy but does not explain the recent stock collapse, which appears to be a valuation/earnings-driven re-rating ahead of/around the April 29 earnings event.
- Public/private model portfolios with Apollo, Franklin Templeton, JPMorgan AM — first-of-kind distribution channel monetizing Morningstar Wealth + research brand into the advisor channel (June 17, 2026)
- PitchBook private-markets data expansion via StepStone deal-level benchmarking integration — deepens institutional moat in PE/VC/infrastructure data
- Operating leverage trajectory: gross margin 62.9% and operating margin 24.2% in Q1'26 (vs 20.7% Q2'25), suggesting continued earnings compounding above revenue growth
- Sales acceleration: Q1'26 revenue +10.8% Q/Q and EPS Q/Q +49.6% point to a re-acceleration phase for the core franchise
- Capital return discipline: 21% payout ratio with 8.4%/8.8% 3/5Y dividend growth provides downside support and signals management confidence
- Balance sheet step-change: total debt jumped from $1.26B to $1.91B in one quarter and equity fell ~$200M — unexplained and a near-term overhang until disclosed
- Technical breakdown: -45.4% trailing 12 months, -24.4% YTD, -11.7% past week, sitting on the 52-week low with no bottoming signal
- Kronos model recent accuracy is poor (0% directional, 13% MAPE on 1d, 30d window) — forecasted bounce to $168-$249 should be discounted
- Working capital tightness: Current and Quick ratios at 1.00, working capital only $32.6M against $1.9B in debt
- Q1'26 FCF cratered to $53.6M from $161.3M in Q4'25 — possible seasonality but raises payout-coverage questions if it persists
- Sector competitive pressure from MSCI, S&P Global, FactSet, and emerging AI-driven research substitutes compressing data/research pricing power
- 9.94% short float with 3.8 days-to-cover — bears clearly positioned, and elevated short interest typically precedes informed downside
- Sell-side $246 target implies ~50% upside but Recom of 1.00 (strong buy) is a crowded view that has been wrong — analyst capitulation is a near-term risk
Get AI analysis on any stock
This is one of hundreds of Kronos AI reports — scored fundamentals & technicals, bull/base/bear price targets, a multi-horizon plan, and continuously-updated forecasts across the market. Create a free account to explore them all.
Create your free account →Already a member? Sign in · Join our Discord