
MSFT— AI Stock Forecast & Price Targets
Published 6/14/2026 · A free sample of K3vl4r’s AI-powered analysis.
Kronos price forecasts, scored fundamentals & technicals, and a multi-horizon plan.
View the live MSFT price forecast →
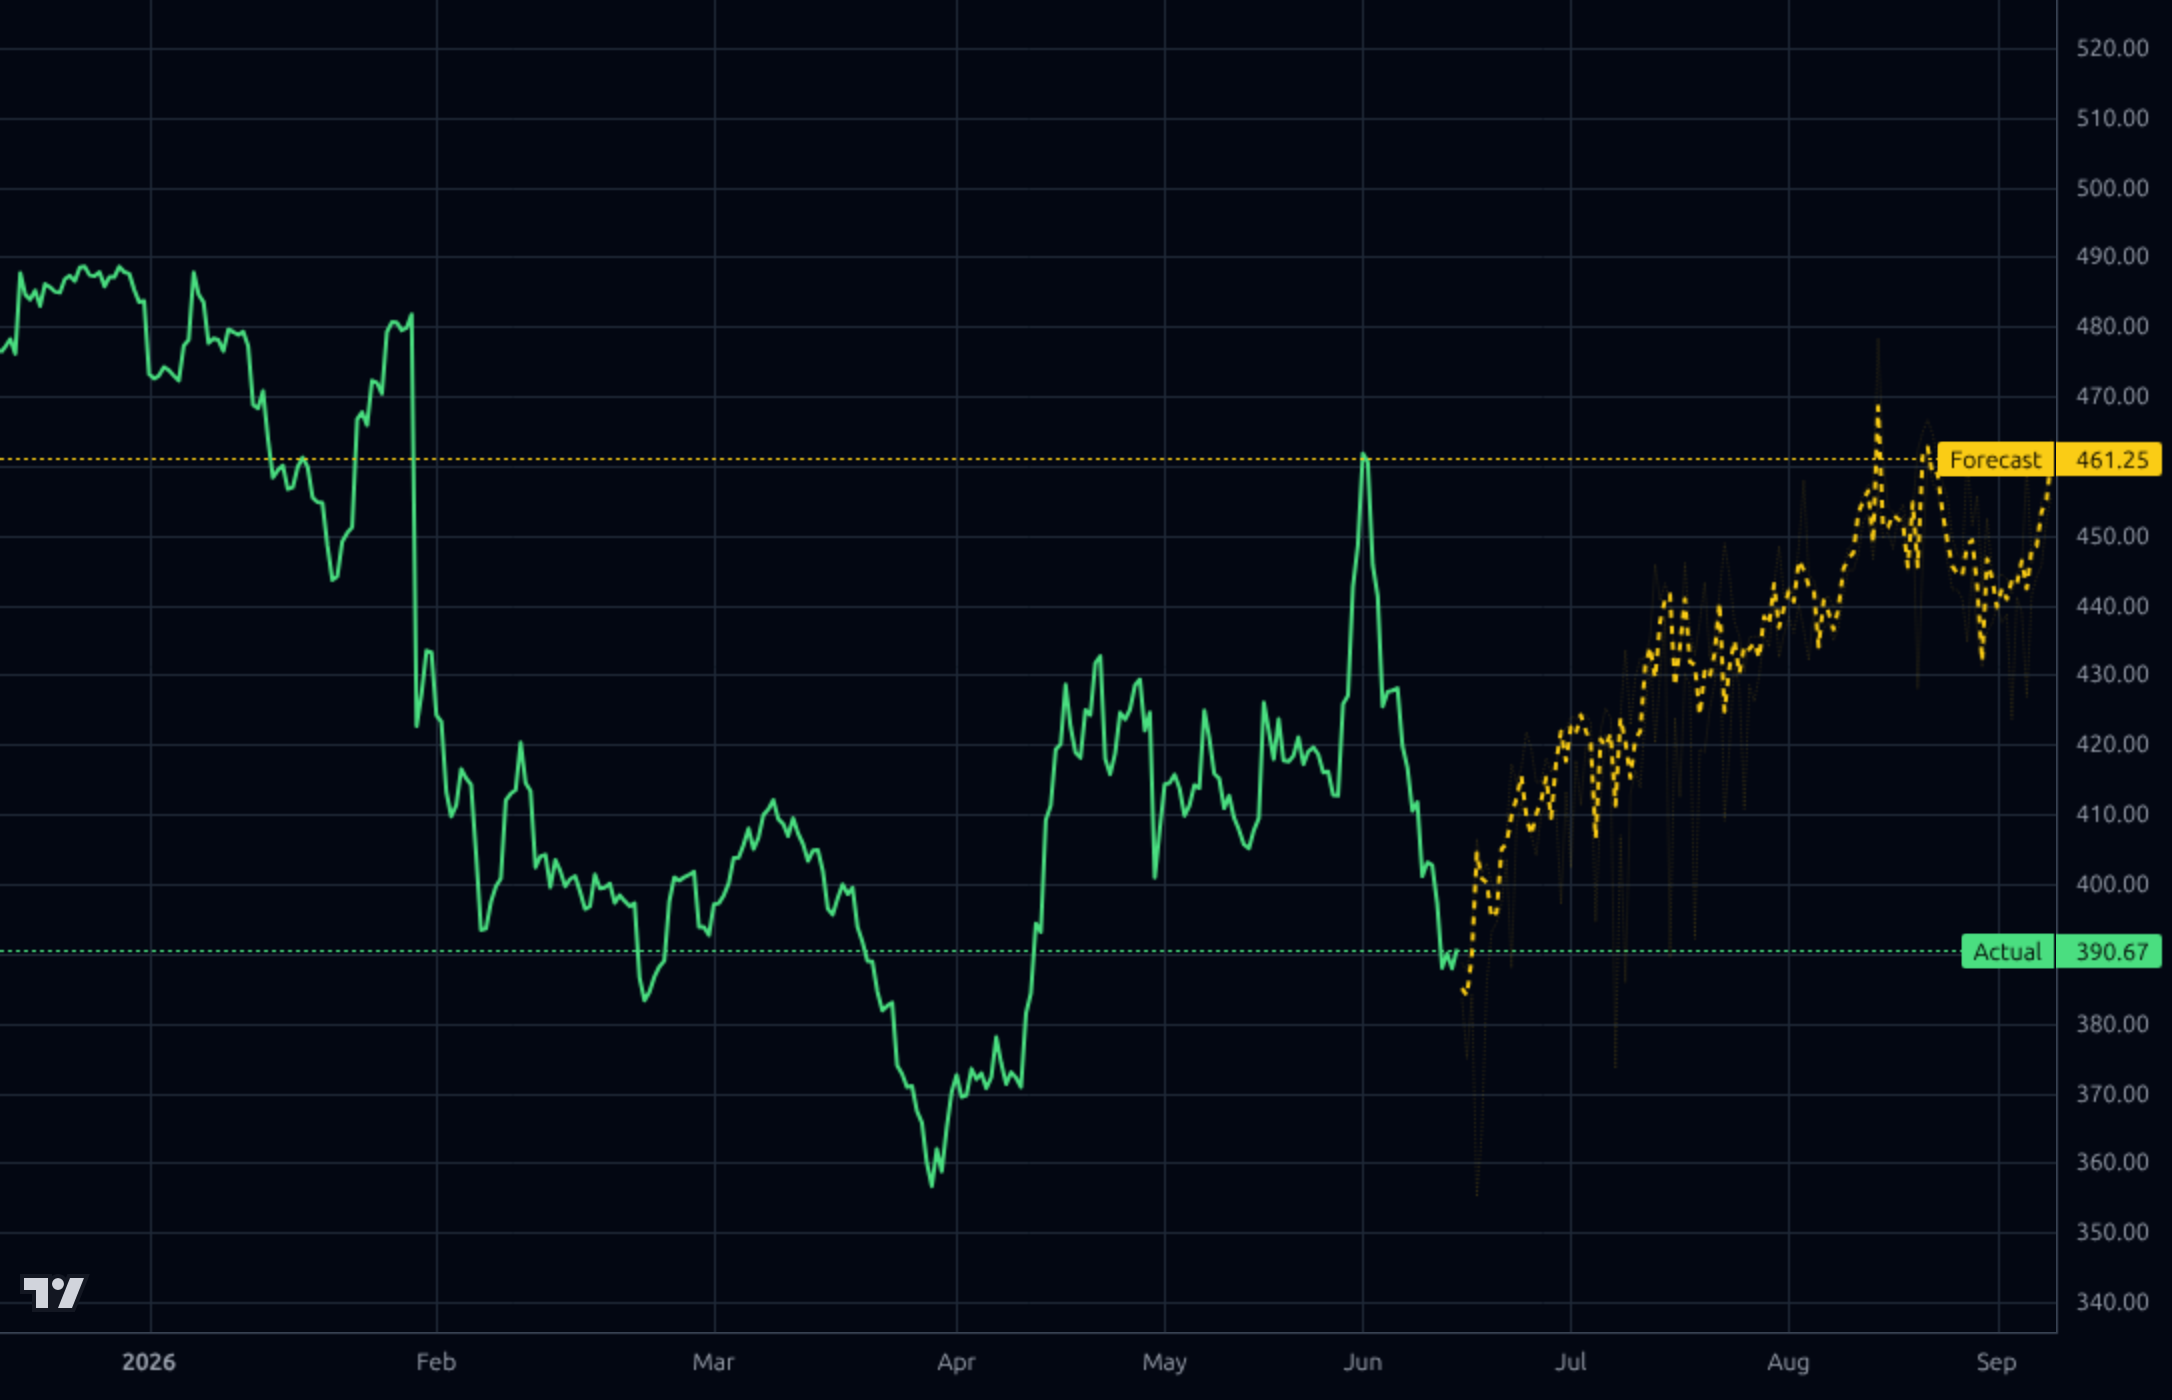
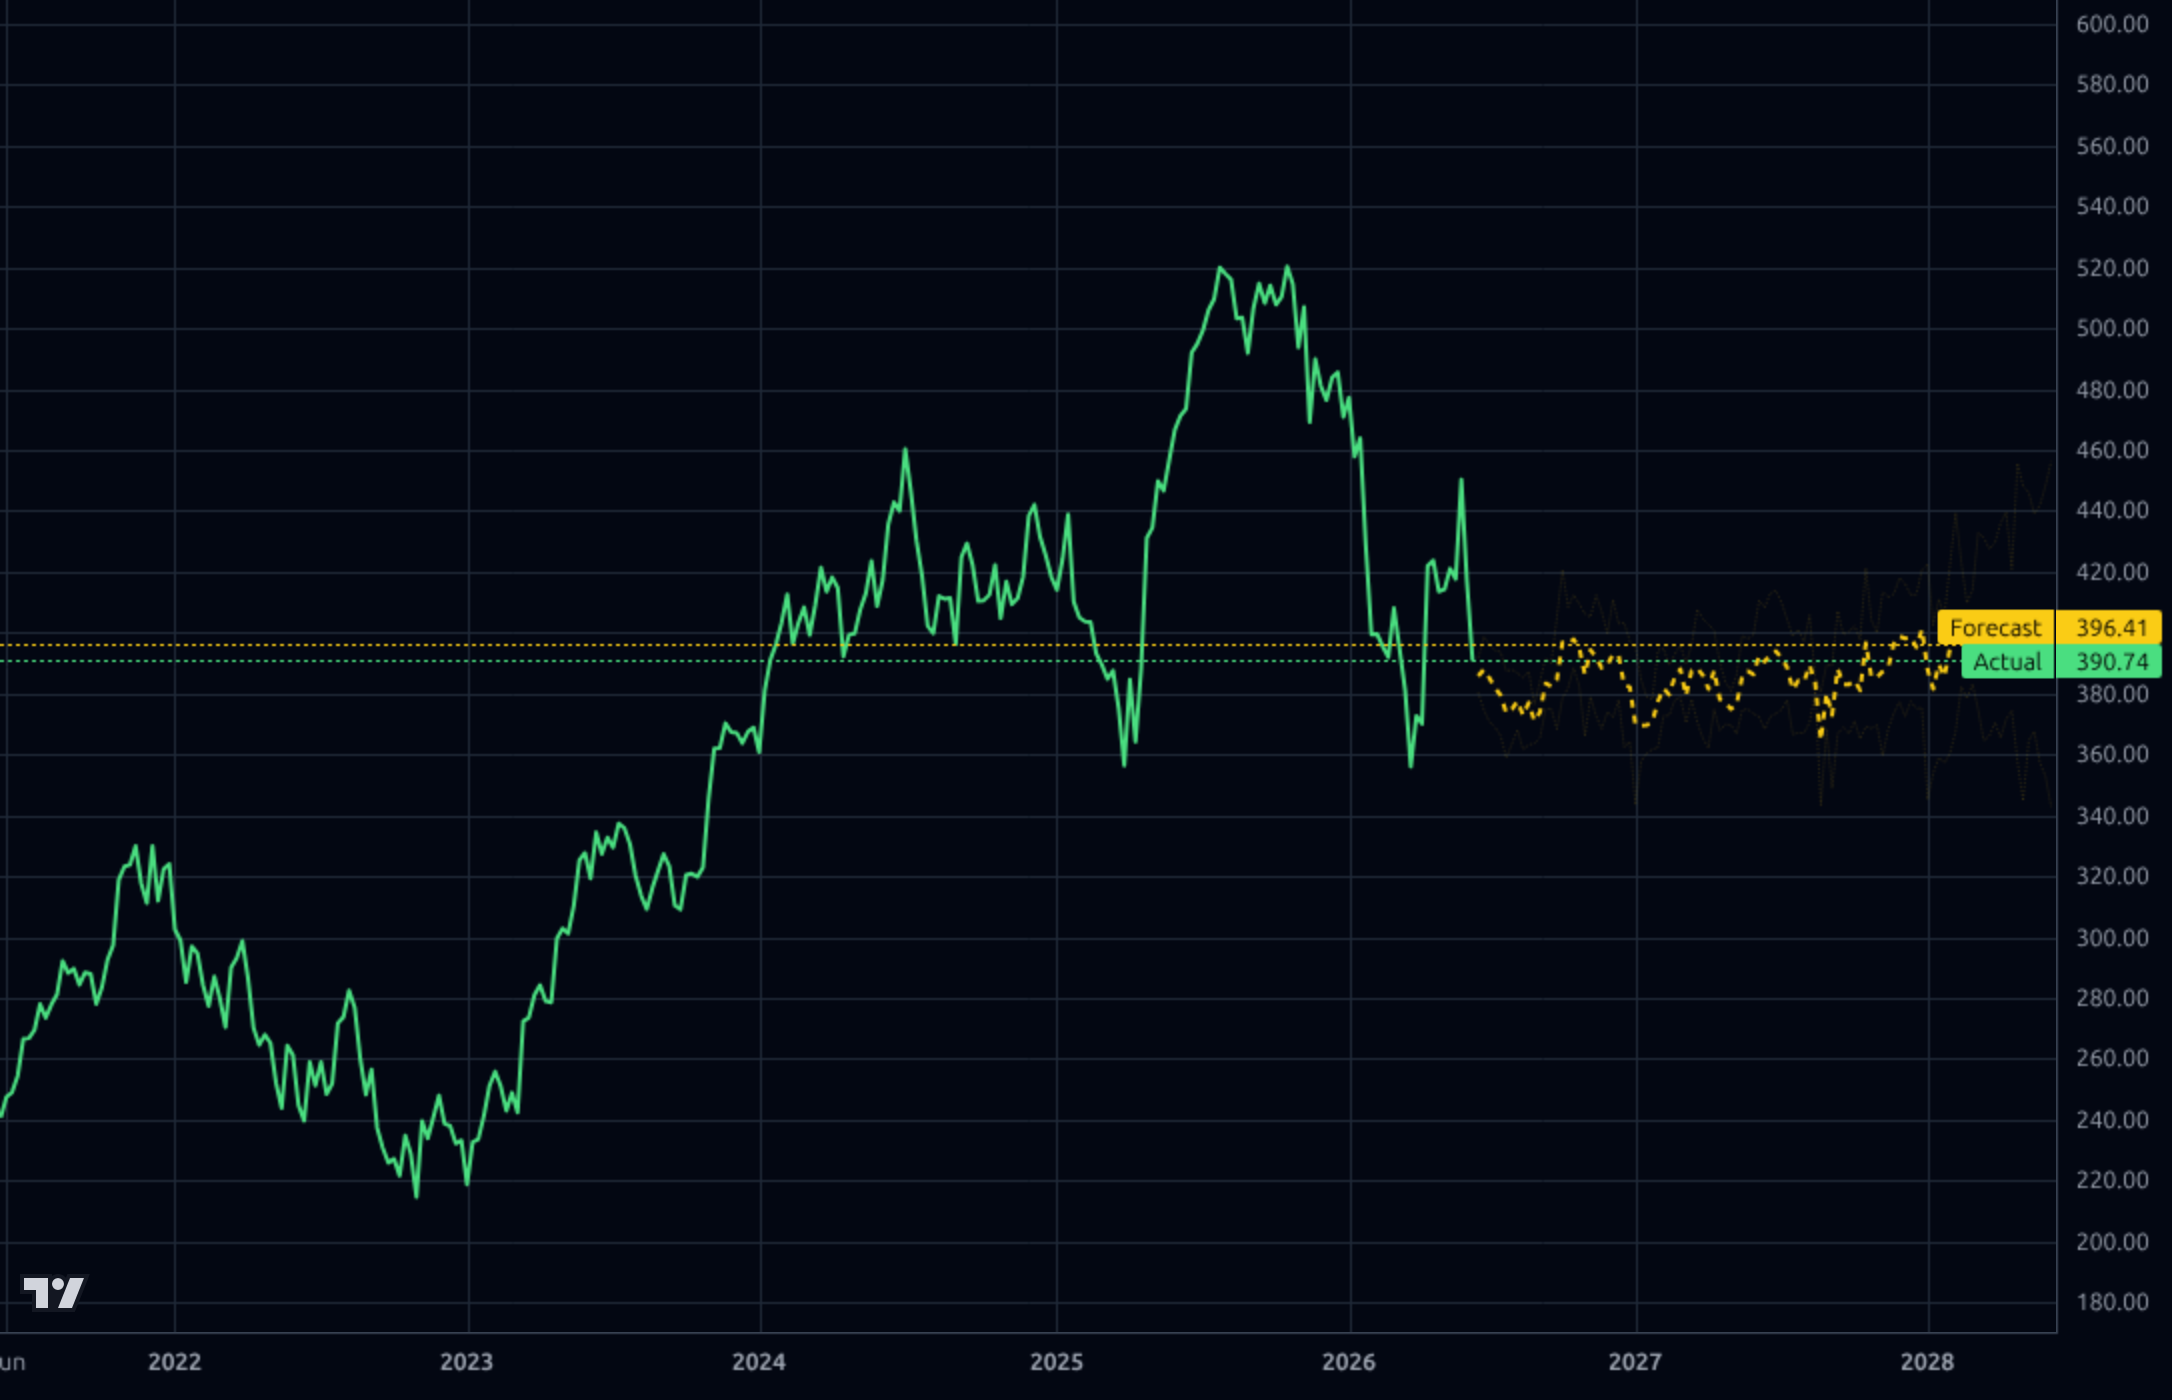
Microsoft trades at $390.74, down ~30% from its 52-week high of $555.45 and -19.2% YTD, with the stock pricing in cyclical AI capex concerns despite revenue growth of 17.9% and operating margins of 46.8%. The Kronos forecast bands suggest near-term weakness toward $378 on the 1h/4h but a constructive multi-month mean-reversion setup, while the long-term weekly forecast remains range-bound near current levels — consistent with a high-quality compounder in a valuation reset.
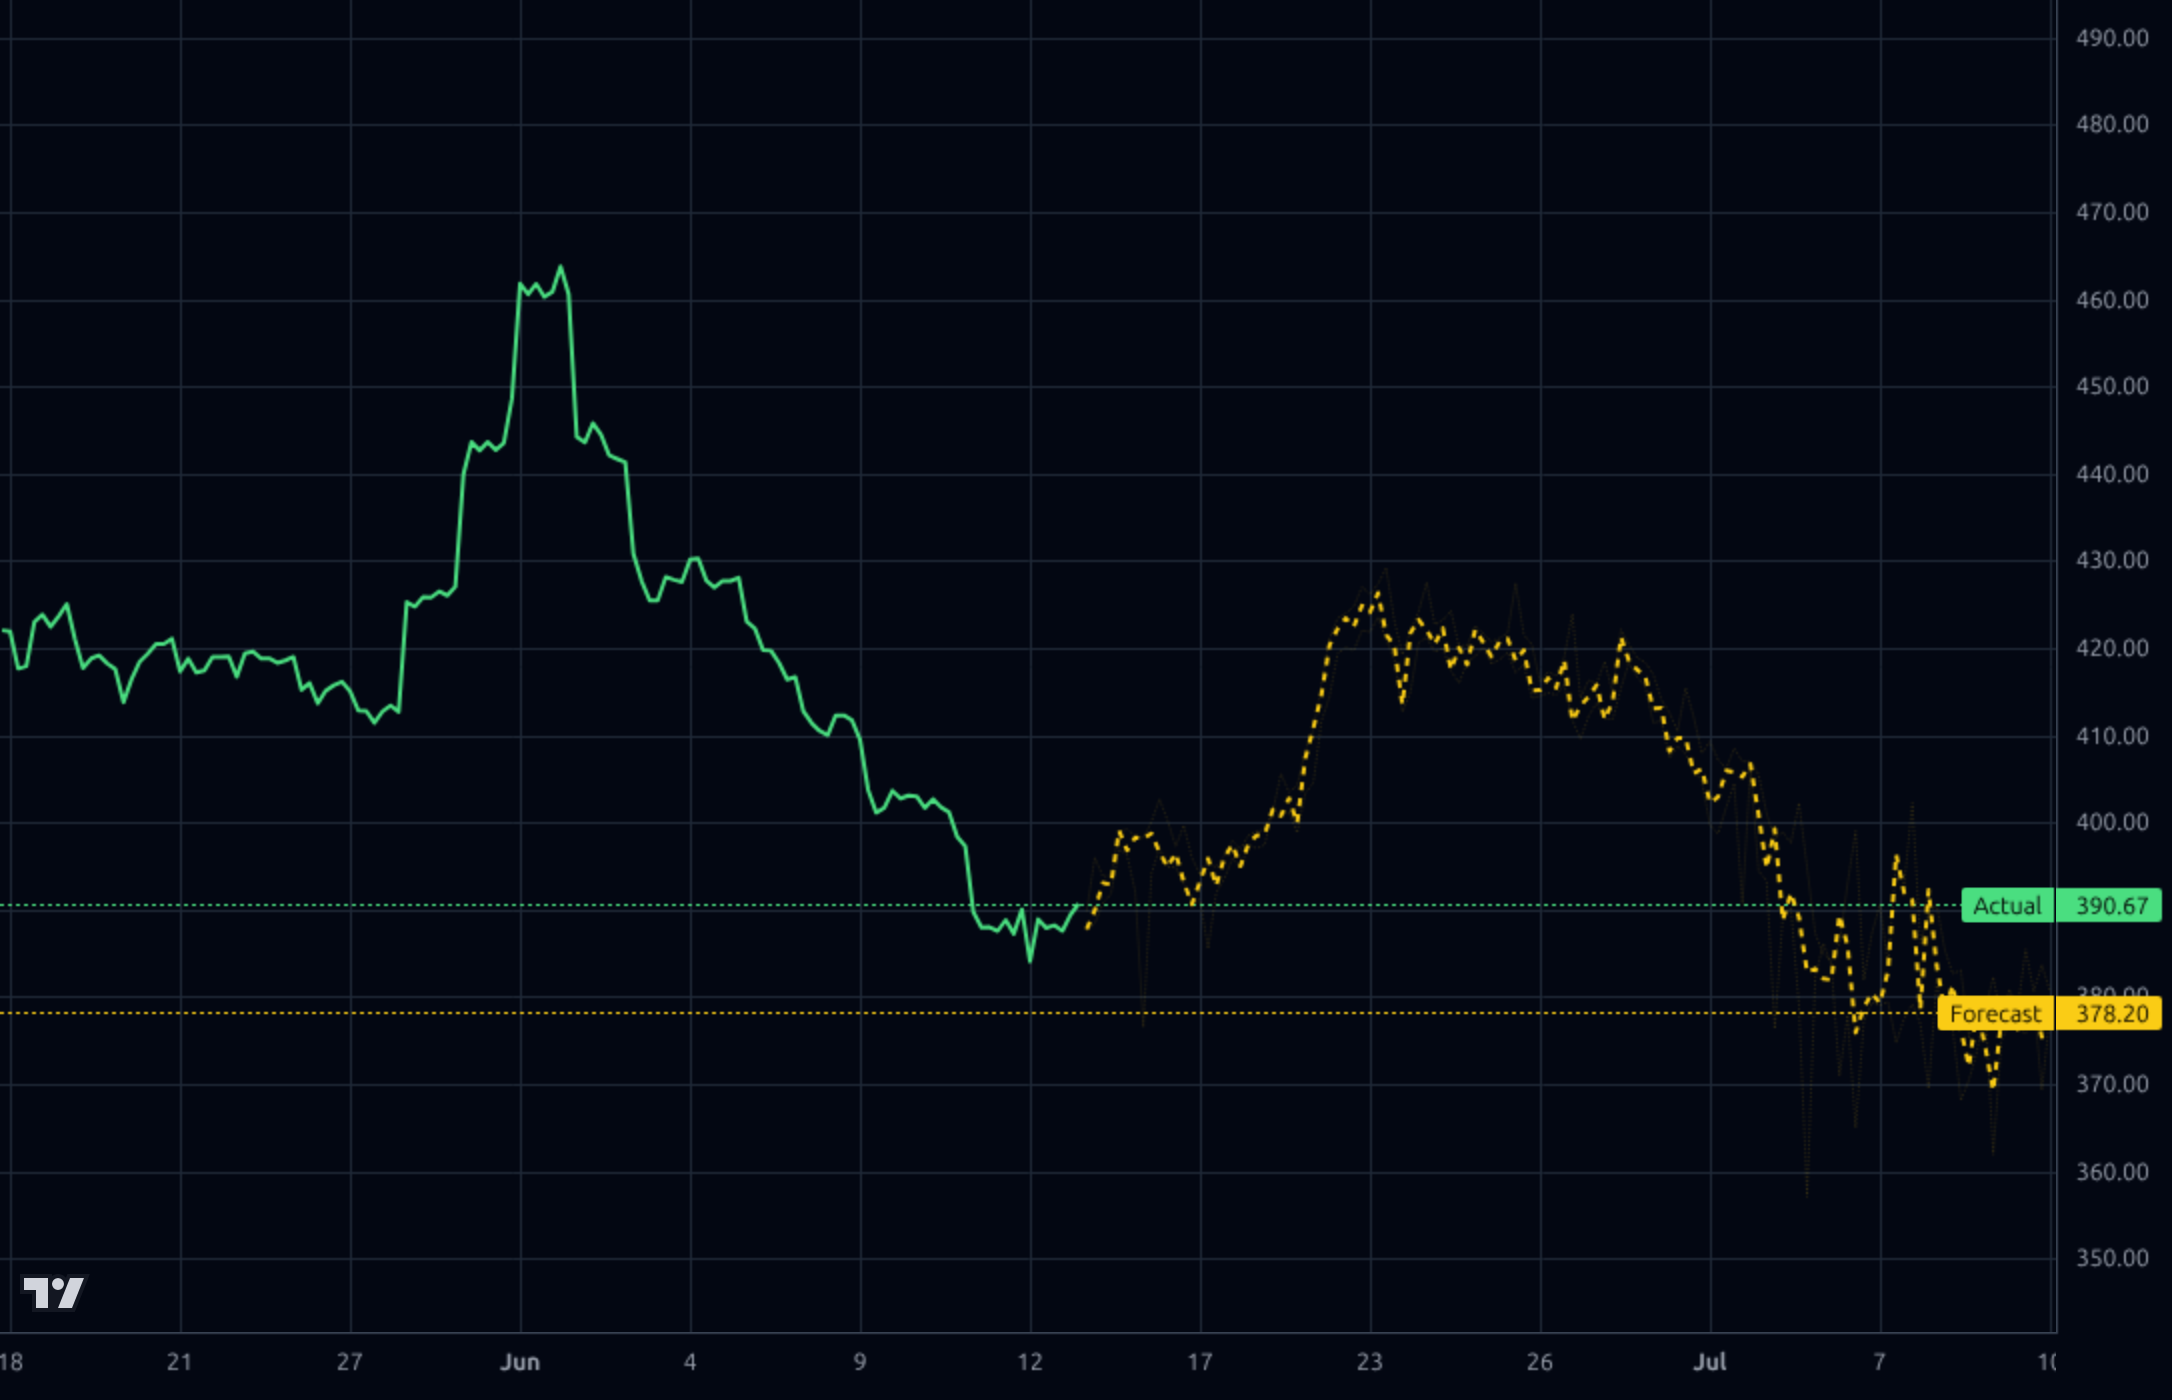
1-4 weeks: Stock is technically weak with the AI forecast pointing to $378 and RSI at 37 not yet washed out. Don't chase. Wait for either (a) a flush to $378-$380 support with positive divergence, or (b) reclaim of the $400 level with volume. Invalidation below $356 (52-week low) — that would signal a deeper macro/sector derate. Position sizing: starter only (1/3 of intended allocation).
1-6 months: The setup is constructive. Stock is -29.7% from 52w high with 17.9% revenue growth and 46% operating margins — that gap rarely persists in a high-quality name. Key catalysts: April 29 earnings, Azure growth disclosure, Xbox restructuring decision, and FCF trajectory as capex peaks. Expected return range: +8% to +25% (target $420-$490). What changes my mind: Azure growth deceleration below 25%, operating margin contraction, or capex guidance that pushes FCF further out.
1-3 years: MSFT remains the highest-quality AI/cloud platform with a near-monopoly on enterprise productivity (M365/Copilot), the #2 hyperscaler (Azure), and privileged access to OpenAI. Analyst target $559 (+43% upside) is credible if Copilot monetization scales. Multi-year drivers: AI workload migration to Azure, Copilot attach rates, gaming optionality post-restructuring. Biggest structural risk: AI capex cycle proves to have lower terminal ROI than expected, compressing the multiple permanently — semis/hyperscalers have lived through this pattern before (2000-2002).
Microsoft's fundamentals remain elite: TTM revenue of $318.3B grew 17.9% Y/Y, with the latest quarter (Mar-2026) showing $82.9B revenue, 67.6% gross margin, 46.3% operating margin and 38.3% net margin — among the best in mega-cap tech. ROE of 34.0% and ROIC of 24.0% confirm capital efficiency. However, capex is exploding: trailing four-quarter capex was ~$97B, and Q3-26 capex alone hit $30.9B, compressing free cash flow to $15.8B (down from $25.6B in Q4-25). Operating cash flow of $46.7B in Q3 is still robust, but FCF conversion is deteriorating as the company funds AI/cloud infrastructure (consistent with the IREN $3.65B GPU financing headline). Balance sheet is fortress-grade: $32B cash, $57B debt, $414B equity, debt/equity of 0.30, current ratio 1.28. EPS TTM $16.79, fwd P/E 20.1 and PEG 1.07 are reasonable for the quality, though no longer cheap on an absolute basis. Dividend yield 0.93% with 24% payout — plenty of room. The key tension: margins are still expanding while capital intensity is structurally rising.
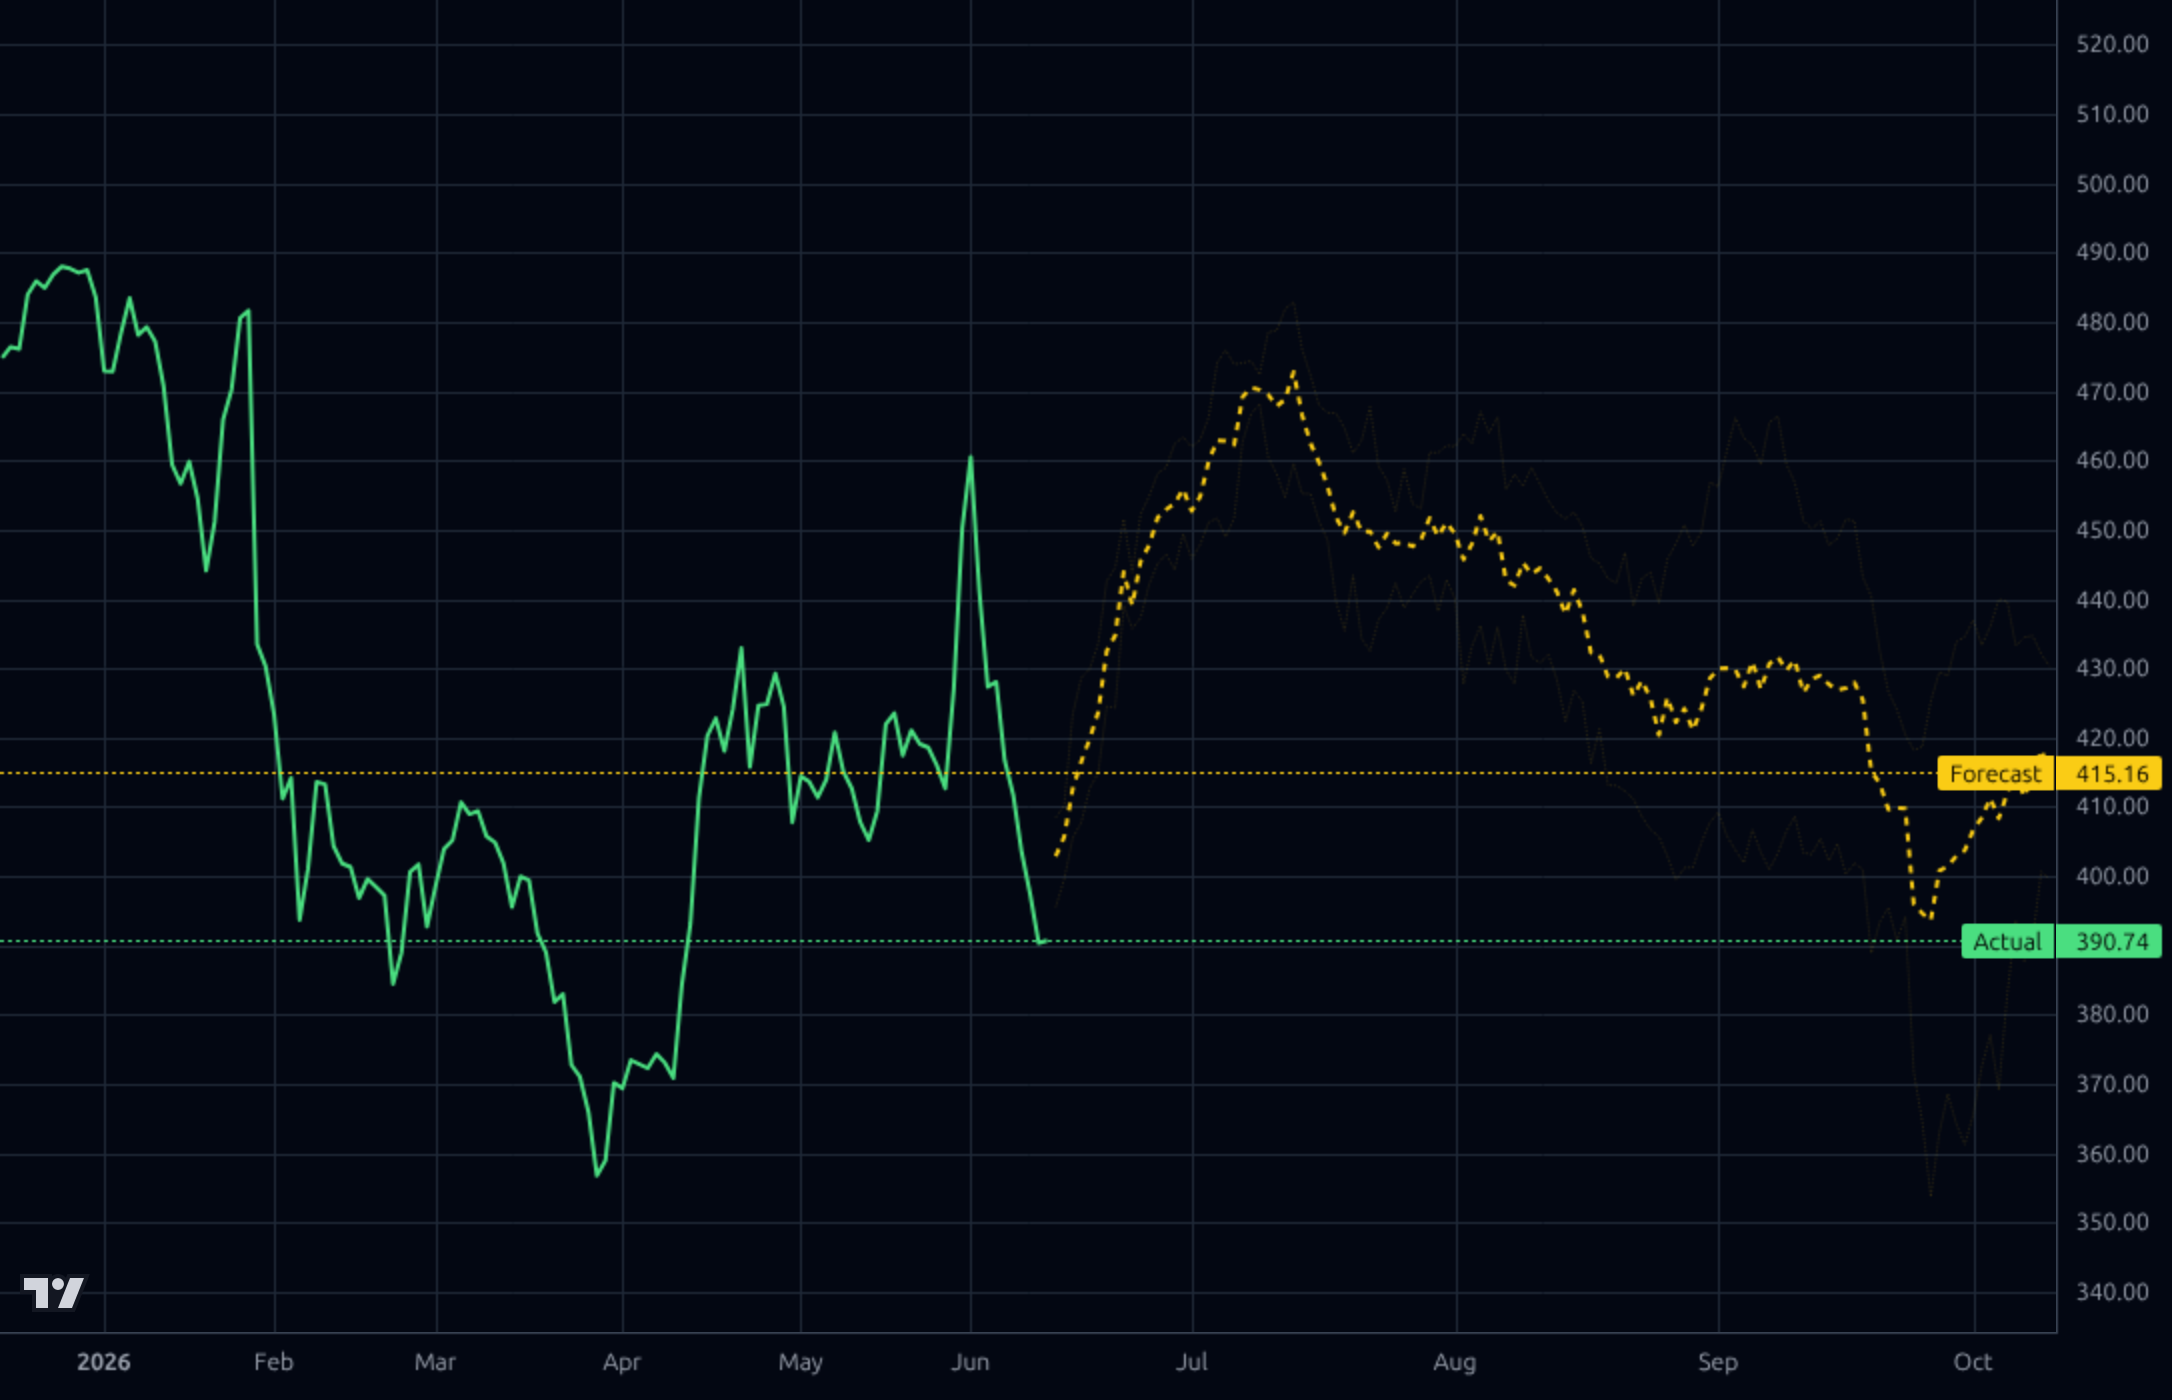
The technical setup is decisively broken in the intermediate term. On the 1h chart, price collapsed from ~$465 (early June) to ~$390, with Kronos forecasting continued drift to $378.20 — a bearish near-term skew. The 4h chart shows the stock sitting at the April-2026 lows (~$390 zone, which previously bottomed at $356), with the model projecting a recovery rally toward $461 over the coming months, implying mean reversion to the prior range mid-point. The daily chart shows price at $390.74 well below SMA20 (-6.9%), SMA50 (-5.1%) and SMA200 (-13.9%), with RSI at 37 (approaching oversold but not extreme). The weekly chart frames this as a deeper correction within a multi-year uptrend — the stock peaked near $520 in mid-2025 and has retraced to the 2024 breakout zone around $390, a critical structural support. Forecast bands on the weekly are wide and range-bound ($360-$420), reflecting model uncertainty. Model accuracy data is sobering: 30-day directional accuracy is only 44.8% on the daily, and degrades with horizon (0% at 11-14 day horizons), so the bullish forecast should be discounted. Key levels: support $378/$356, resistance $420/$461/$520.
Signal: (1) Microsoft is reportedly reviewing Xbox restructuring options — spin-off, JV, or subsidiary carve-out — which would unlock capital and refocus the story on Cloud/AI, a structural positive if executed. (2) The IREN $3.65B GPU financing facility tied to a Microsoft AI cloud contract confirms Azure AI demand is being aggressively scaled via third-party GPU capacity, validating the capex story but also flagging the magnitude of infrastructure spend required. (3) The Meta/Zuckerberg story about underwhelming AI results a year after the Alexandr Wang hire is indirectly positive for MSFT/OpenAI relative positioning. Noise: SpaceX IPO coverage, Google/Apple AI commentary, and the Truist note on Meta are peripheral. The Goldman Apple reset is contextual — it underscores that AI monetization is the dominant narrative across mega-cap tech, where MSFT remains the cleanest pure-play through Azure + Copilot + OpenAI partnership.
- Azure AI capacity expansion via $3.65B IREN GPU financing — confirms demand backlog requiring third-party infrastructure
- Potential Xbox spin-off/restructuring to unlock value and redirect capital to Cloud/AI segments
- M365 Copilot monetization at scale — embedded in Productivity segment driving 17.9% TTM revenue growth
- Strategic AI healthcare partnership with Mayo Clinic for frontier model development
- EPS growth of 23.3% Q/Q with forward EPS estimate of $19.35 (vs $16.79 TTM) implies continued operating leverage
- OpenAI partnership remains a competitive moat as Meta's in-house AI strategy underwhelms one year in
- Capex explosion: $30.9B in Q3 alone, FCF down to $15.8B from $25.6B a year earlier — sustained ROI on AI infra unproven
- Valuation reset risk: fwd P/E 20.1 still demands ~15%+ EPS growth; any Azure deceleration would compress the multiple
- Technical breakdown below $356 would confirm a deeper bear trend and likely target $320s (2024 breakout)
- Kronos model accuracy is mediocre (44.8% directional, 7.1% MAPE) — bullish 4h forecast to $461 should not be over-weighted
- Insider transactions -0.03% and institutional transactions -1.79% suggest distribution, not accumulation
- Stock is -18.4% over the past year vs broad tech — momentum/relative-strength is poor and could persist
- AI capex cycle risk: if hyperscaler buildout proves to over-shoot demand (as in 2000), margins and multiple both compress
Get AI analysis on any stock
This is one of hundreds of Kronos AI reports — scored fundamentals & technicals, bull/base/bear price targets, a multi-horizon plan, and continuously-updated forecasts across the market. Create a free account to explore them all.
Create your free account →Already a member? Sign in · Join our Discord