NCNO — AI Stock Forecast & Price Targets
Published 7/13/2026 · A free sample of K3vl4r’s AI-powered analysis.
Kronos price forecasts, scored fundamentals & technicals, and a multi-horizon plan.
View the live NCNO price forecast →
nCino is a beaten-down vertical banking SaaS name with early margin/FCF inflection (Q1 FY27 op margin 13.2%, FCF $80.8M) but decelerating ~11% revenue growth, a stretched balance sheet, and rising short interest (19.4%) heading into an Aug 25 binary earnings print. At $16.99 — down 34% YTD but reclaiming the 20/50-day — the risk/reward is a range trade between $15 support and the $20 200-day resistance, not a durable compounder setup. Forecast model has underperformed naive baseline on this ticker, so the bullish 1d/1wk signals are heavily discounted.
HOLD/small tactical long only. Stock reclaimed 20/50-day on the DNB news but the model forecast is unreliable here and 200-day resistance at ~$20.30 is the ceiling. Entry-only zone: $16.00-16.50 with stop below $15.00 (the July 10 flash-low structure). First target $18.50 (recent range high), stretch $20 into but NOT through the Aug 25 print. Do NOT hold size into earnings — 43 days out is a binary event with high IV; trim any tactical position by Aug 20. Invalidation: loss of $15 on volume flips this back to range-low retest at $14.
HOLD. The Aug 25 print is the decisive catalyst — need to see (1) subscription revenue growth holding ≥12%, (2) operating margin sustaining >10% (not reverting), and (3) Q2 FCF showing the Q1 step-up wasn't purely seasonal billing. If all three print, path to $22-23 (fair value zone) opens. If any miss, retest of $14-15 is likely and 19.4% short interest suggests bears are positioned for that outcome. Expected return range: -18% to +30% over 6 months with a wide, bimodal distribution centered near current levels. What would change my mind: two consecutive quarters of sub growth re-acceleration above 13% plus FCF confirmation would upgrade to ACCUMULATE.
Structurally cautious. NCNO is a legitimate vertical SaaS incumbent with sticky bank customers, but the 5-year -74% chart is telling you the market has re-rated the moat downward as (a) growth decelerated from 30%+ to 11% and (b) AI/native tooling threatens the document-workflow layer that anchors the platform. Multi-year drivers are international expansion (DNB-type wins) and margin normalization toward mid-teens ops, which could support a $25-30 stock if executed. Biggest structural risk: banks — especially large enterprise clients — building or buying native AI-driven origination tools, compressing NCNO's role to a commoditized system-of-record and capping ARR growth in the high single digits.
Revenue growth has decelerated to +10.6% Y/Y with Q1 FY27 revenue of $159.4M and subscription revenue +12% — respectable but no longer a premium-multiple story. The real narrative is margin/FCF inflection: operating margin swung from -6.2% (Jul-25) to +13.2% (Apr-26), and quarterly FCF jumped to $80.8M from $12.5M the prior quarter, driving TTM FCF near $139M (P/FCF ~14x). However, that Q1 FCF concentration screams billing seasonality and won't repeat linearly; Q2-Q4 will reveal whether the inflection is structural. Balance sheet is thin — $103M cash vs $327M debt, current ratio 0.89, negative working capital of $32M — leaving no cushion. Trailing P/E of 141x on 2.2% net margin is only defensible via the forward EPS bridge to $1.49 (fwd P/E ~11x, PEG 0.68); if that consensus proves aspirational, the multiple collapses the other way. CEO sold $141k on July 6 — small, but no offsetting insider buys.
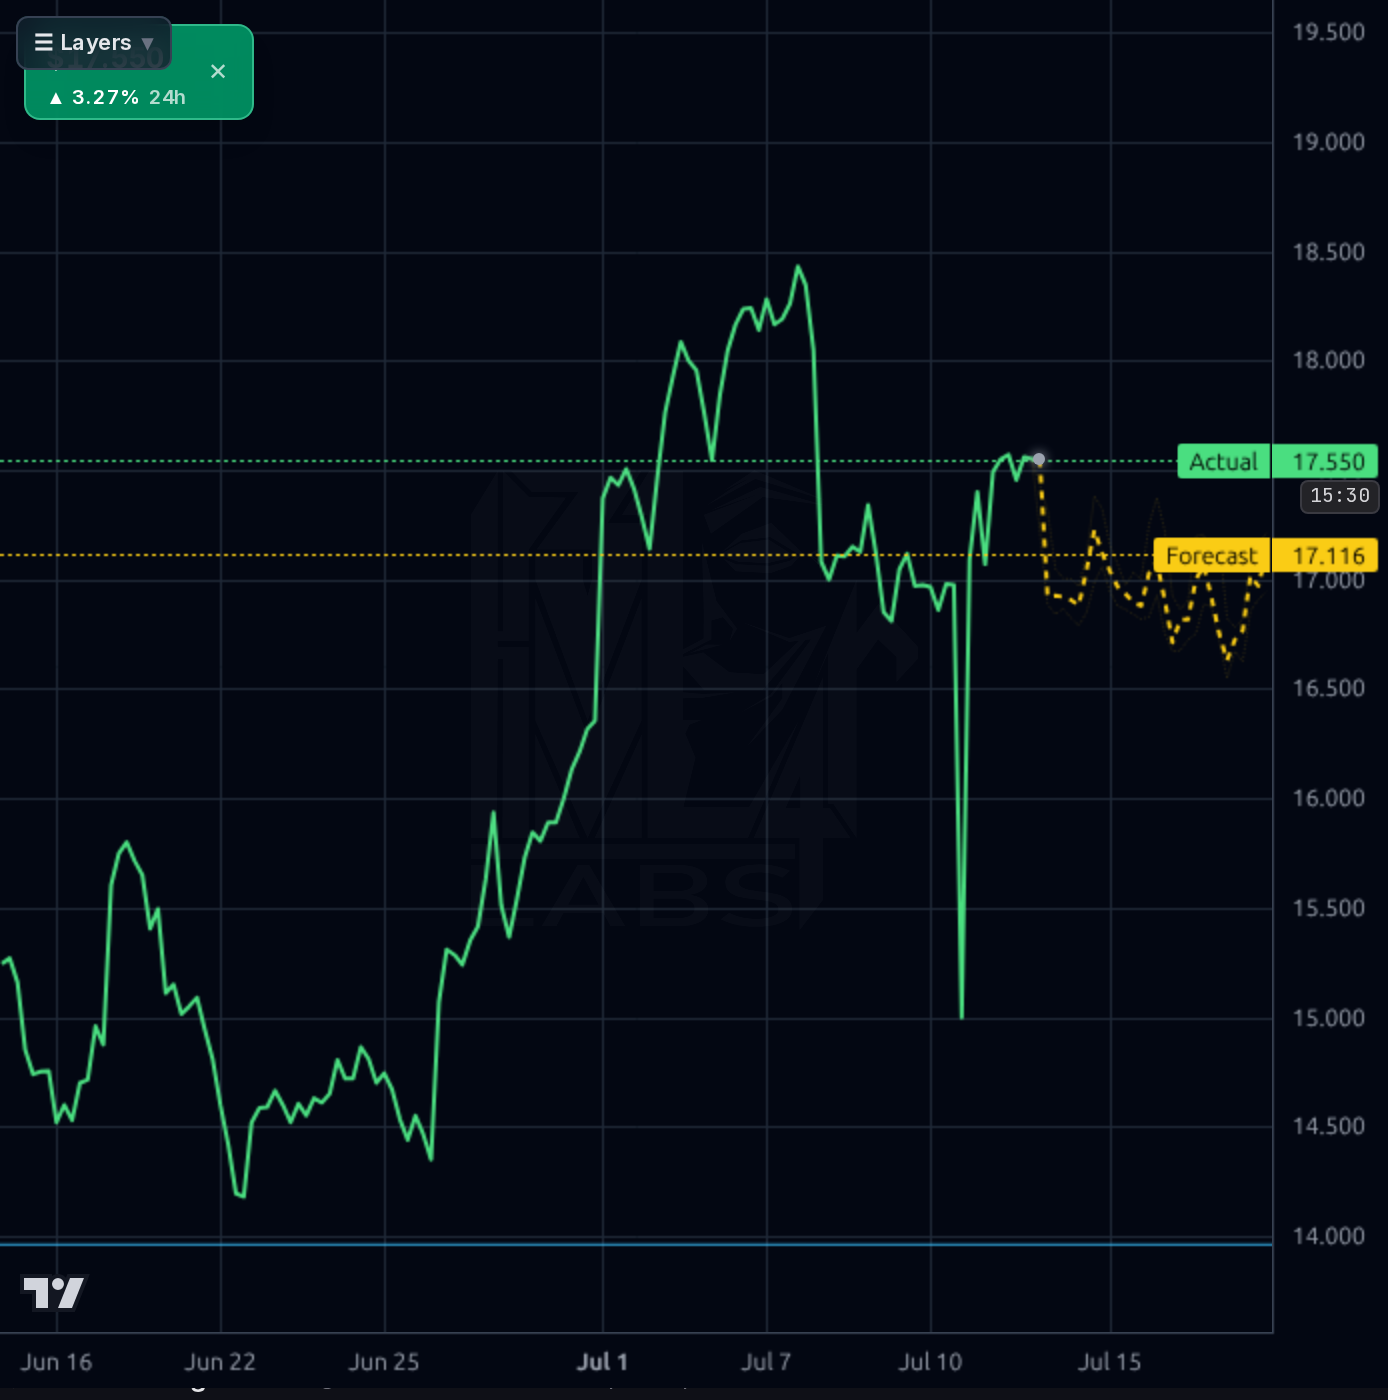
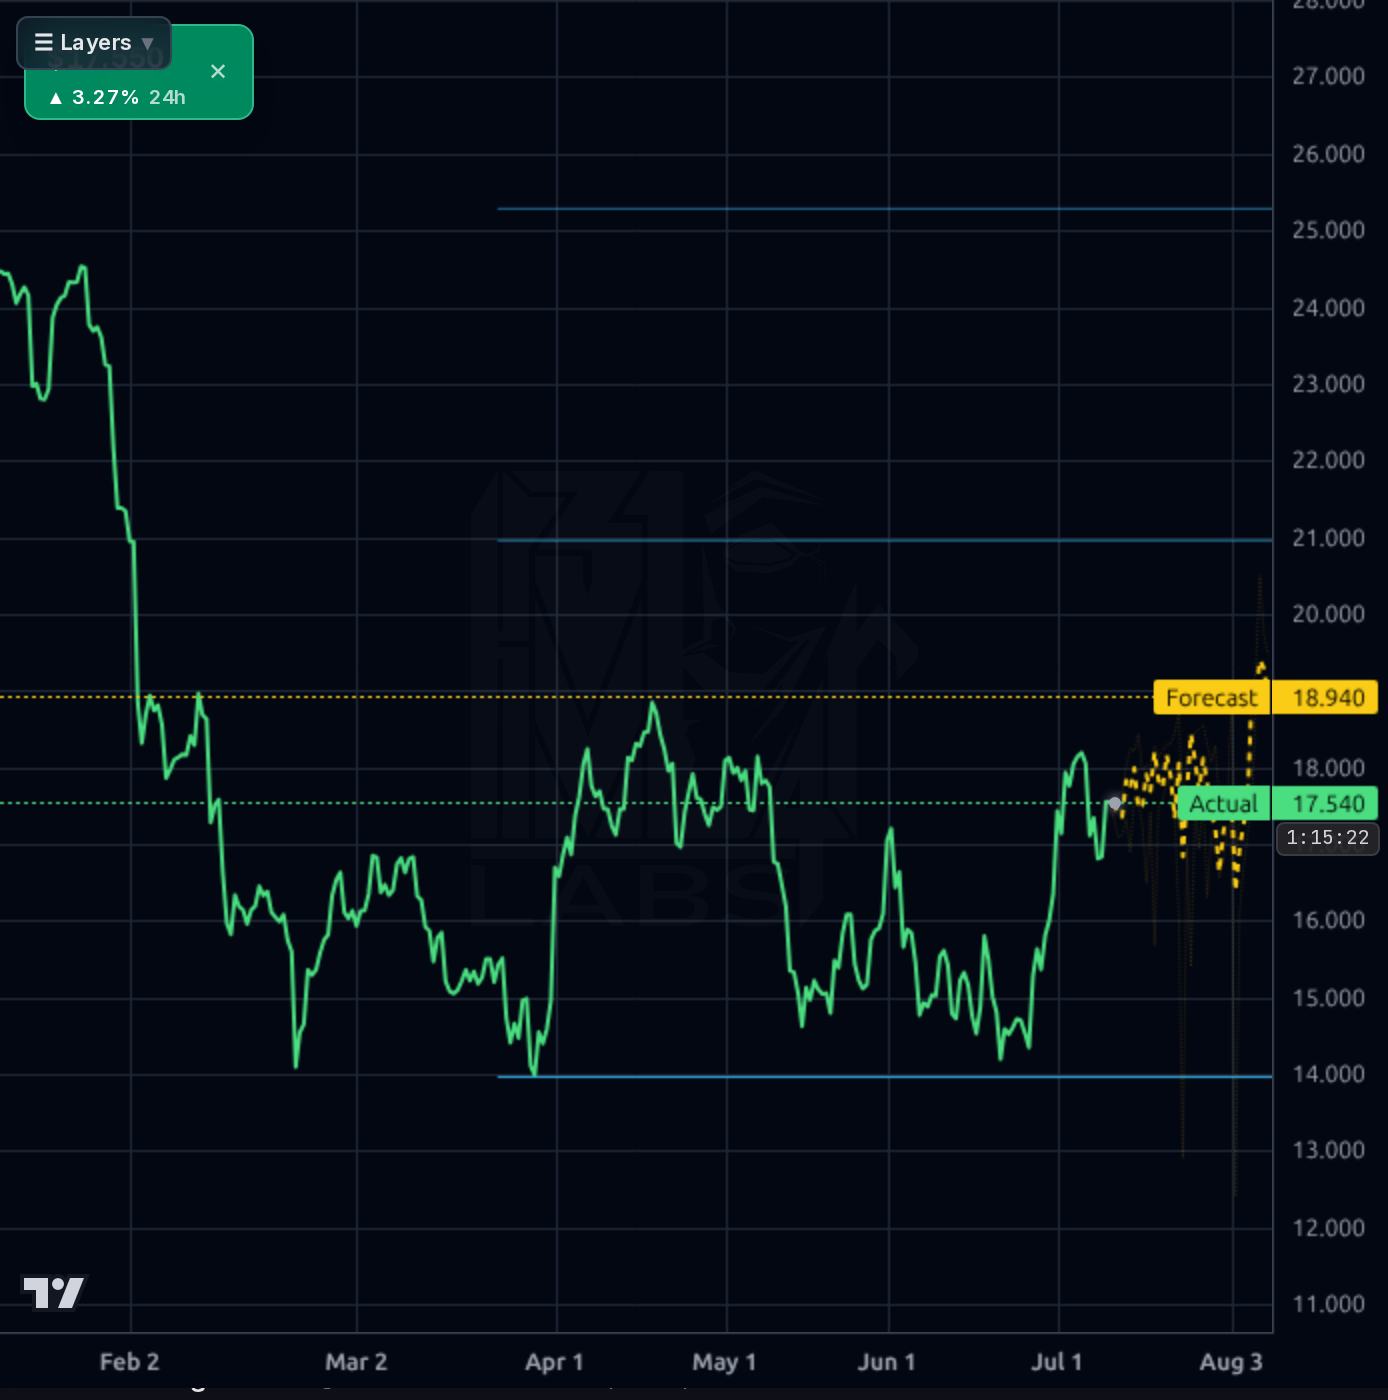
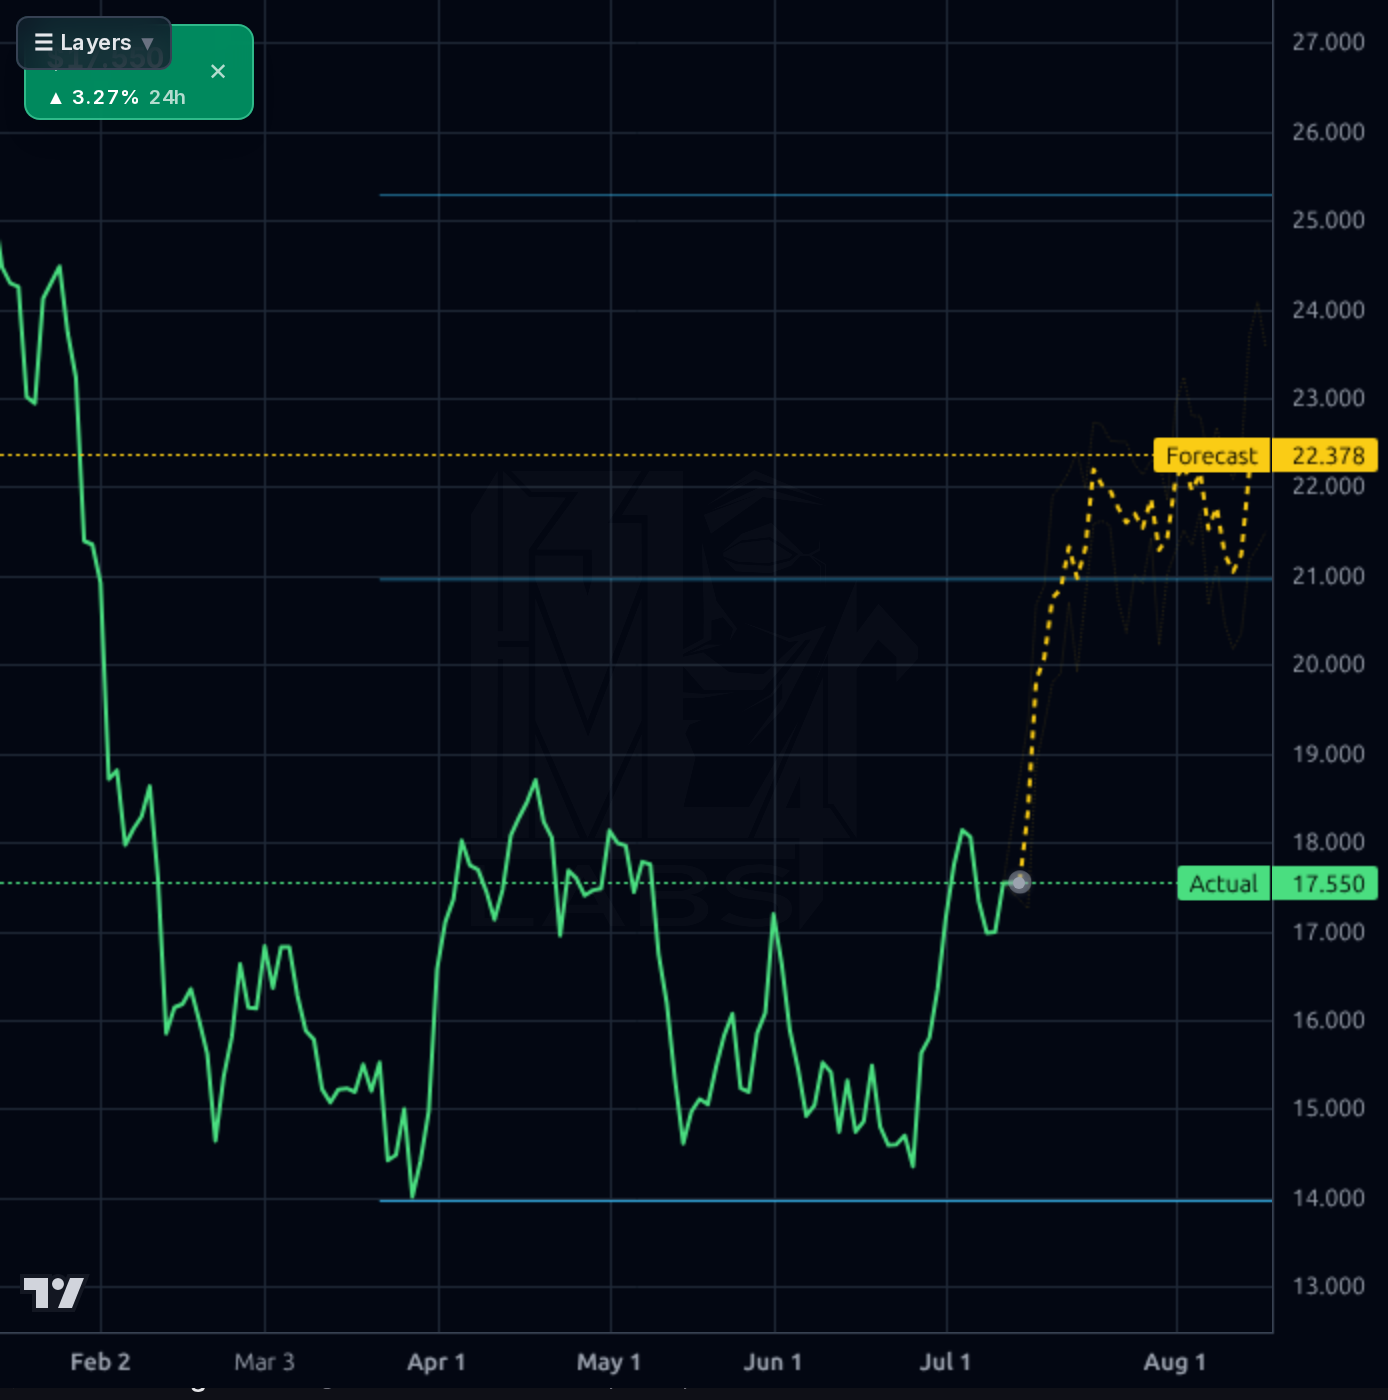
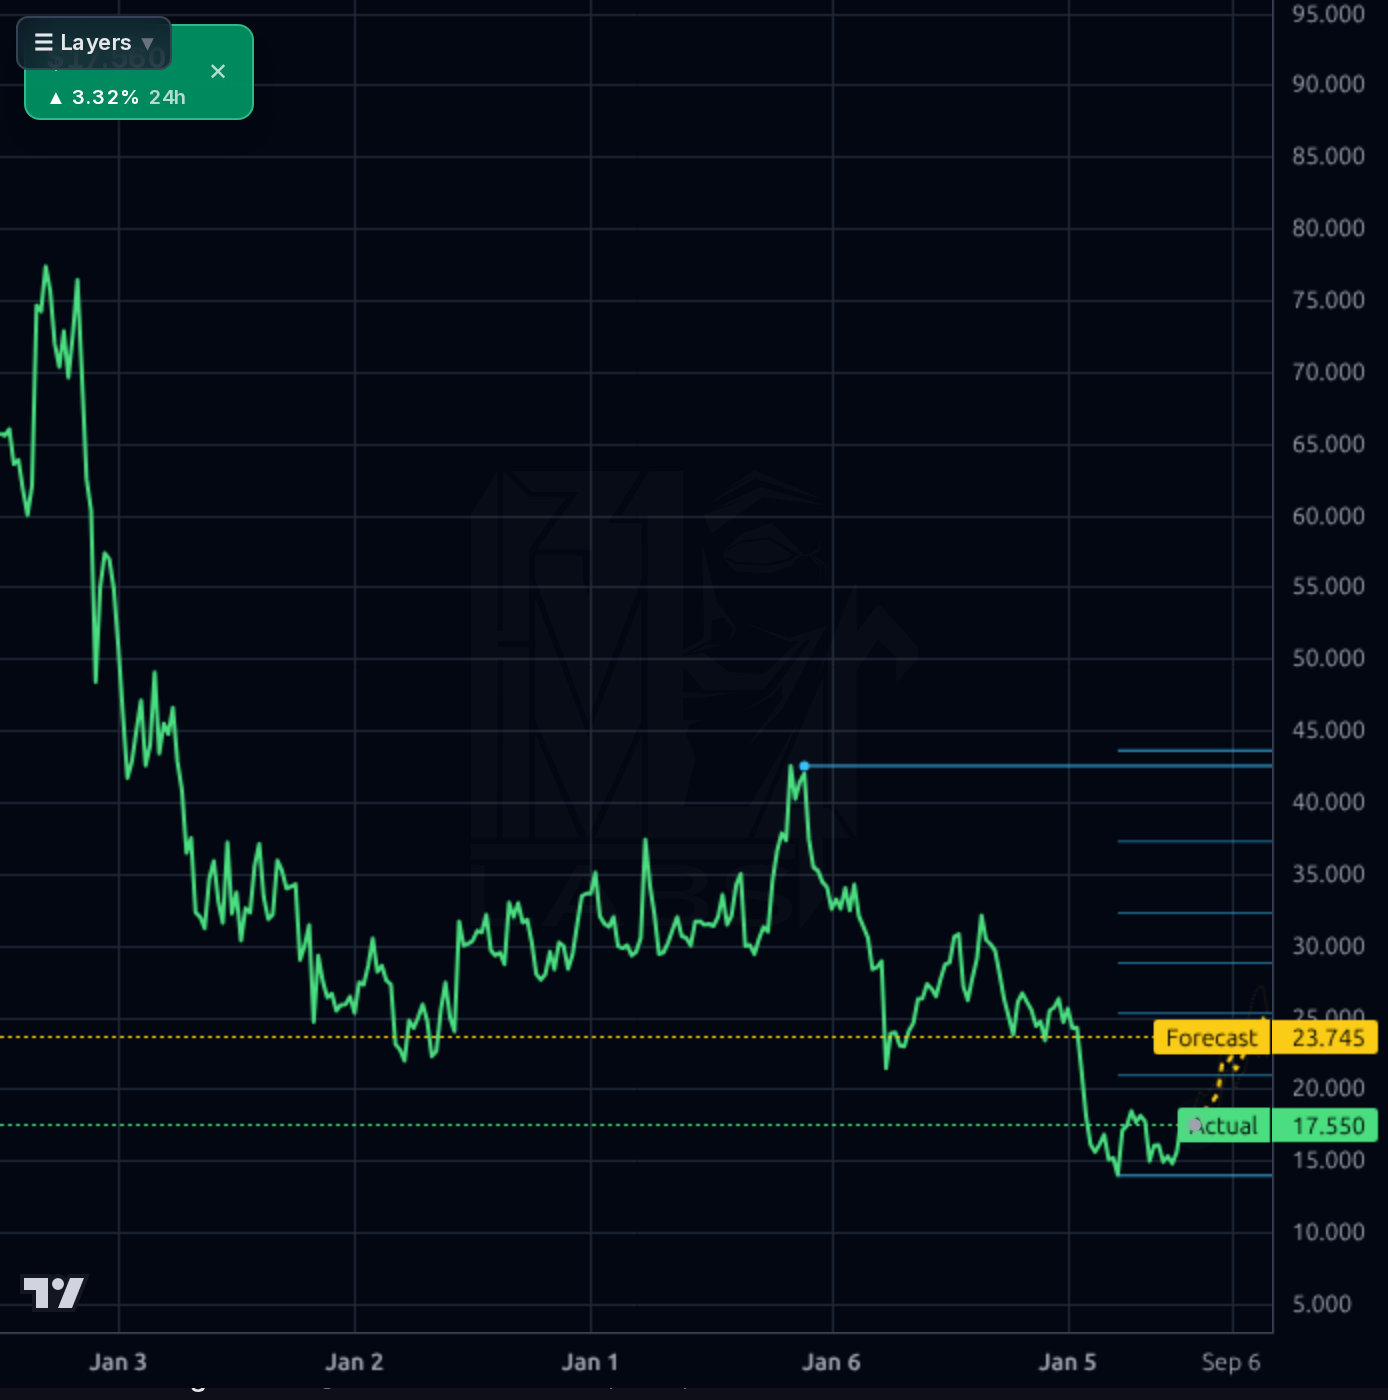
The 1d chart shows a V-recovery off the July 10 flash low near $15.00 back to $17.55, but the forecast band projects sideways-to-lower drift into $16.7-17.0 over the next several sessions. The 4h chart confirms consolidation in a $16.50-18.50 range since early July with the model projecting a wide, choppy band tilted mildly up to ~$18.94 by early August. The 1d longer-view chart shows a broader trading range of $14.20-$18.50 since April, with the stock now mid-range and the model bullishly extrapolating to $22.38 — a target that must clear the 200-day near $20.30, which has repeatedly capped rallies. The weekly chart is the sobering one: a multi-year downtrend from $75+ to a $13.80 52-week low, currently -49.9% off the 52W high and -33.7% YTD; price is +6.7% above SMA20 and +5.6% above SMA50 but still -16.7% below SMA200. RSI 56 is neutral. The model's own realized directional accuracy (50-65%) is BELOW the naive baseline (67-79%) at both 1d and 1wk, so its bullish signals here are unreliable and should be discounted.
The primary signal is dual customer go-lives — DNB (Norway's largest bank) on corporate lending and Cornerstone First Mortgage on point-of-sale — validating international/enterprise TAM and driving a +7.3% single-day pop on July 1. JP Morgan raised its PT from $16 to $17 on June 22 (still Neutral), consistent with sell-side skepticism despite the Q1 beat. Two Simply Wall St pieces from July 12 explicitly debate whether NCNO looks 'expensive' or 'cheap' — reflecting genuine analyst disagreement rather than consensus. The noise-vs-signal call: the DNB/Cornerstone wins are real fundamental data (proof of enterprise stickiness), while the sell-side price target lift is marginal and the valuation debate pieces are commentary. The June 13 note flagging AI execution risk to workflow SaaS is the most important secular framing — banks building native origination tools is the long-term moat risk. No 8-K catalysts beyond the June 22 annual meeting filing (Items 5.03/5.07 are routine governance).
- DNB (Norway's largest financial institution) live on corporate lending — proves European enterprise TAM and creates flagship reference for other Tier-1 EU banks
- Cornerstone First Mortgage go-live extends mortgage point-of-sale wedge into US independent mortgage bank vertical
- AI product roadmap positioned as the re-rating catalyst — but same trend is also the biggest risk if execution lags
- Forward EPS consensus of $1.49 vs TTM $0.12 implies management is guiding sell-side to a genuine profitability step-change in FY27
- Q1 FY27 operating margin of 13.2% (up from -6.2% two quarters prior) suggests operating leverage from prior R&D/S&M investment cycle is finally arriving
- Trailing P/E of 141x on 2.2% net margin gives zero cushion for an Aug 25 earnings miss
- Short float has climbed from 16.4% to 19.4% in 45 days — bearish conviction is accumulating, not dispersing
- Balance sheet stress: $103M cash vs $327M debt, current ratio 0.89, negative working capital of $32M limits M&A/buyback optionality
- Q1 FCF of $80.8M vs $12-13M in prior quarters looks like billing seasonality — durability unproven and 2 more quarters needed to confirm structural step
- AI-native competitors could disrupt document/workflow moat as banks build in-house origination tools
- Revenue growth has decelerated to ~11% — removes premium SaaS multiple justification unless margins fully carry the story
- Forecast model has underperformed the naive baseline on this ticker at both 1d and 1wk — its bullish signal here is not evidence
- CEO open-market sale of $141k on July 6 — small but no offsetting insider buys during this rally
- 5-year chart down -74% is not a base-building pattern; it's a persistent de-rating
Get AI analysis on any stock
This is one of hundreds of Kronos AI reports — scored fundamentals & technicals, bull/base/bear price targets, a multi-horizon plan, and continuously-updated forecasts across the market. Create a free account to explore them all.
Create your free account →Already a member? Sign in · Join our Discord