OCSL — AI Stock Forecast & Price Targets
Published 8/23/2026 · A free sample of K3vl4r’s AI-powered analysis.
Kronos price forecasts, scored fundamentals & technicals, and a multi-horizon plan.
View the live OCSL price forecast →
OCSL faces structural challenges including declining revenue and high debt levels, but recent price consolidation near $12.44 suggests short-term stability. Valuation metrics indicate potential upside to fair value, though earnings volatility and short interest create uncertainty.
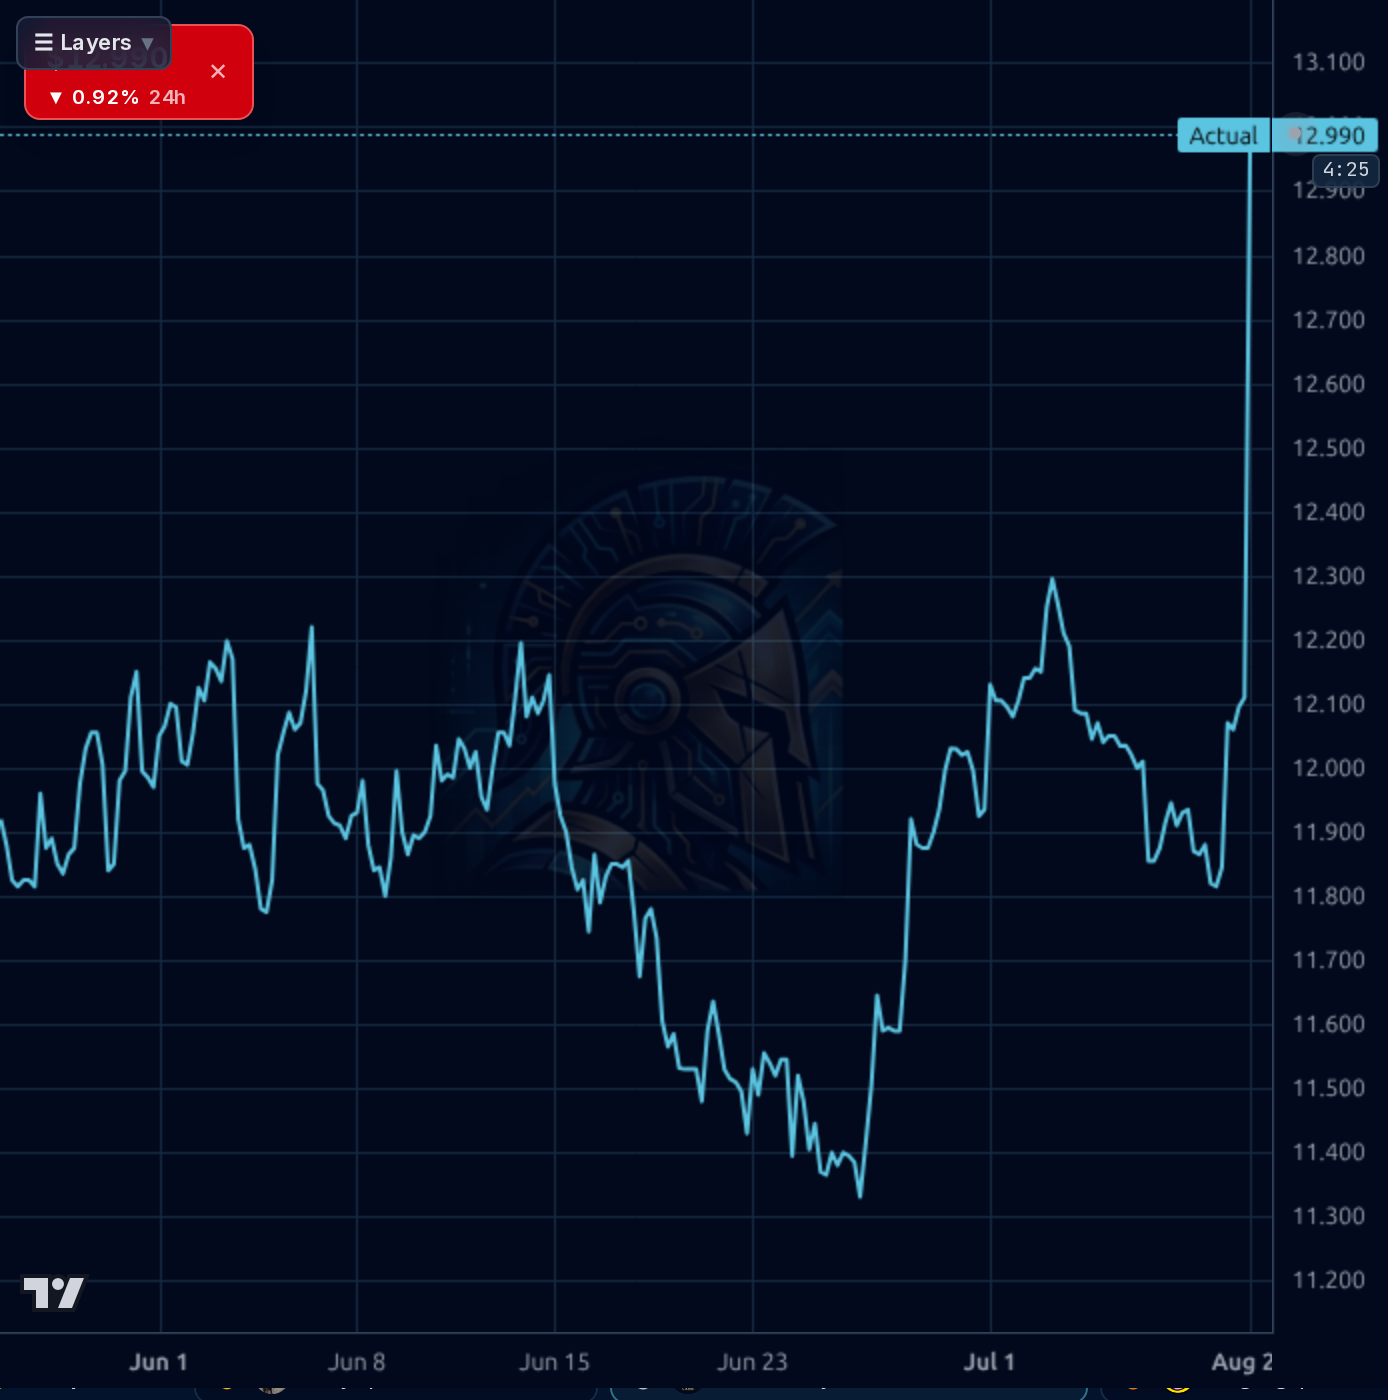
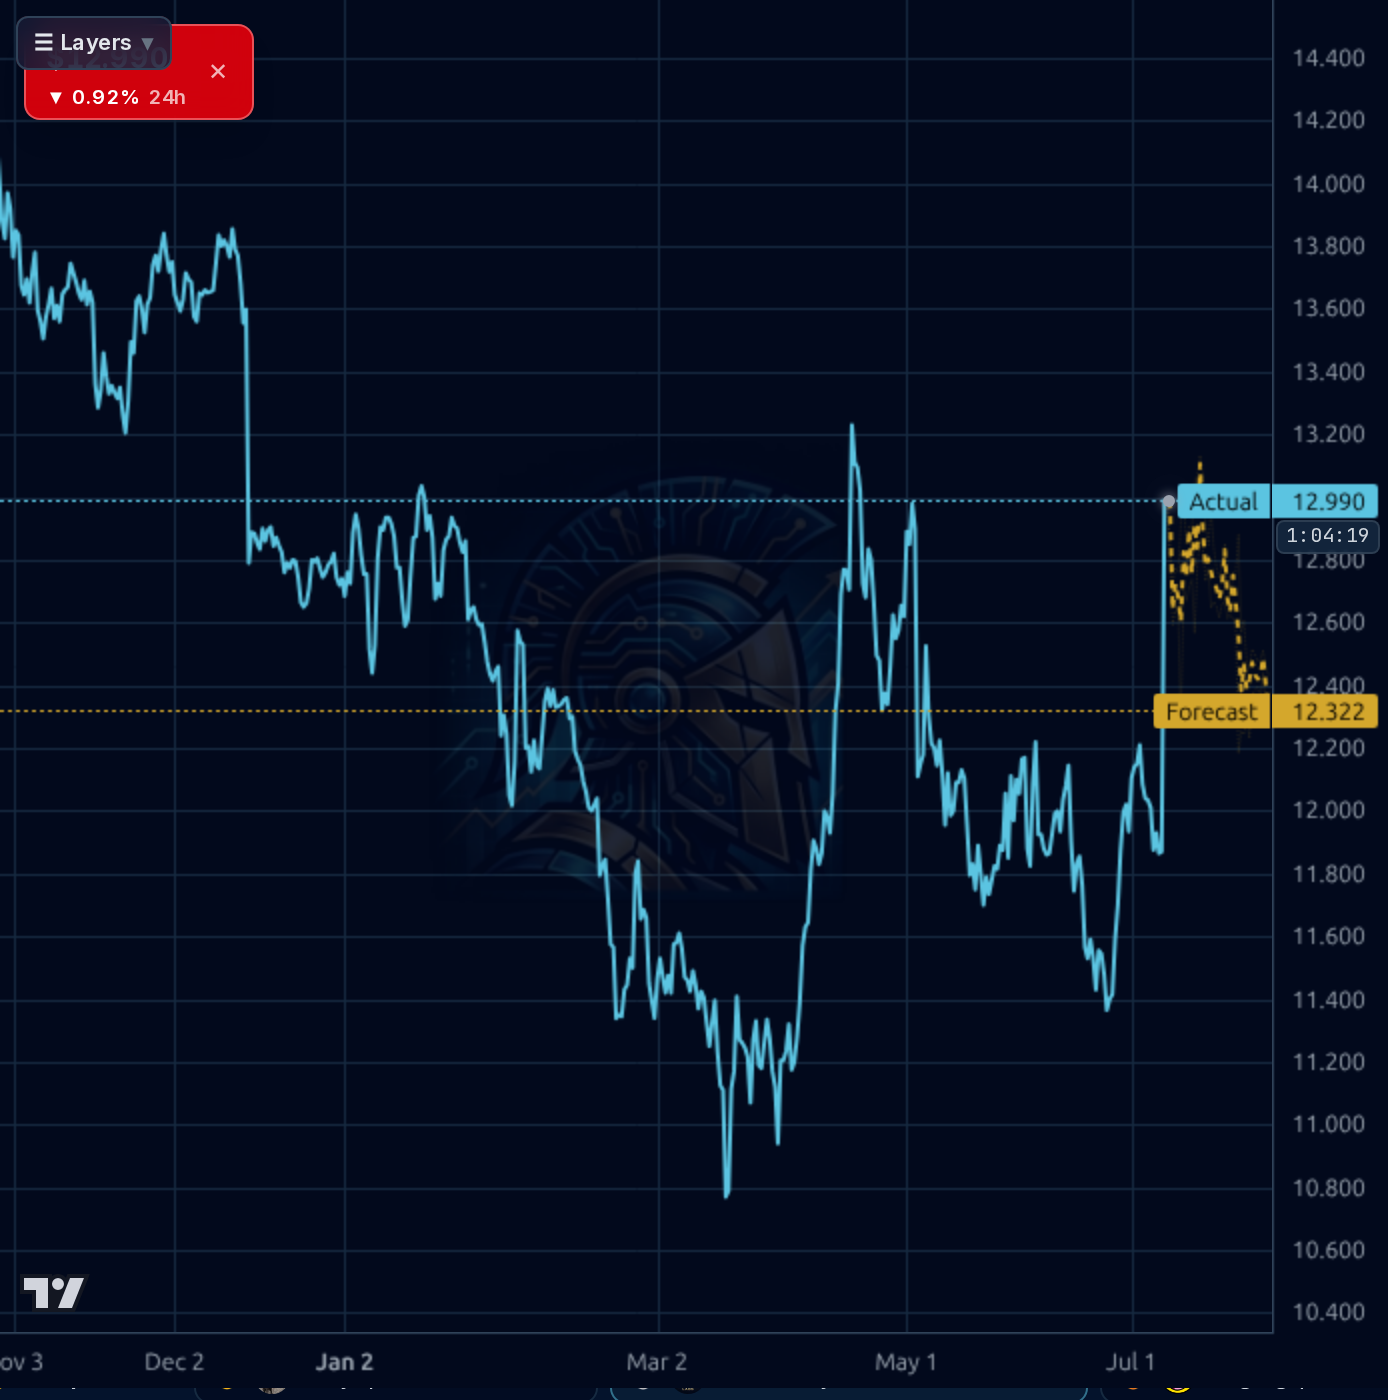
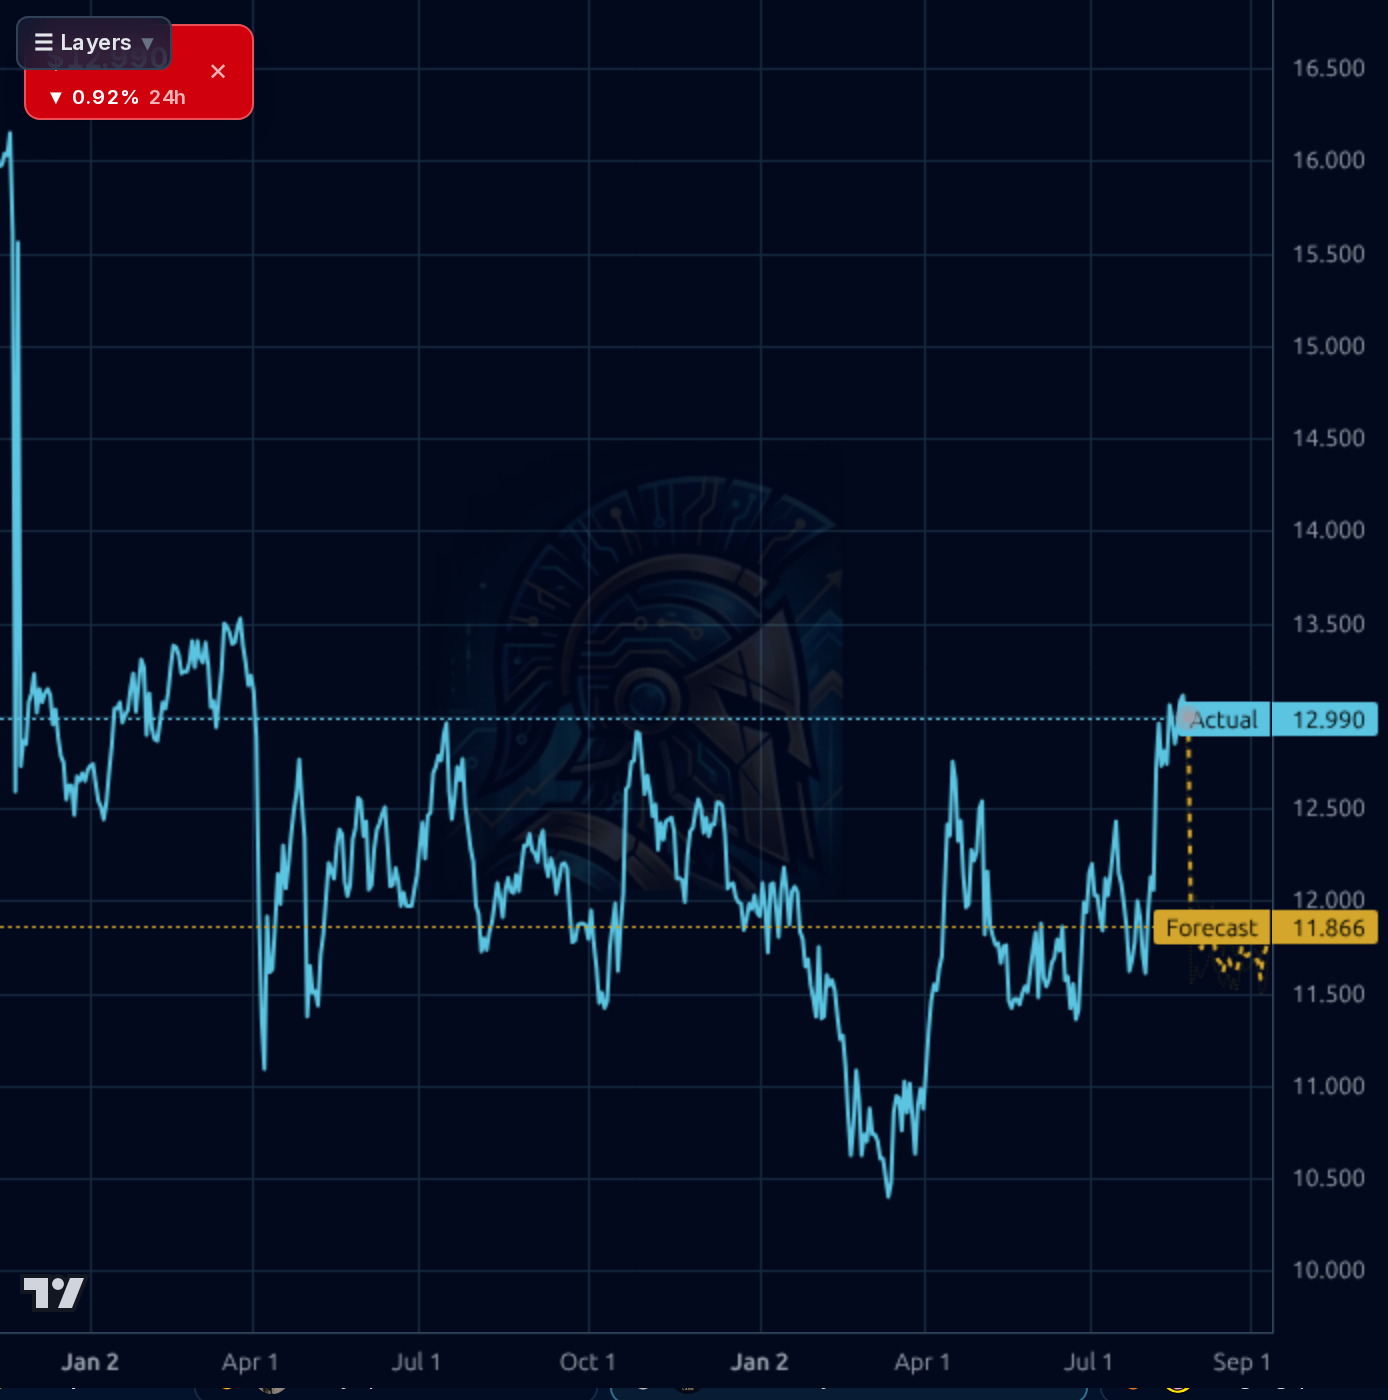
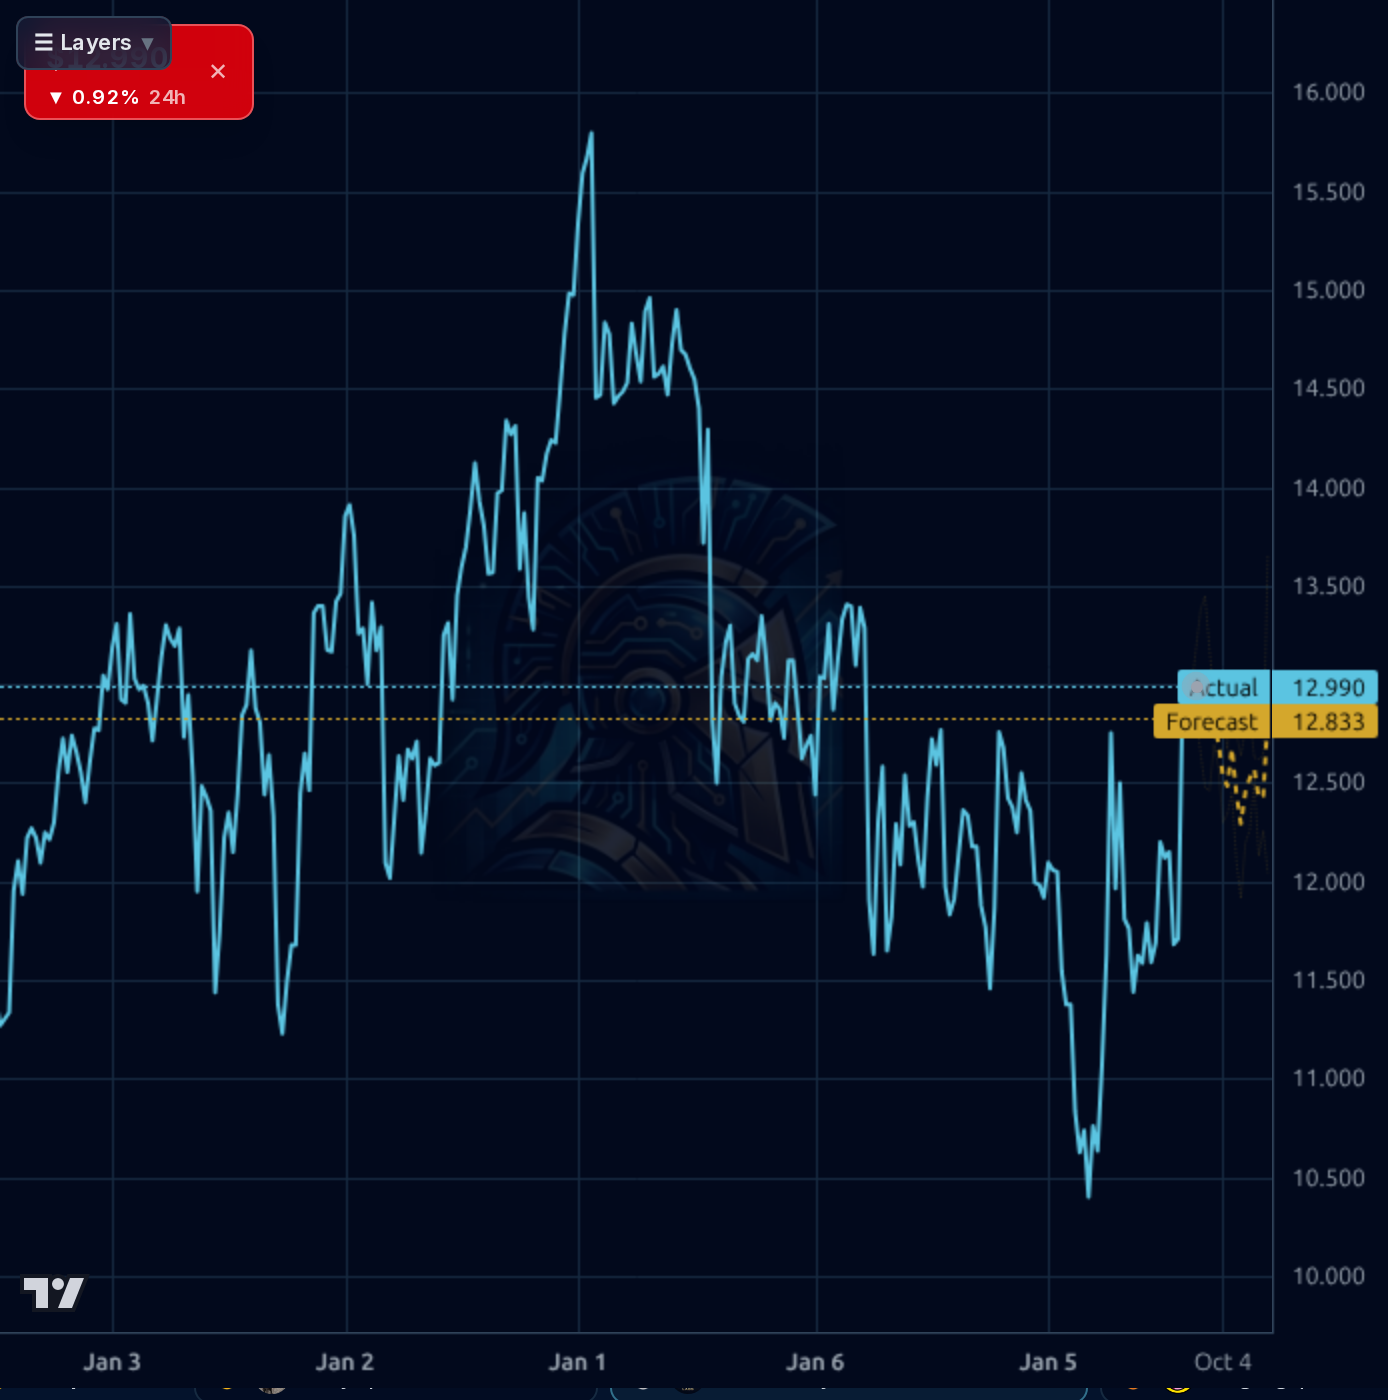
Wait for price to break below $12.44 (50-day SMA) as invalidation level; if it holds above $12.99, consider a small position with stop-loss at $12.30
Focus on Q3 earnings for signs of revenue stabilization or improved loan performance; target price $12.50 based on Kronos AI forecast and analyst consensus. Invalidation: if sales growth remains negative (-8.1% YoY) or debt levels worsen.
Long-term viability depends on successful portfolio restructuring to reduce non-accruals and improve margins. Structural risk is high due to declining revenue trends and high leverage; terminal value may be limited without significant operational turnaround.
Revenue has declined sequentially (Q2 2026: $69.43M vs Q1 2026: $74.8M), with net income falling to $30.94M in Q2, down from $34.55M in Q1. Margins are under pressure (operating margin at 61.45% but declining due to revenue contraction). Balance sheet remains fragile with debt-to-equity at 107.62 and current ratio at 0.22, indicating significant refinancing risk. Free cash flow is positive ($89.35M) but insufficient to service high leverage given the $1.45B total debt. Capital allocation has been conservative with portfolio restructuring (exiting Thrasio), but revenue decline continues.
The chart shows a downtrend from 2026-01 to 2026-07, followed by consolidation near $12.44. The Kronos AI forecast band suggests a narrow range between $11.86 and $12.99, with the current price at $12.99 (actual) within the upper band. Support is at $11.86 (forecast low), while resistance is near $13.00. The 50-day SMA ($12.44) acts as a key technical support level. Momentum indicators like RSI (61.58) suggest overbought conditions, but the price has held above the 20-day SMA (3.87% gain), indicating short-term resilience.
Recent news highlights declining revenue and portfolio contraction: Q2 loan sales fell by 7.8% YoY to $69.43M, with non-accruals reduced but overall revenue pressure mounting. The company's dividend yield is high (10.15%) but unsustainable given the debt burden. Analyst sentiment is mixed with a 'Hold' rating from SeekingAlpha due to persistent portfolio shrinkage and weak dividend coverage. However, positive news includes strategic exits of troubled positions like Thrasio, which may improve asset quality.
- Strategic exit of troubled positions (e.g., Thrasio) reducing non-accruals by over 85% as per Q2 earnings call
- Sustained negative sales growth (-8.1% YoY) eroding cash flow
- High debt-to-equity ratio (107.62) creating refinancing risk
- Declining operating margins under revenue pressure
Get AI analysis on any stock
This is one of hundreds of Kronos AI reports — scored fundamentals & technicals, bull/base/bear price targets, a multi-horizon plan, and continuously-updated forecasts across the market. Create a free account to explore them all.
Create your free account →Already a member? Sign in · Join our Discord