OHI — AI Stock Forecast & Price Targets
Published 8/23/2026 · A free sample of K3vl4r’s AI-powered analysis.
Kronos price forecasts, scored fundamentals & technicals, and a multi-horizon plan.
View the live OHI price forecast →
OHI's structural healthcare REIT advantages are supported by strong operational margins and dividend yield, but high leverage and liquidity concerns create significant near-term risk. Recent earnings upgrades and positive analyst sentiment provide tailwinds, yet the current price is trading above our base target amid elevated financial fragility.
Hold near current price ($46.75); invalidation below $39.26 (52-week low). Monitor short float for potential volatility spikes; target $51.88 from market snapshot as base, but adjust for leverage risk.
Accumulate if price dips to $40-42; catalysts include earnings beat and continued asset sales. Expect 10-15% upside over 6 months based on current guidance, but watch for interest rate sensitivity triggering a pullback below $40.
Long-term thesis remains strong due to secular healthcare demand growth, but near-term risk from leverage requires patience. Terminal value driven by occupancy rates and pricing power; biggest structural risk is rising interest rates eroding margins or triggering covenant breaches
Revenue grew 16.32% QoQ (Q2 2026), with operating margins at 63.30% and gross margins at 72.24%, indicating strong pricing power. However, the balance sheet shows extreme leverage (D/E 71.47x) and a current ratio of 0.444, raising liquidity concerns. Dividend yield is attractive at 5.84% but payout ratios exceed 100%, suggesting sustainability risk. Management raised full-year guidance and increased dividends amid $563M in asset sales (Q2 2026), improving cash flow generation.
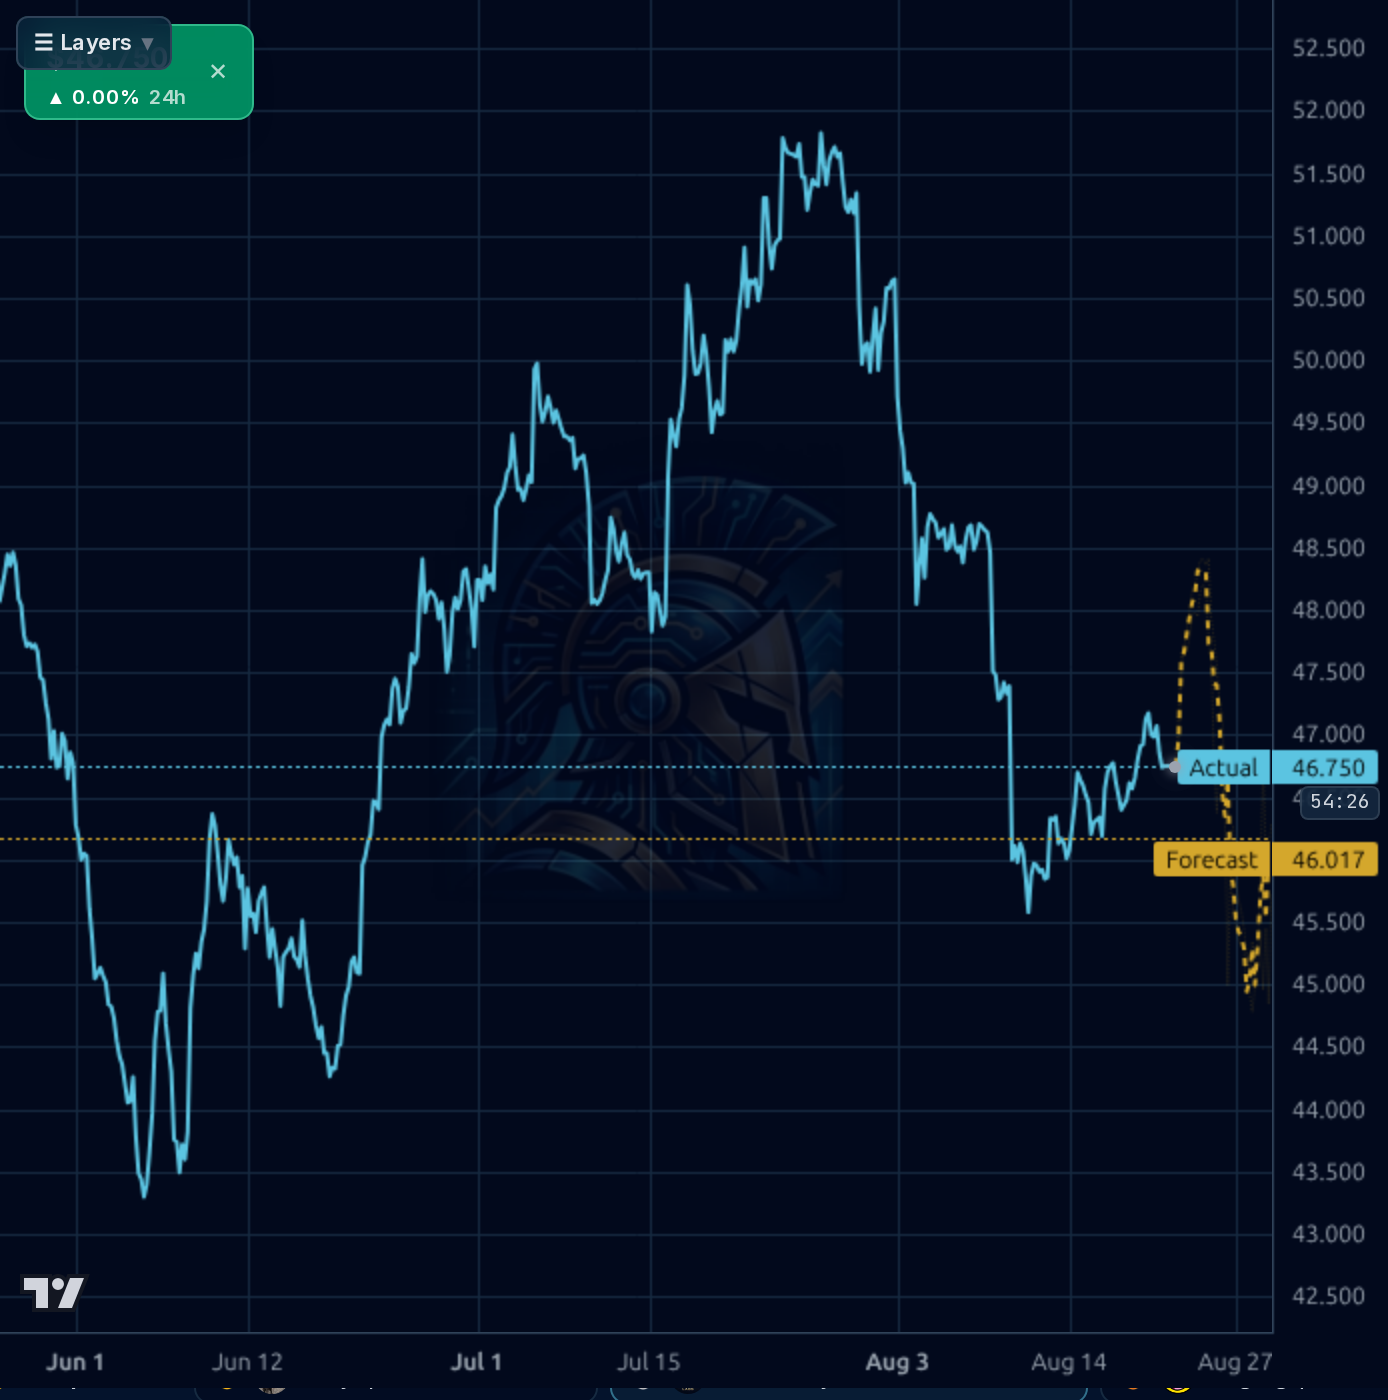
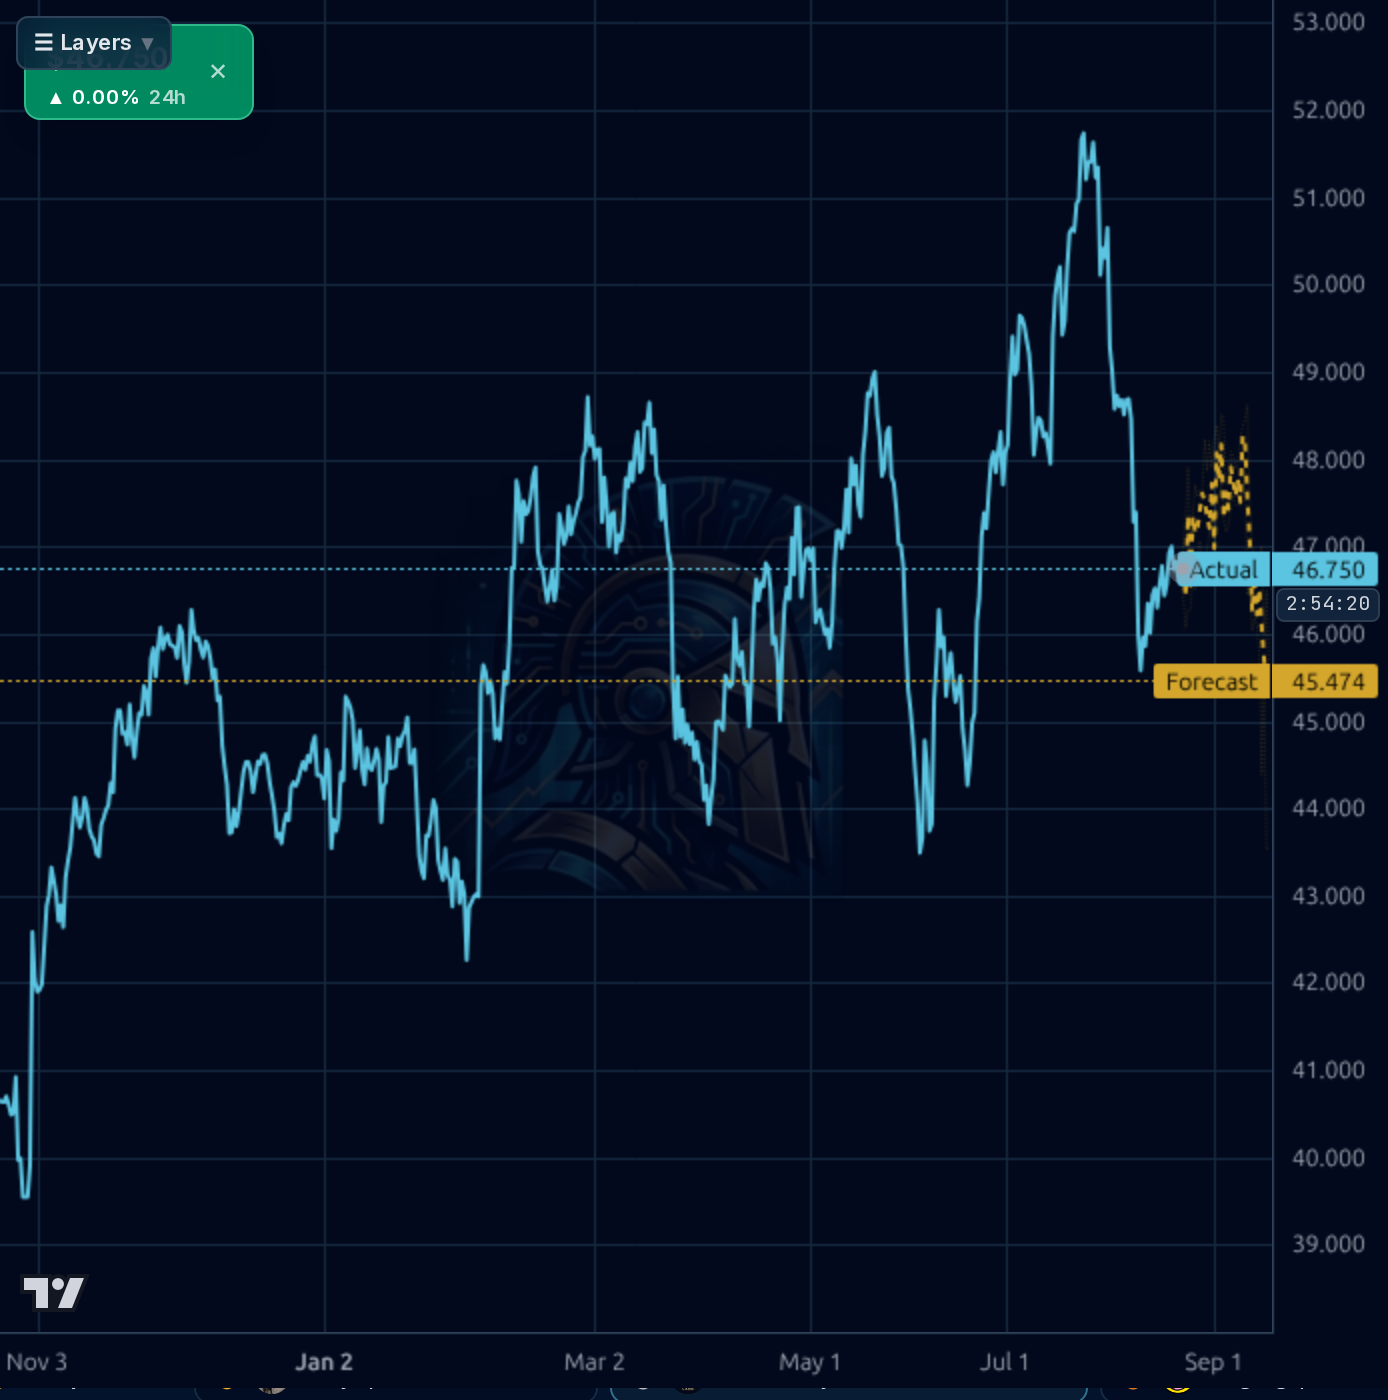
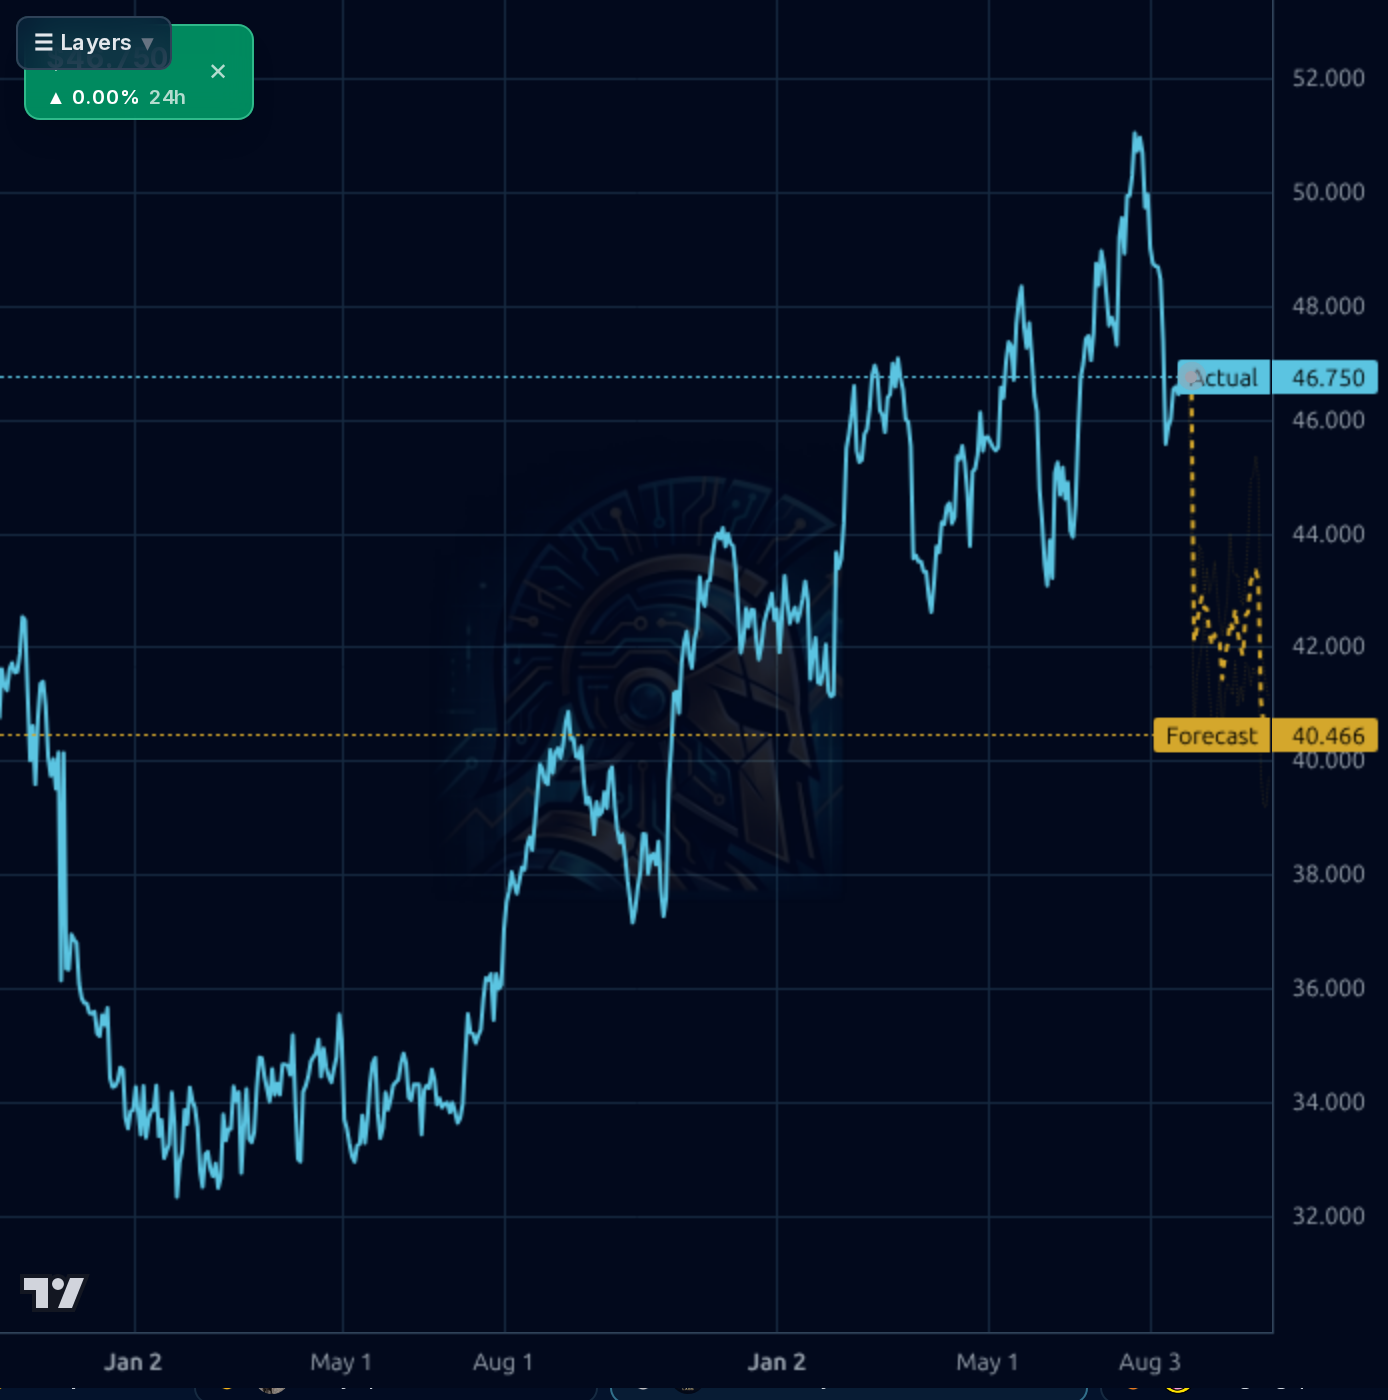
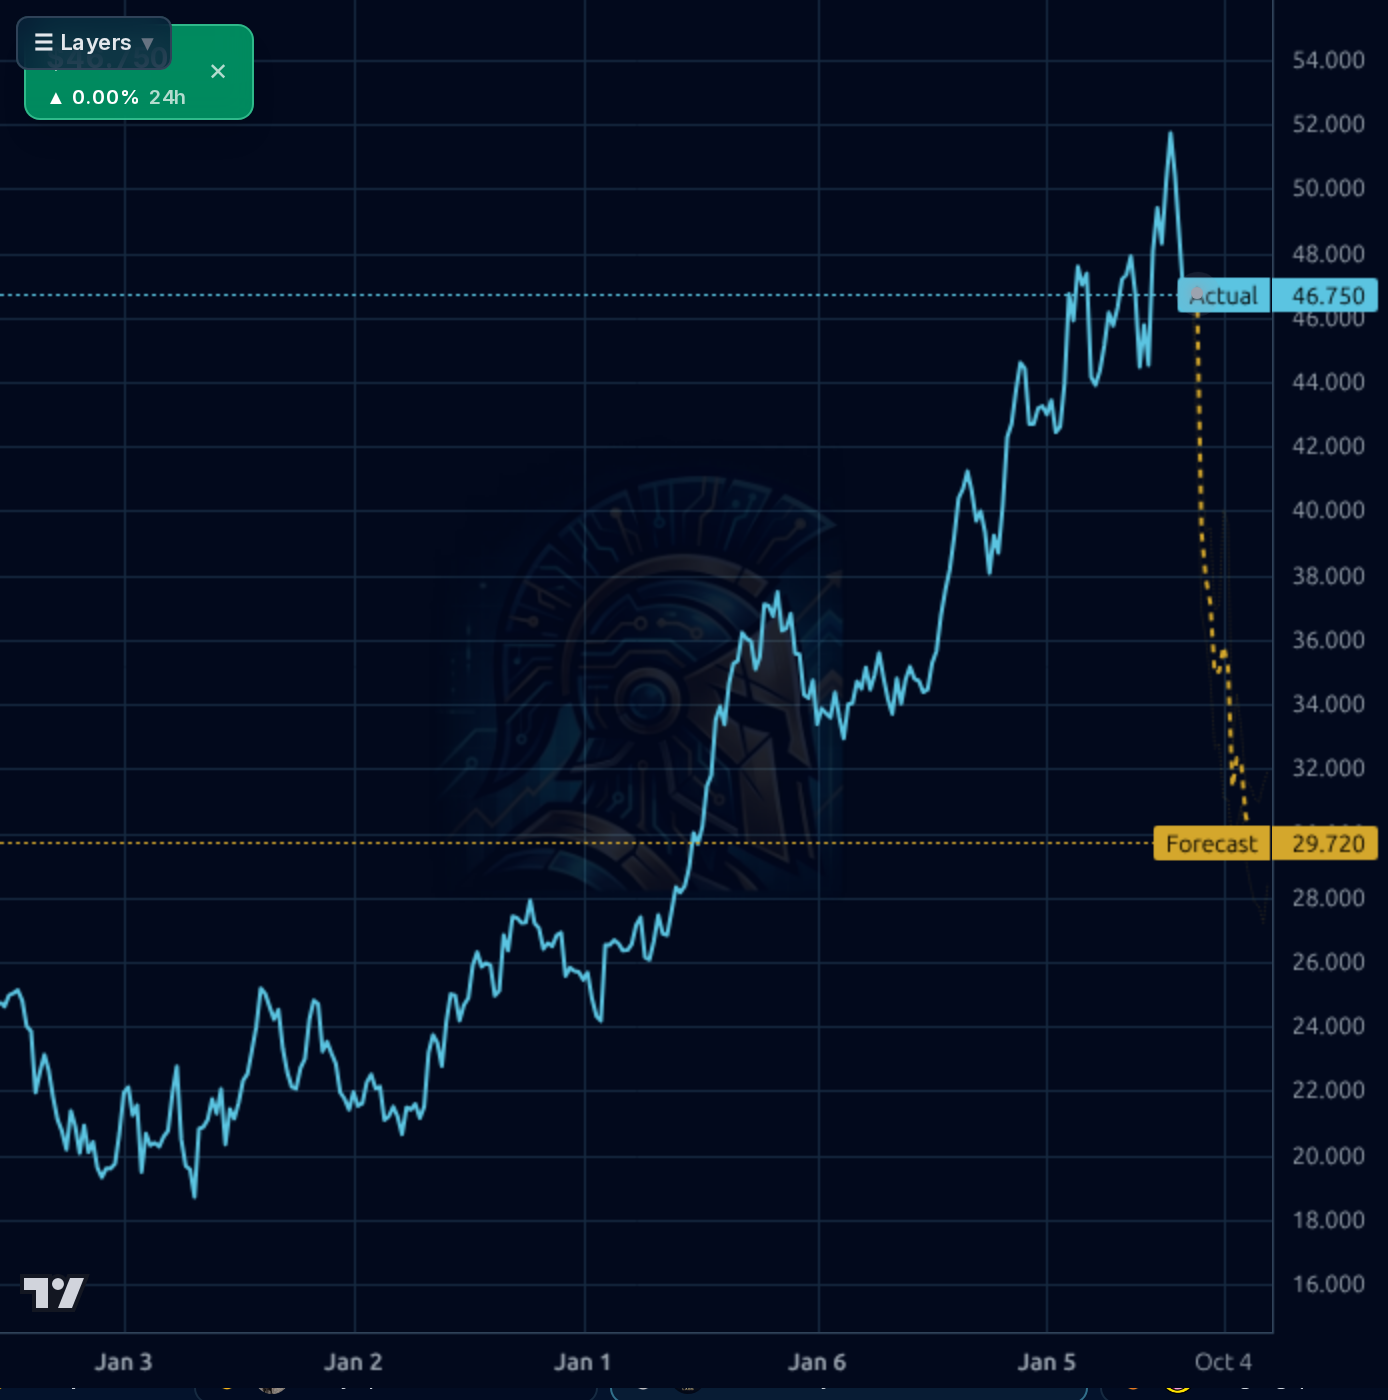
The chart shows a strong uptrend with recent price action near the $52.39 high, but the forecast band from Kronos AI suggests potential downside to $40.466 and $29.720. The 50-day SMA is at $46.75 (current price), while the 200-day SMA shows a positive slope. RSI of 39.62 indicates neutral momentum, but the high short float (4.26%) and short ratio (6.86) suggest potential volatility if resistance breaks. The hammer chart pattern mentioned in news suggests support near $39.26.
Recent earnings call showed management raised full-year guidance and increased dividends amid asset sales ($563M), providing positive catalysts. Citigroup raised its price target to $58, while Zacks highlighted a potential turnaround due to hammer chart pattern. However, the high leverage (D/E 71.47x) and payout ratios exceeding 100% create significant downside risk if earnings miss or interest rates rise.
- $563M in asset sales (Q2 2026) improving balance sheet strength
- Full-year guidance increase amid strong operational cash flow generation
- Extreme leverage (D/E >71x) amplifies sensitivity to interest rate hikes
- Dividend sustainability risk due to payout ratios exceeding 100%
- Potential for sharp downside if earnings miss or credit tightening occurs
Get AI analysis on any stock
This is one of hundreds of Kronos AI reports — scored fundamentals & technicals, bull/base/bear price targets, a multi-horizon plan, and continuously-updated forecasts across the market. Create a free account to explore them all.
Create your free account →Already a member? Sign in · Join our Discord