OLLI — AI Stock Forecast & Price Targets
Published 8/18/2026 · A free sample of K3vl4r’s AI-powered analysis.
Kronos price forecasts, scored fundamentals & technicals, and a multi-horizon plan.
View the live OLLI price forecast →
OLLI's fundamentals remain robust with resilient margins and cash flow, but severe technical damage from negative sentiment has compressed its valuation to near 52-week lows. The stock is trading at $76.21, 37% below the 200D SMA, with rising short float pressuring the tape ahead of a binary Aug 27 earnings print.
Wait for Aug 27 earnings print; if comp store sales and GM hold above $70, consider a small accumulation at $76-$77 with stop below $74. Invalidation: break of $70 or Q1 OCF miss confirming working capital issues.
Reclaim the $75-77 resistance to break the JPM anchor; target $82 as the next psychological level. Catalysts include first sell-side upgrade post-earnings and normalization of Q2 OCF. Change your mind if short float drops below 10% or earnings beat with guidance revision.
Terminal thesis: $105+ driven by structural closeout sourcing advantage and loyalty program growth. Biggest risk is competitive intensity from TJX, ROST, BURL compressing margins. Long-term value hinges on maintaining gross margins above 40% amid retail bankruptcy pace
Revenue growth remains strong at 16.7% TTM with Q/Q sales up 14.25%, supported by resilient gross margins of 39-42%. The balance sheet is fortress-like with $197.7M cash, Debt/Eq 0.38, and current ratio 2.32. However, Q1 FY26 OCF collapsed to $45.5M vs prior $182M, signaling working capital normalization risks. The company's $250M cash position provides optionality for buybacks at compressed multiples, but the recent JPM downgrade to Neutral with PT cut from $70 to $73 creates a hard resistance ceiling.
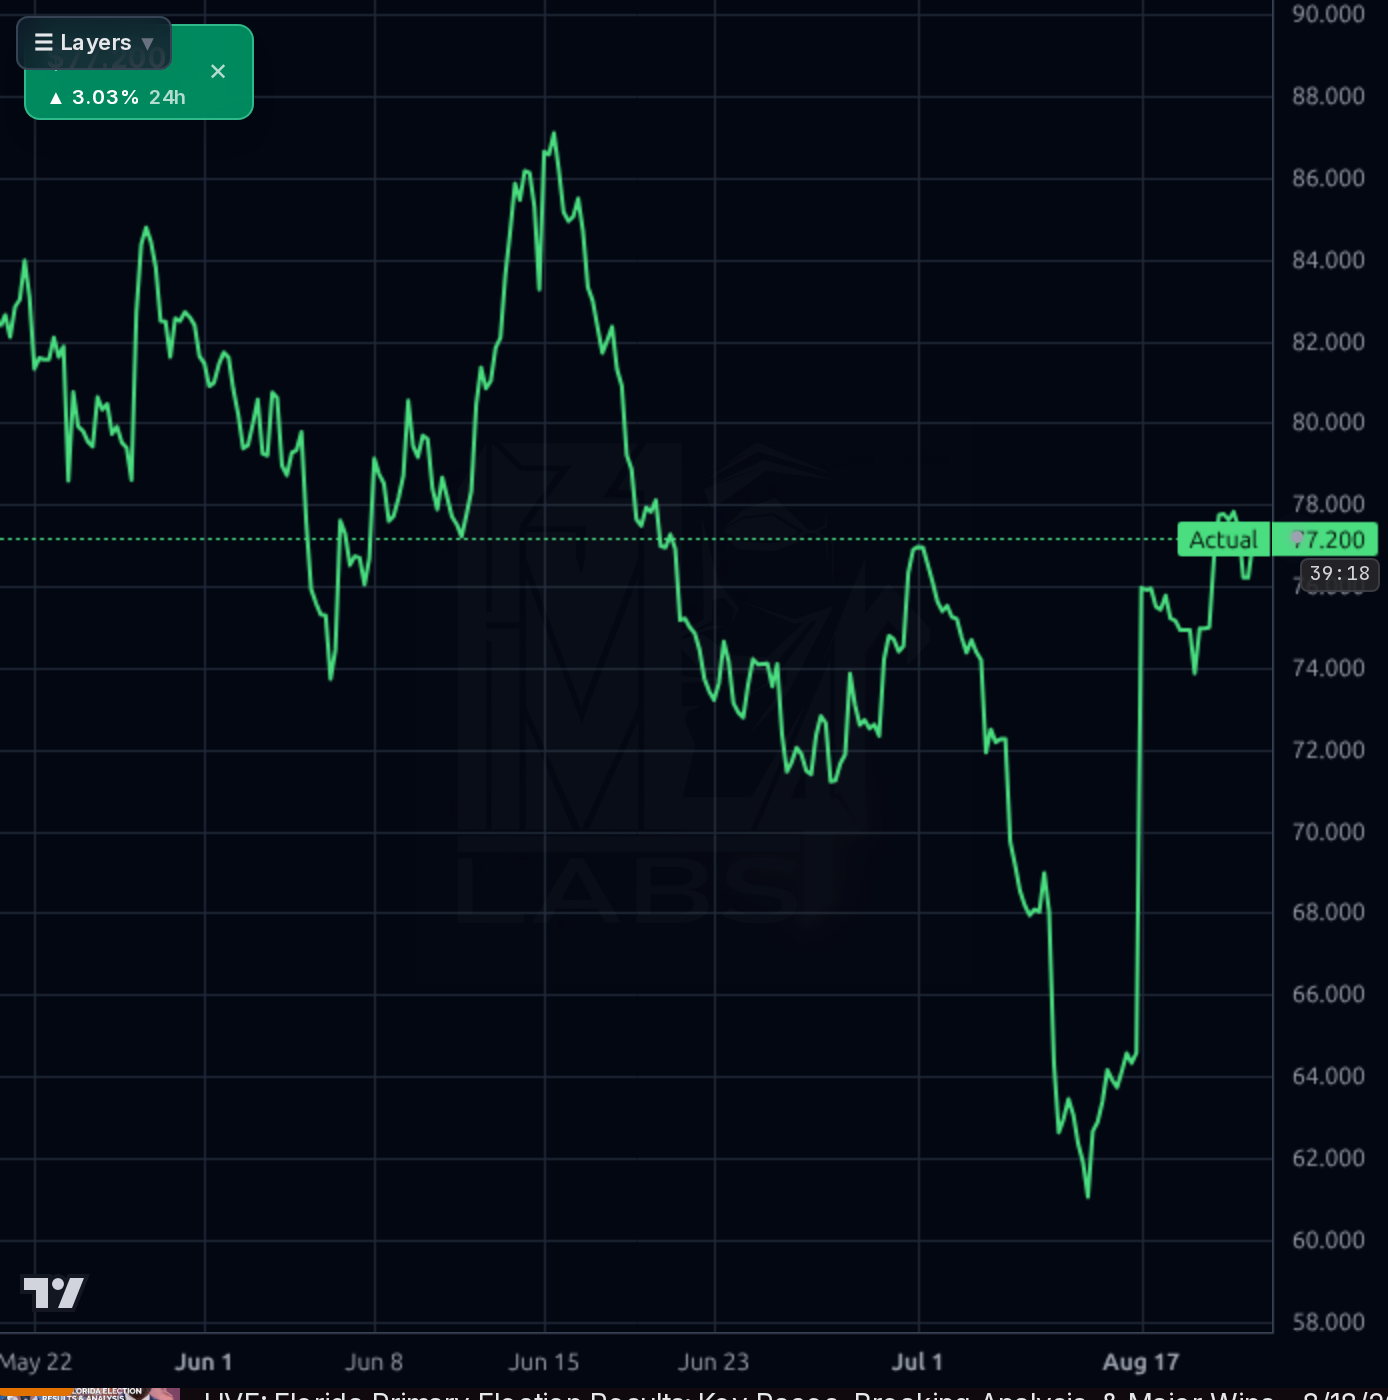
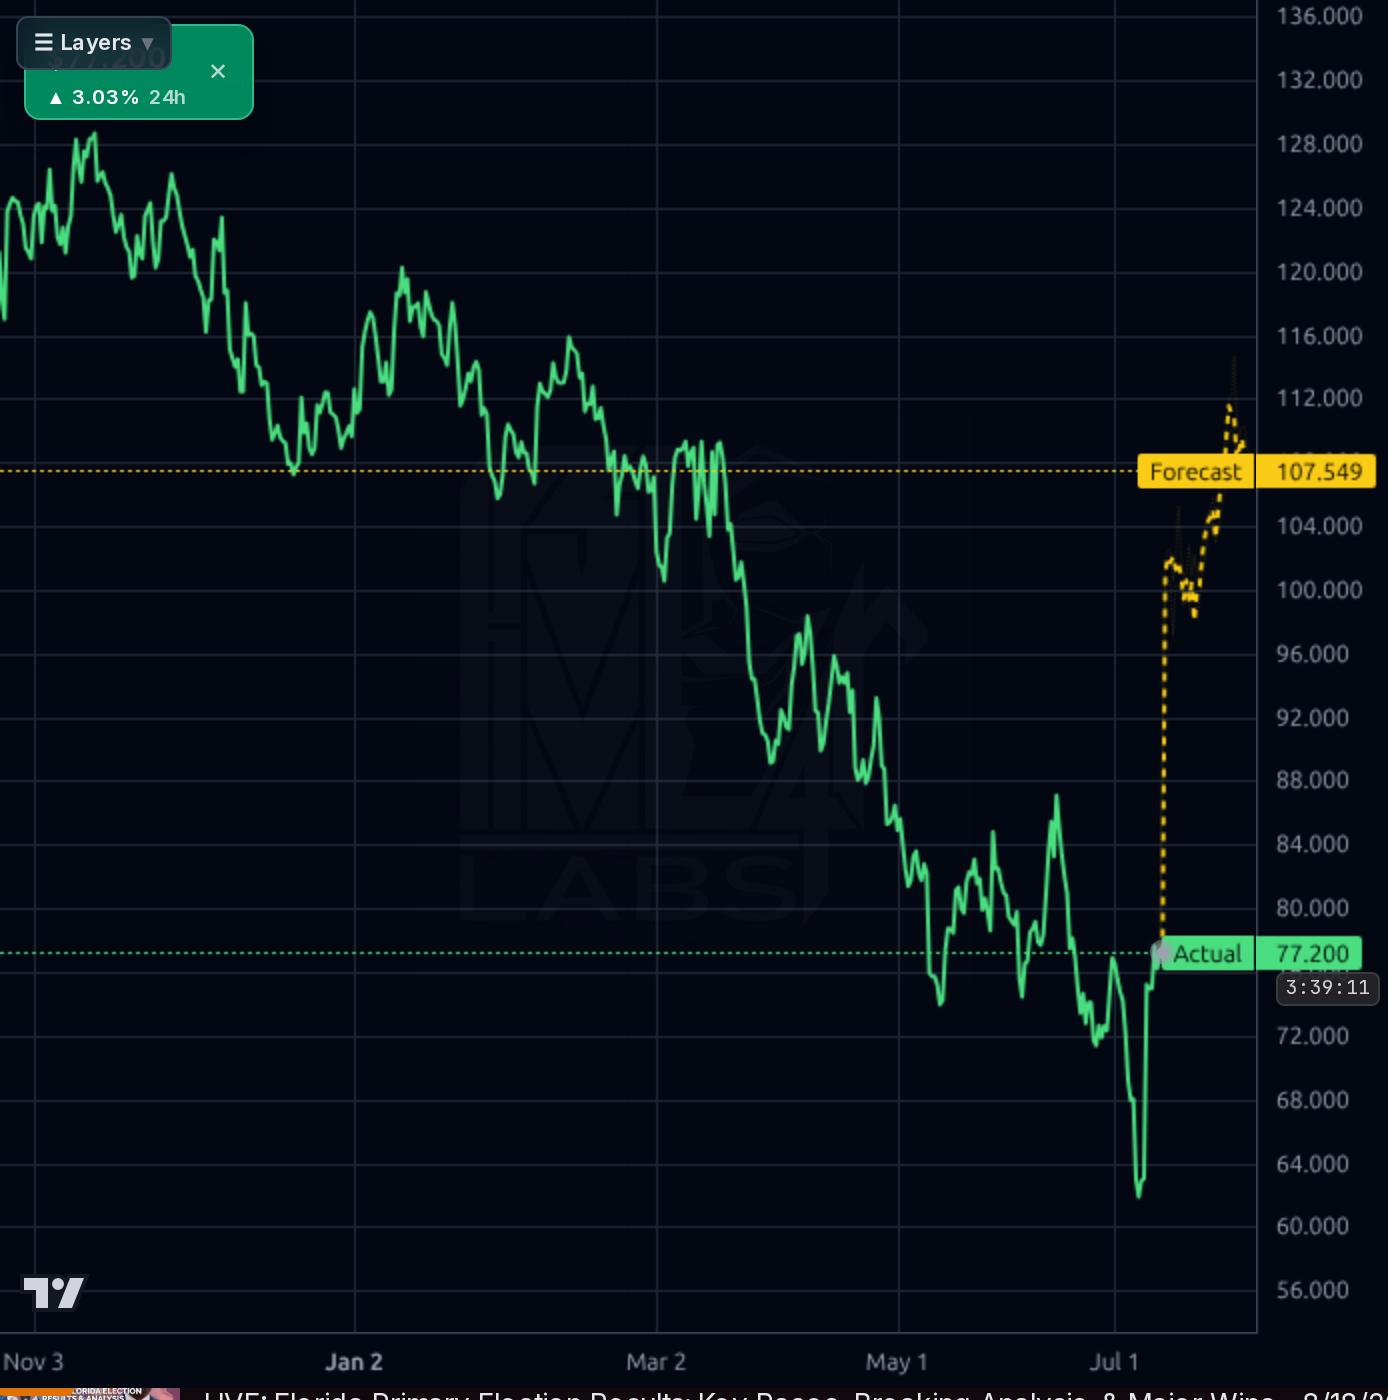
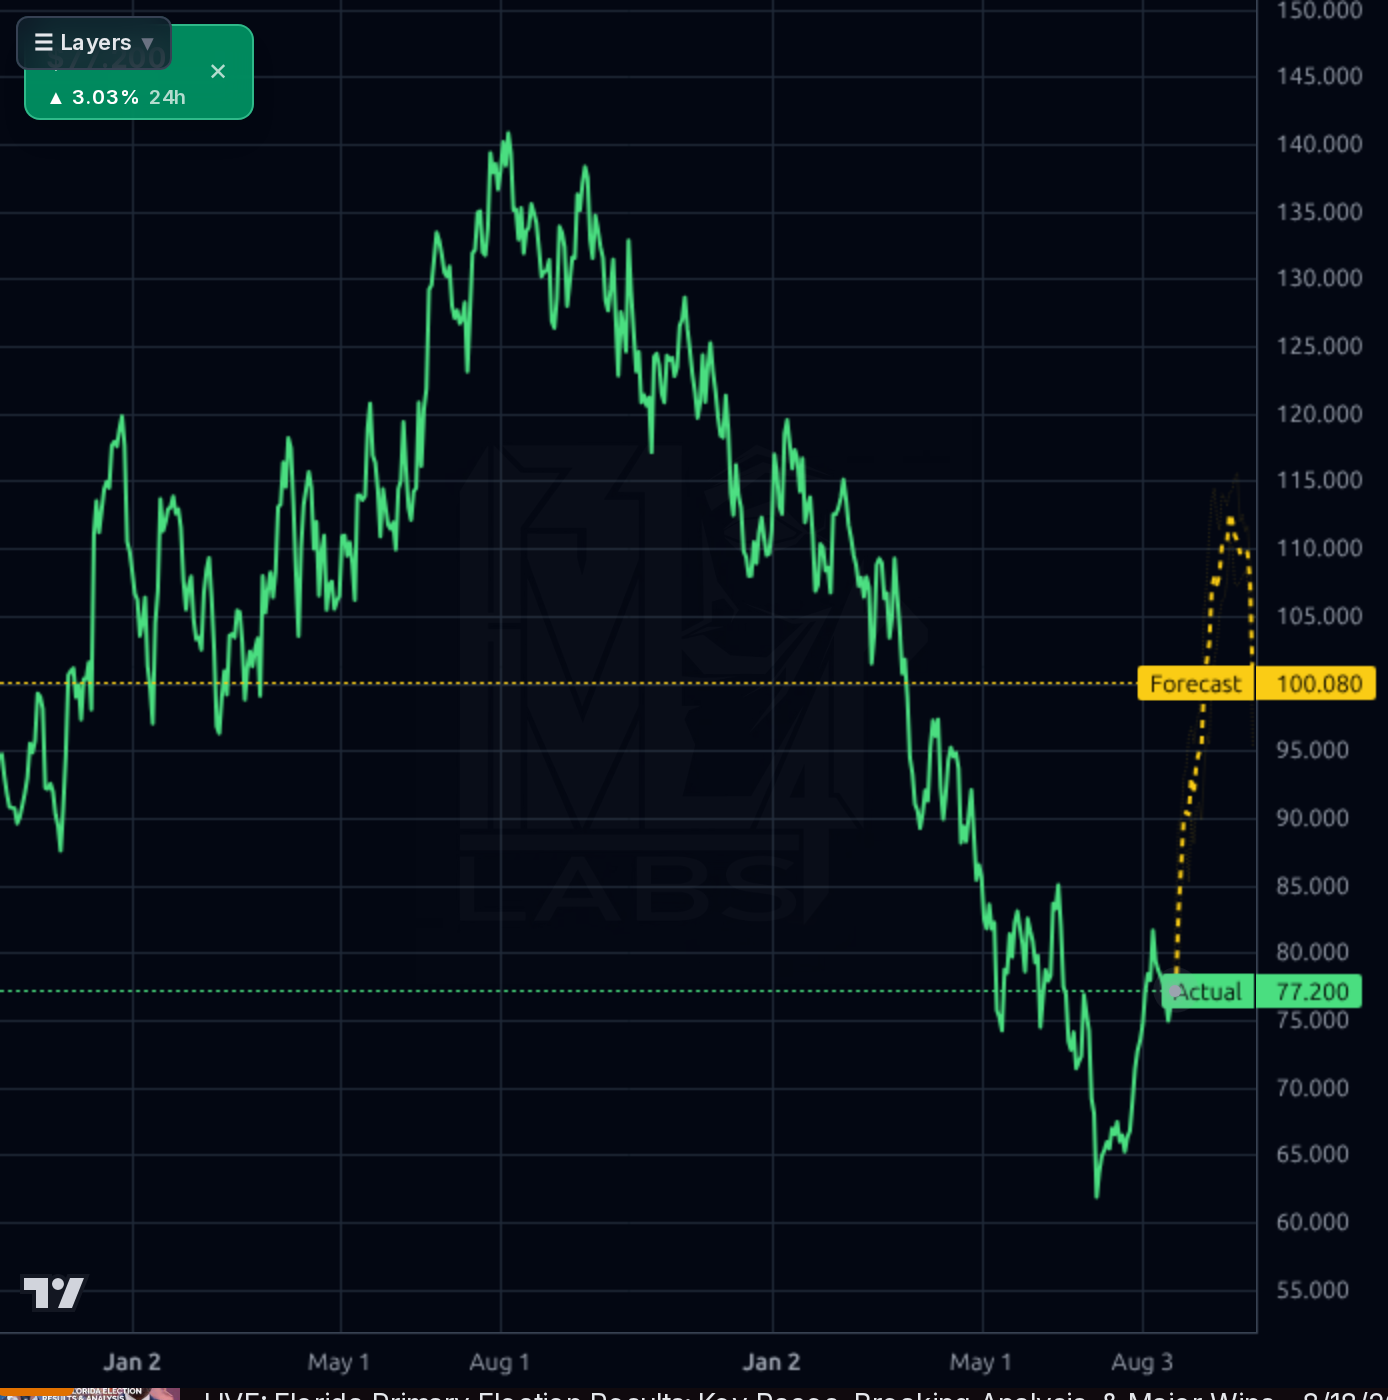
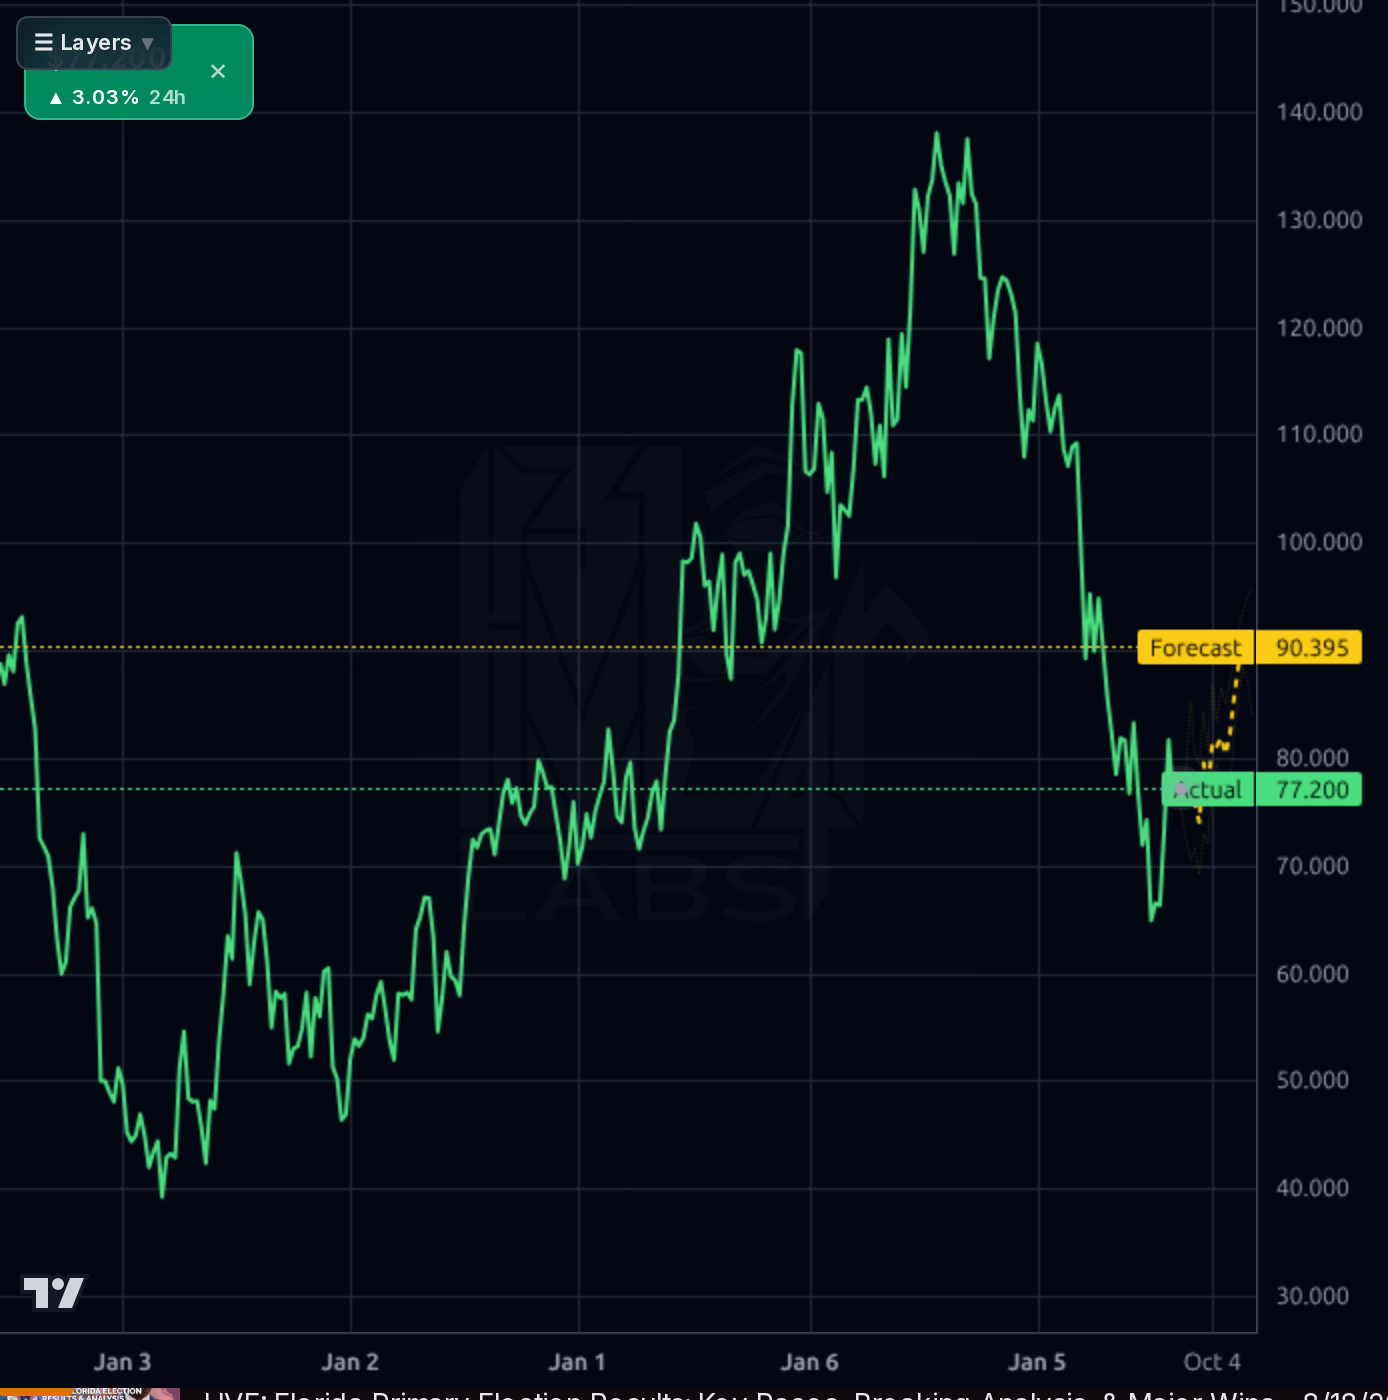
The chart shows a broken tape with price 37% below the 200D SMA and RSI in mid-30s on a -48.8% YoY move, indicating orderly distribution rather than capitulation. Support at $60.29 (52W low) must hold; break signals $52-55 downside. Resistance sequence to reclaim: $70 (JPM/gap), $75-77 (Jul 7 lower high), $82 (50D SMA). The Kronos AI forecast band ($77.20 actual vs $90.395 forecast) is unreliable as directional accuracy is only 50% for 1wk horizon, with the model consistently overestimating upside.
Recent news highlights a binary earnings catalyst on Aug 27 with JPM maintaining Neutral at $73 PT and Wells Fargo lowering PT to $100. The company's Q2 results missed estimates (-14.89% EPS), but Ollie's Army loyalty program data suggests strong consumer demand for discount stores amid inflation. However, the Kronos AI forecast band ($90.395) has failed 8-for-8 in prior calls, indicating unreliable upside potential.
- Ollie's Army loyalty program survey data shows strong consumer demand for discount stores amid inflation, with 60,000 members surveyed
- Rising short float into earnings print (10.96%) creating continued pressure
- JPMorgan's $70 PT anchor acting as hard resistance ceiling
- Q2 OCF normalization risk after Q1 collapse to $45.5M
Get AI analysis on any stock
This is one of hundreds of Kronos AI reports — scored fundamentals & technicals, bull/base/bear price targets, a multi-horizon plan, and continuously-updated forecasts across the market. Create a free account to explore them all.
Create your free account →Already a member? Sign in · Join our Discord