OLLI — AI Stock Forecast & Price Targets
Published 7/10/2026 · A free sample of K3vl4r’s AI-powered analysis.
Kronos price forecasts, scored fundamentals & technicals, and a multi-horizon plan.
View the live OLLI price forecast →
OLLI presents a fundamentally sound bargain retailer with resilient unit economics (39-42% GM) and strong balance sheet metrics, but its stock has severely decoupled from these fundamentals due to negative sentiment and analyst downgrades. The current valuation appears deeply compressed relative to historical performance, suggesting staged accumulation is warranted while respecting key technical resistance levels like the $70 JPM anchor.
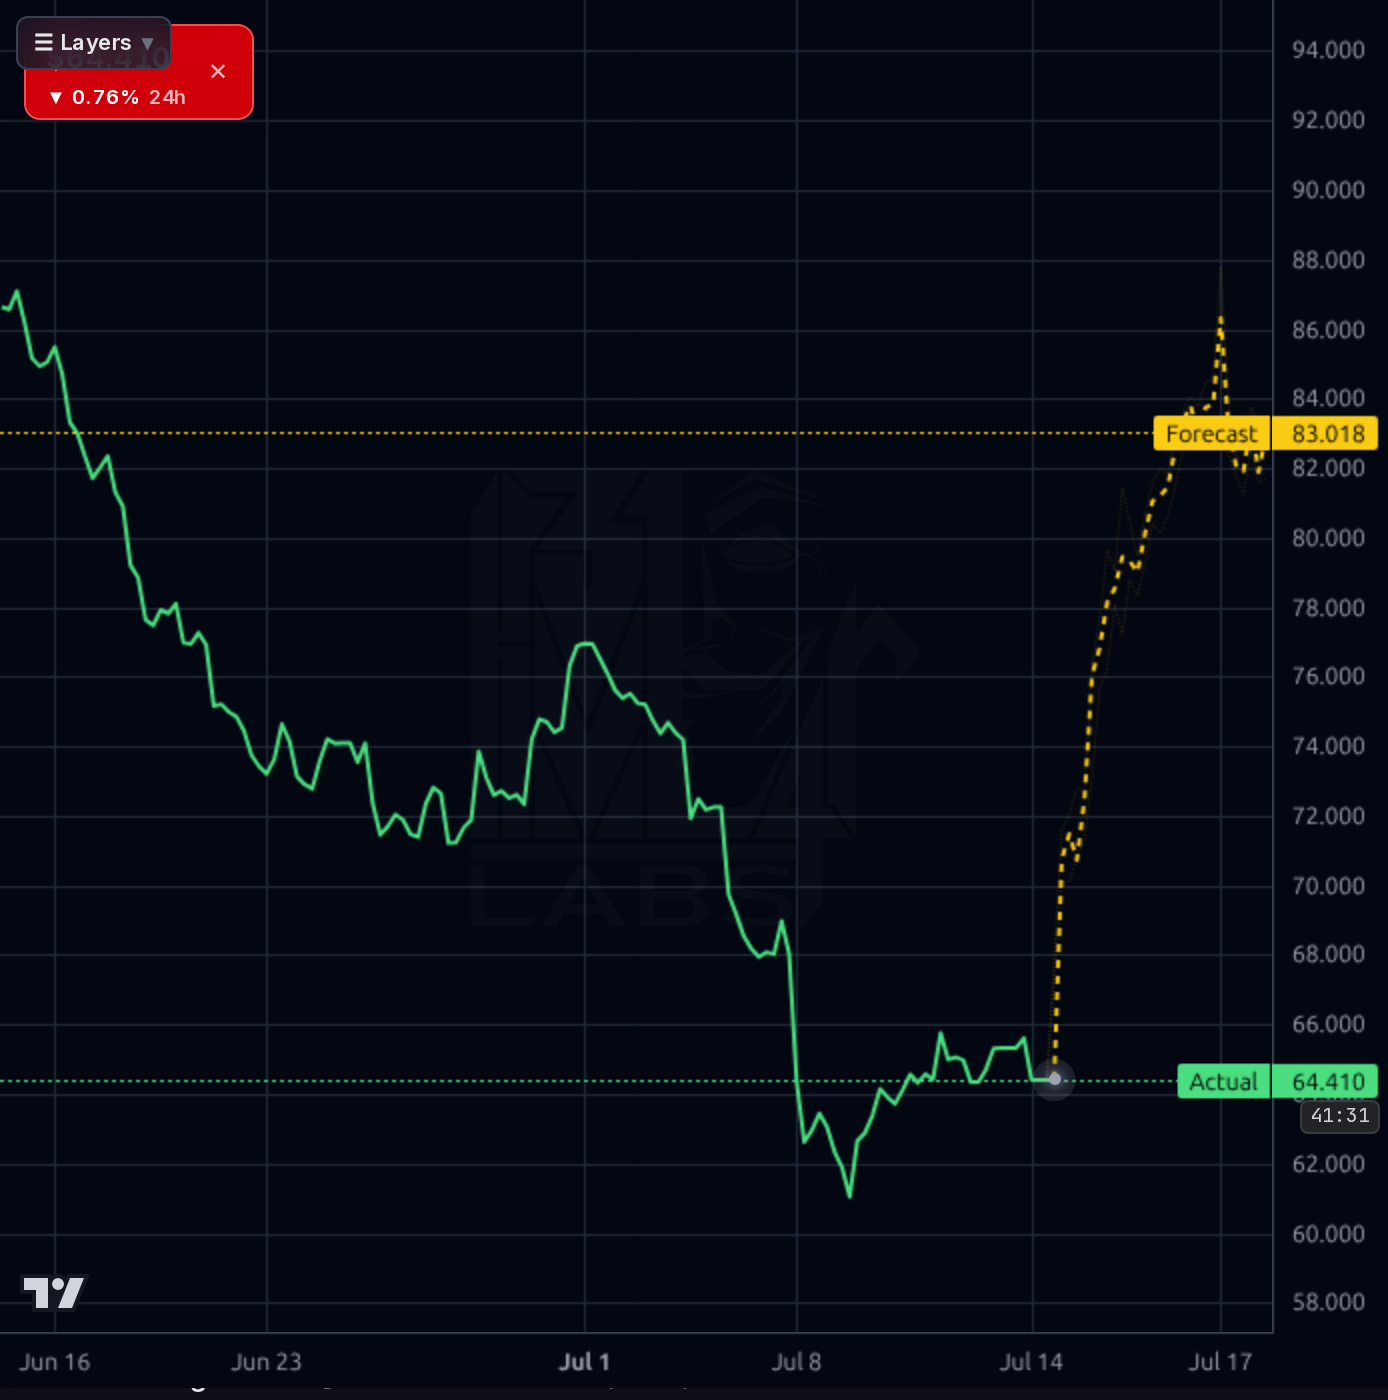
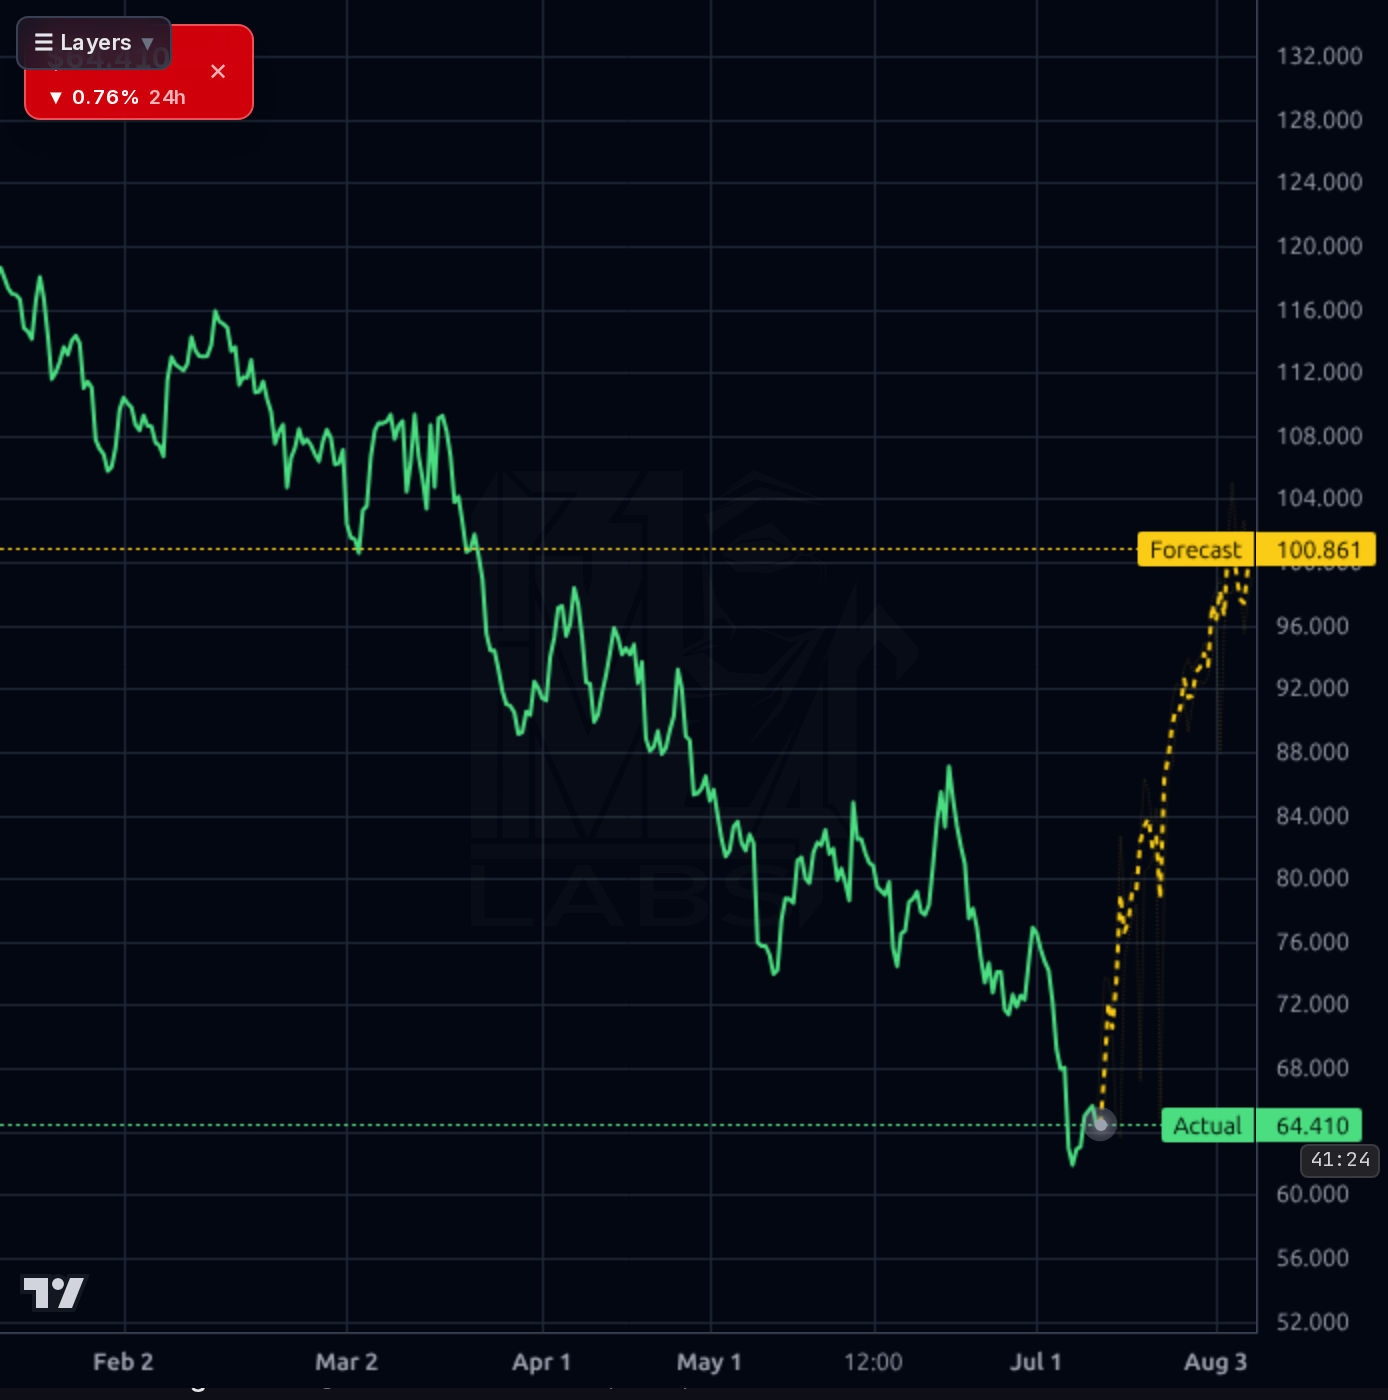
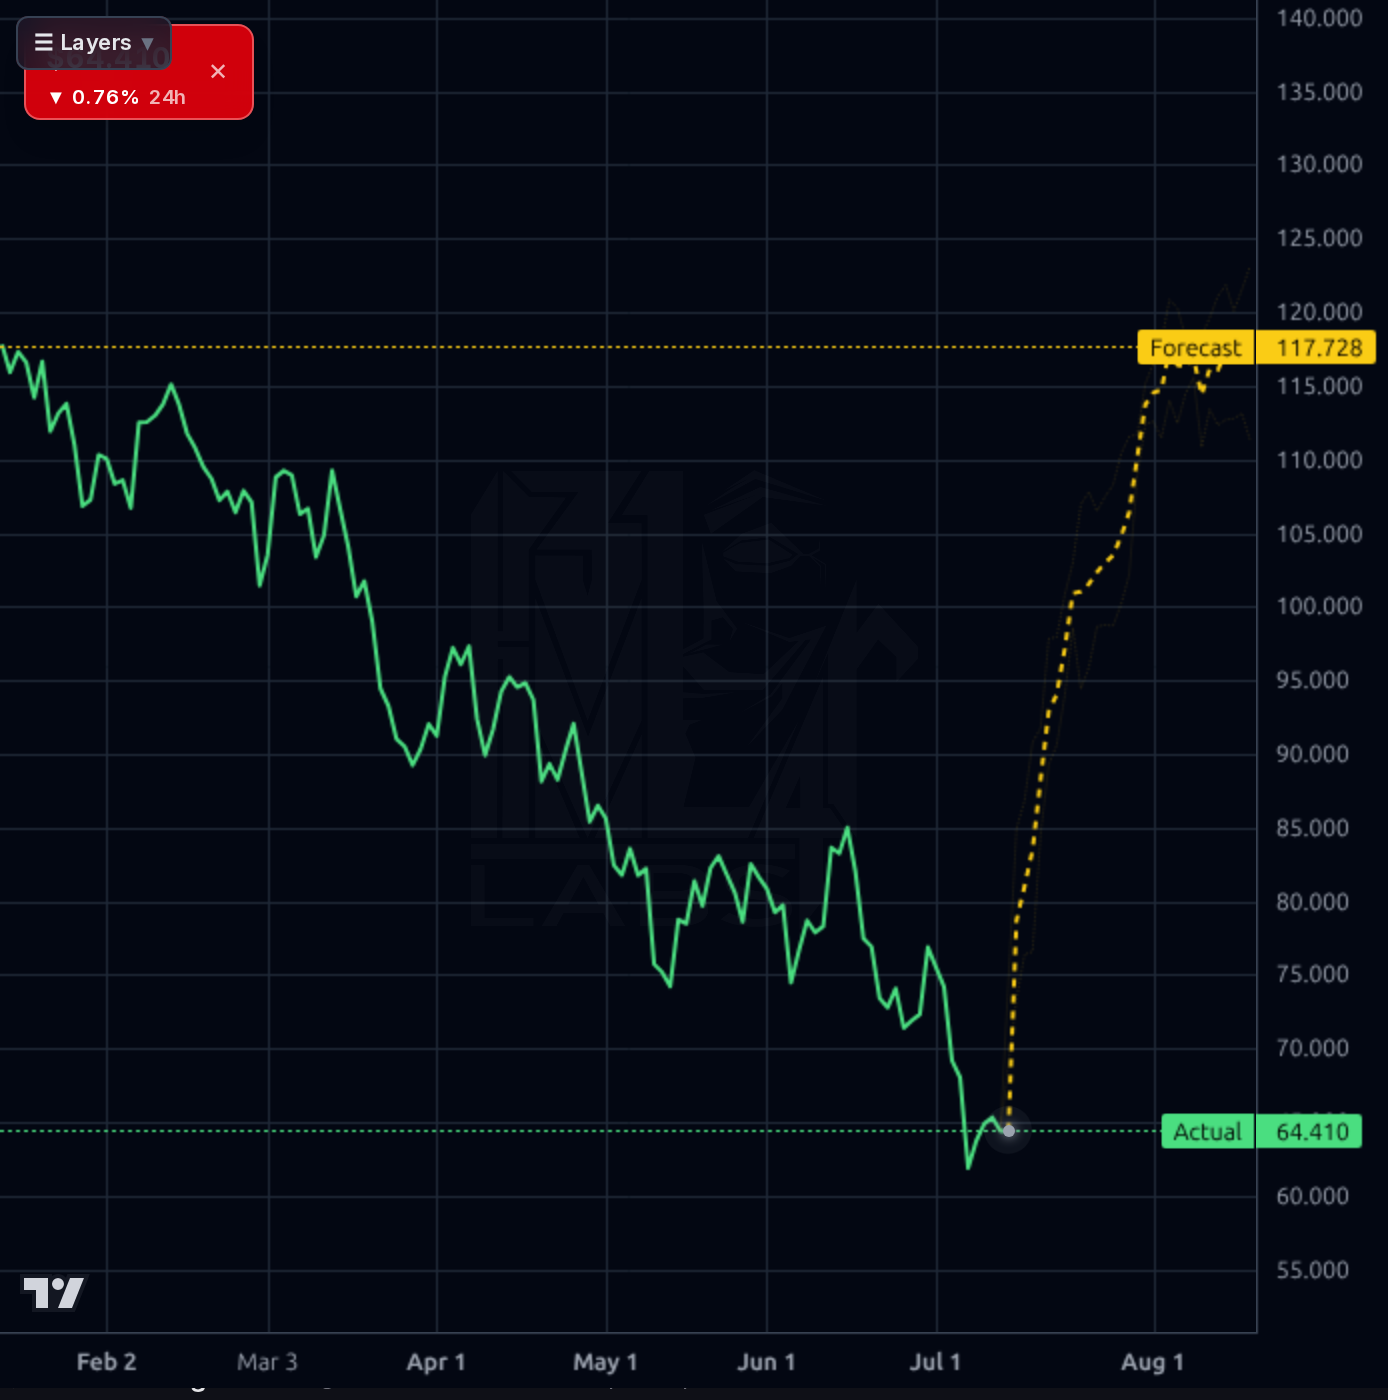
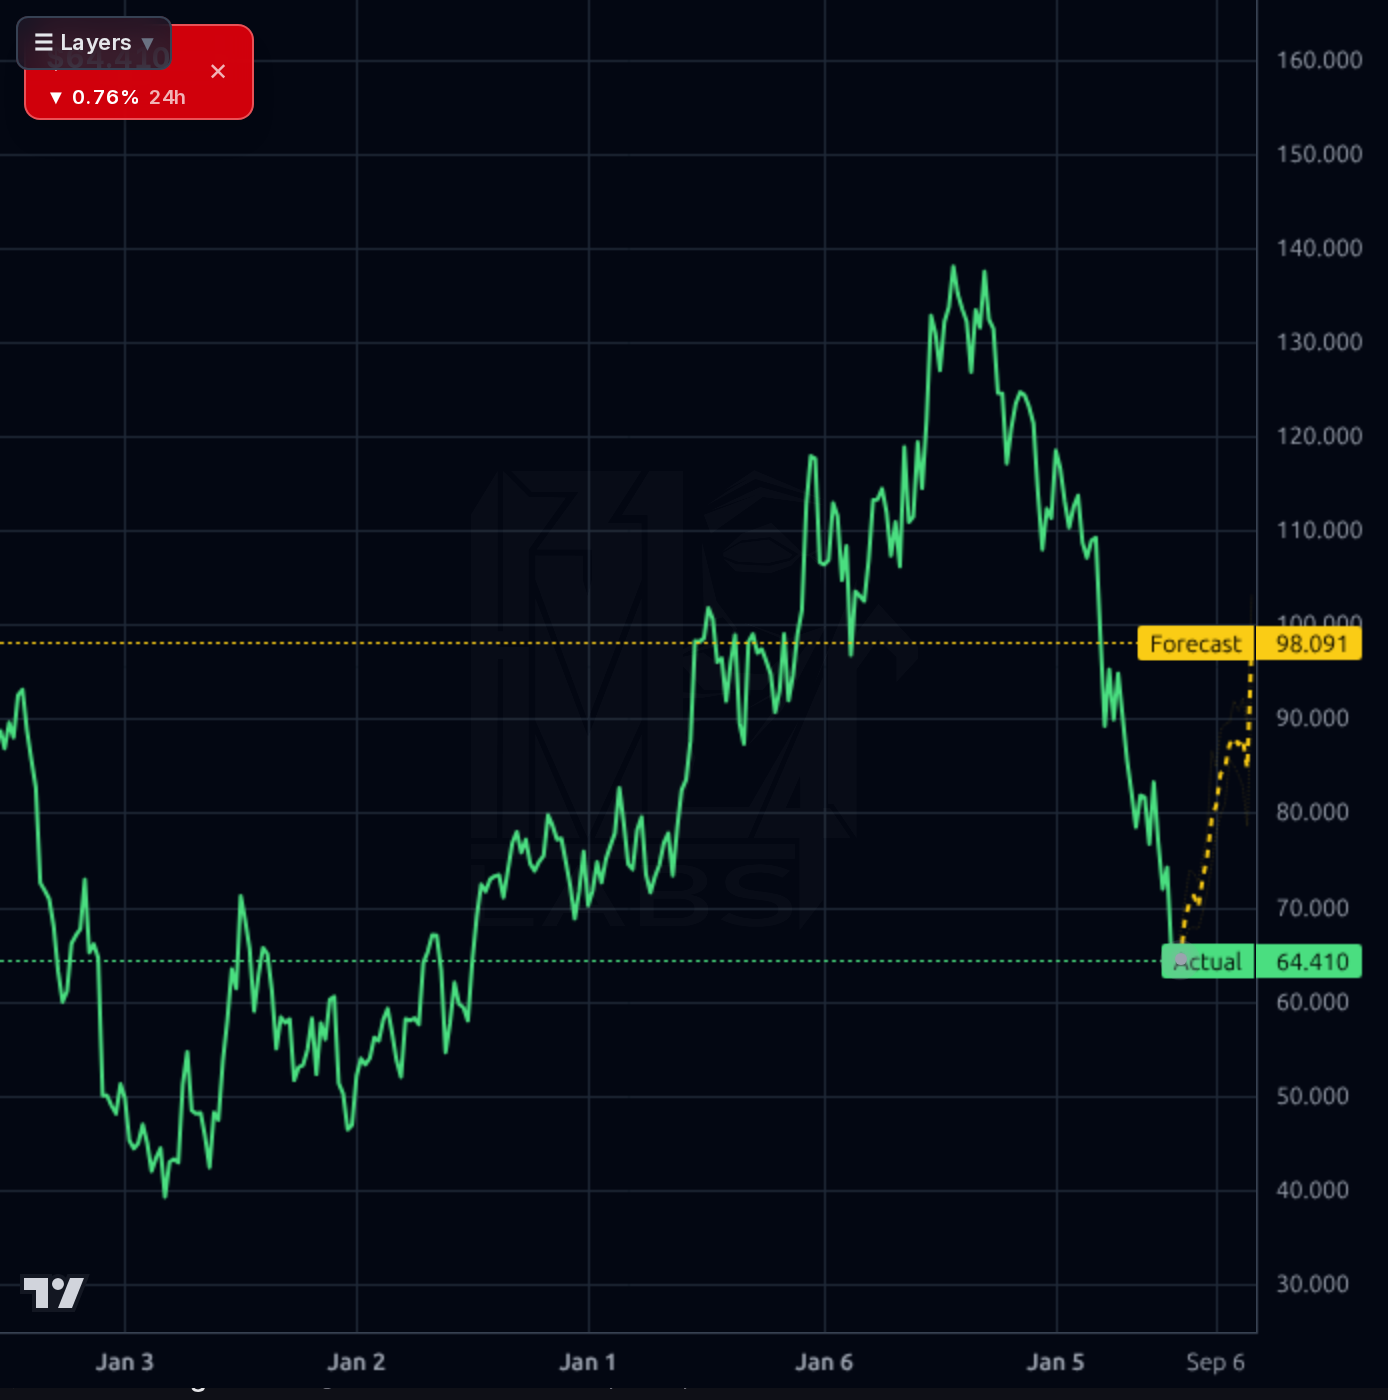
Maintain staged accumulation near established support levels ($60-$63). A decisive break below $60 invalidates immediate buying theses; a bounce toward $70-72 tests critical resistance and requires confirmation of reversal momentum before increasing size.
The thesis remains that the stock is undervalued based on its resilient P&L and strong balance sheet, making staged accumulation appropriate. The next major catalyst to watch is the August 27 earnings report for management commentary on margin stability and unit growth guidance.
The long-term driver is the structural advantage of being a closeout retailer benefiting from cyclical inventory oversupply in other sectors. The primary risk remains sustained sector derating or competitive pressure that erodes margins.
The company exhibits strong operational health with a Gross Margin consistently in the 39-42% range and reported TTM sales growth of 16.7%. The balance sheet remains robust, evidenced by a Current Ratio of 2.32 and low long-term debt relative to equity (LT D/E of 0.32). Quarterly financials show positive cash flow generation, with the most recent quarter reporting $45.5M in operating cash flow. While the forward P/E of 12.6x suggests value, the high Debt/Equity ratio (37.58) warrants caution regarding leverage management.
The stock is clearly in a technical downtrend, trading significantly below its 50-day (-18.55%) and 200-day SMA (-38.77%). The chart shows the price action has been characterized by heavy selling pressure leading to oversold conditions (RSI at 32.42). Key resistance levels are anchored by the recent JPM downgrade target of $70, while support appears structurally important around the $60-$61 zone; a break below this would signal further downside risk.
The prevailing news narrative centers on OLLI being technically oversold and ripe for a turnaround, supported by positive same-store sales data. However, this bullish sentiment is counterbalanced by significant negative catalysts, notably the JPMorgan downgrade to Neutral with a price target cut from $152 to $70. The market appears to be pricing in these downgrades more heavily than the underlying operational strength.
- Resilient Gross Margins: Maintaining 39-42% gross margins, supported by the sourcing tailwind from retail bankruptcies, provides a structural advantage.
- Unit Expansion: Double-digit top-line growth (TTM +16.7%) suggests continued physical expansion and market penetration in the discount niche.
- The $70 sell-side anchor set by JPM acts as a strong technical resistance magnet that must be overcome for any significant upward move.
- Extreme negative momentum, evidenced by YTD (-42%) and Year (-50%) performance, suggests deep investor pessimism that could persist despite positive fundamentals.
Get AI analysis on any stock
This is one of hundreds of Kronos AI reports — scored fundamentals & technicals, bull/base/bear price targets, a multi-horizon plan, and continuously-updated forecasts across the market. Create a free account to explore them all.
Create your free account →Already a member? Sign in · Join our Discord