OLLI — AI Stock Forecast & Price Targets
Published 7/10/2026 · A free sample of K3vl4r’s AI-powered analysis.
Kronos price forecasts, scored fundamentals & technicals, and a multi-horizon plan.
View the live OLLI price forecast →
OLLI's operating business remains healthy — 16.7% TTM sales growth, 39-41% gross margin, $250M cash, 13.8% ROE — but the stock has decoupled from fundamentals, collapsing to $63.72 (-42% YTD, -50% YoY) after a JPMorgan downgrade to Neutral with PT slashed from $152 to $70. With RSI 32, price 38.8% below the 200-day SMA, short float rising to 10.6%, and the AI forecast model beaten by the naive baseline (17% vs 84% directional accuracy), the setup argues for patient staged accumulation rather than heroic bottom-calling.
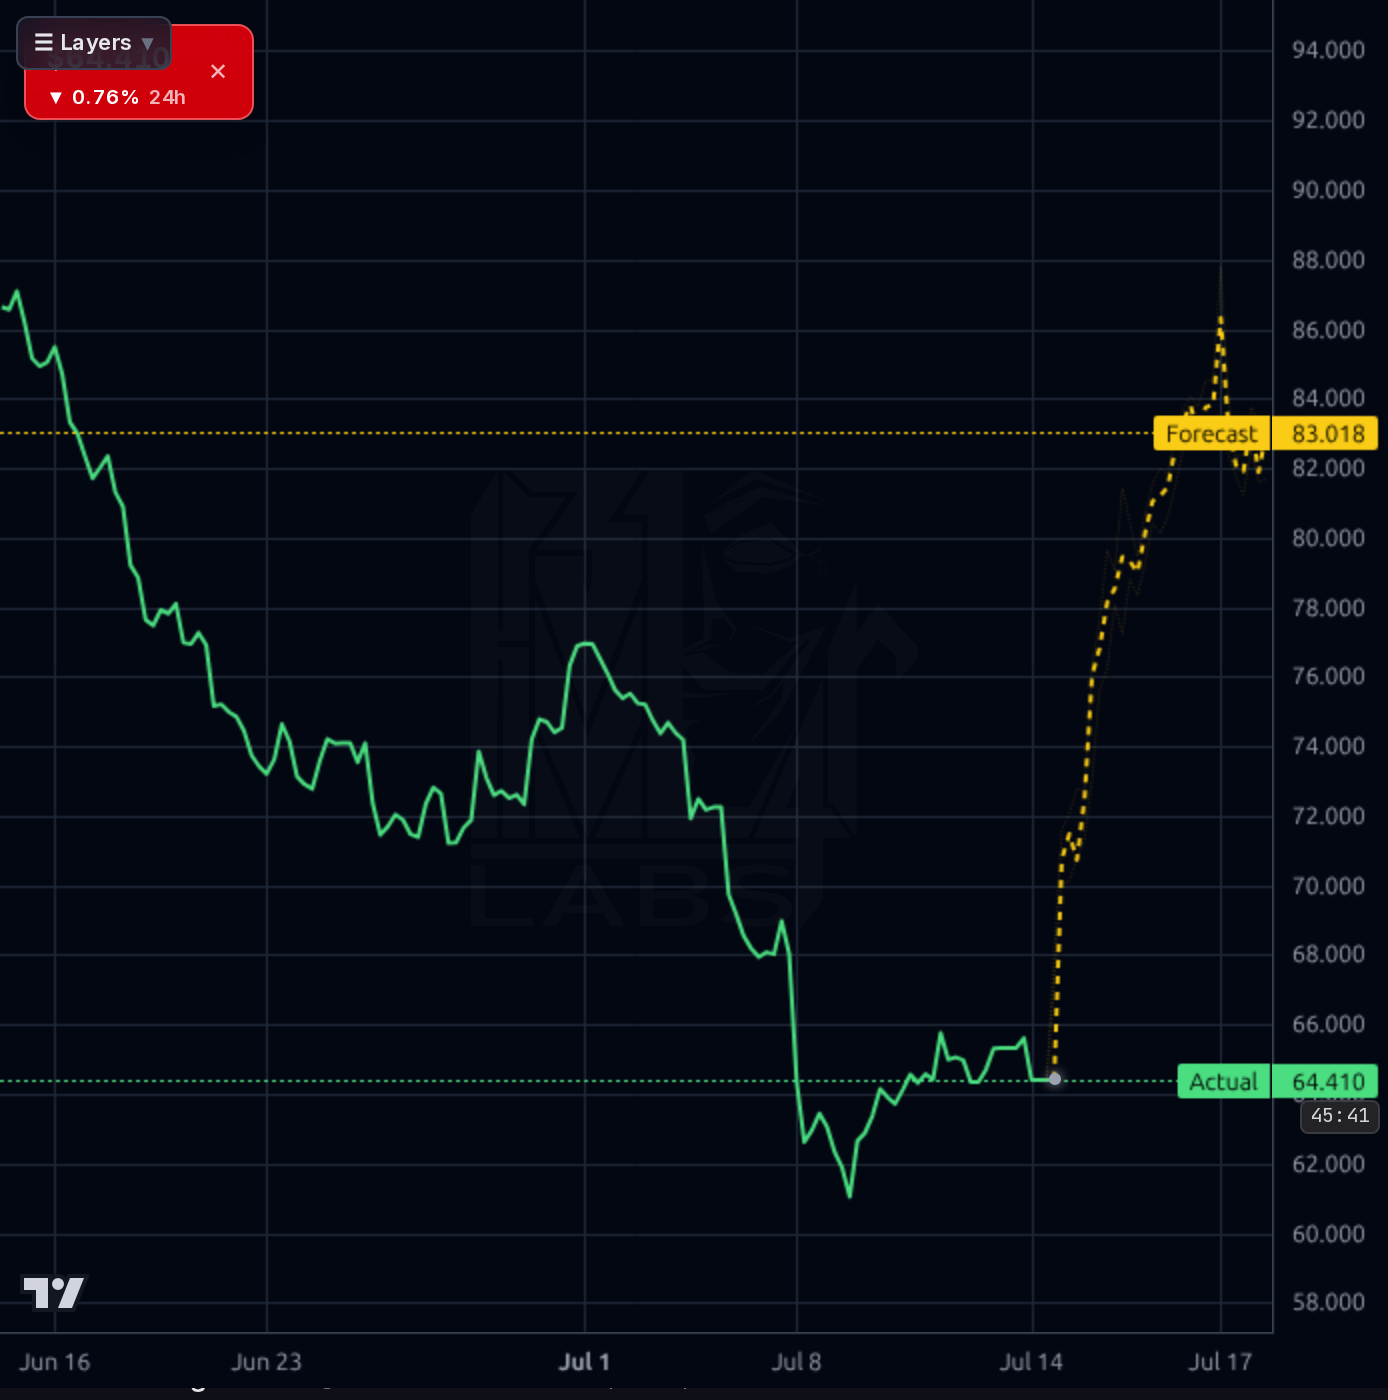
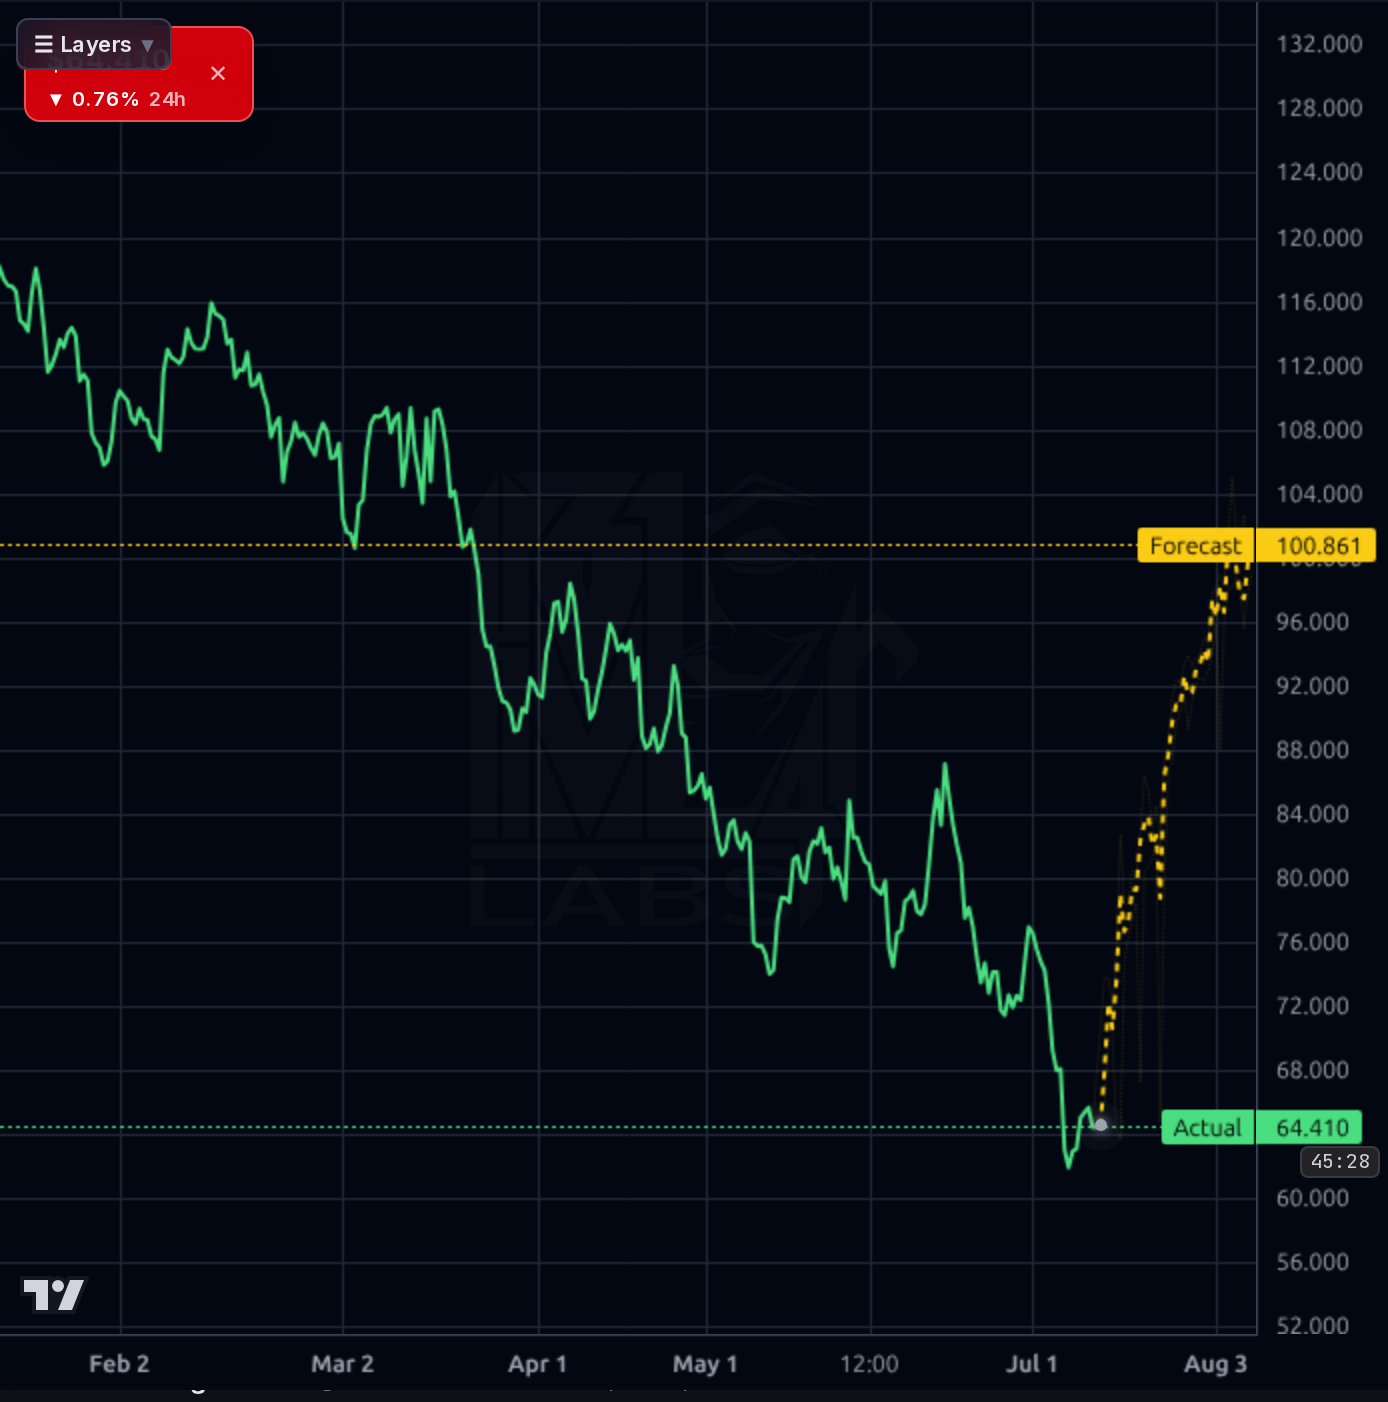
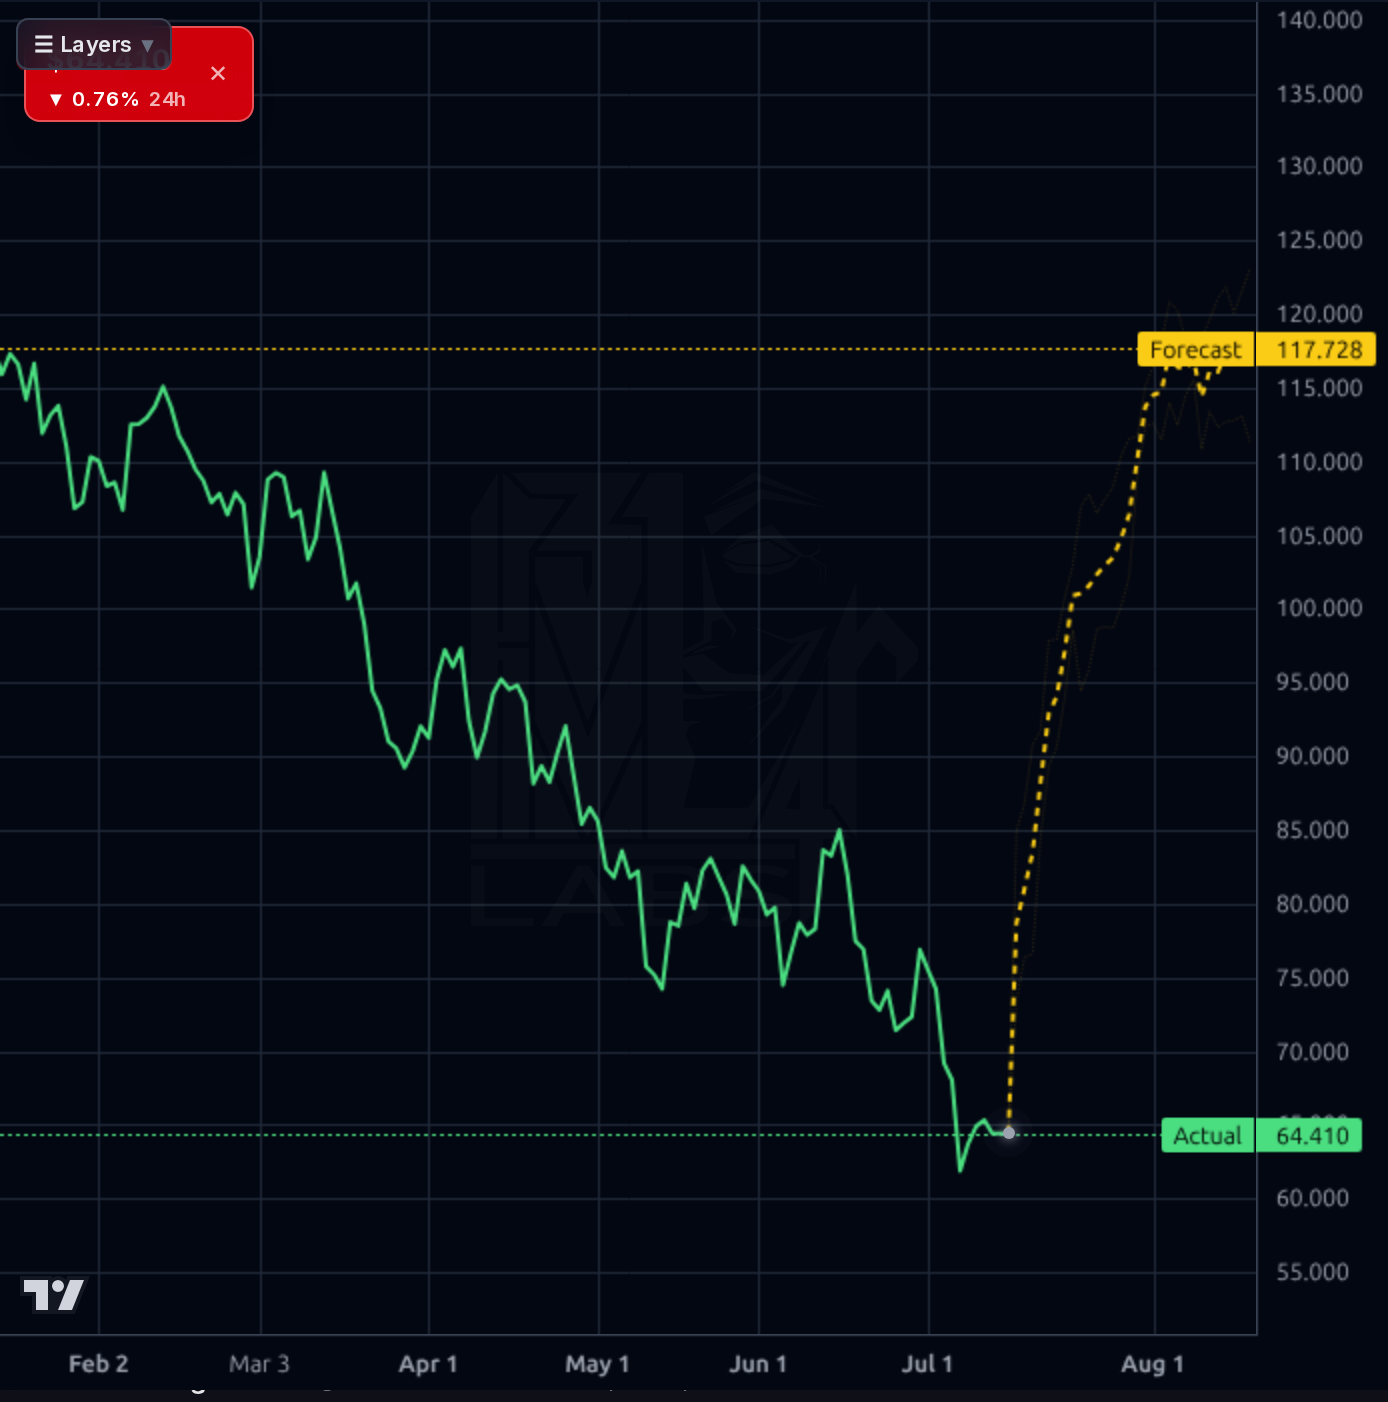
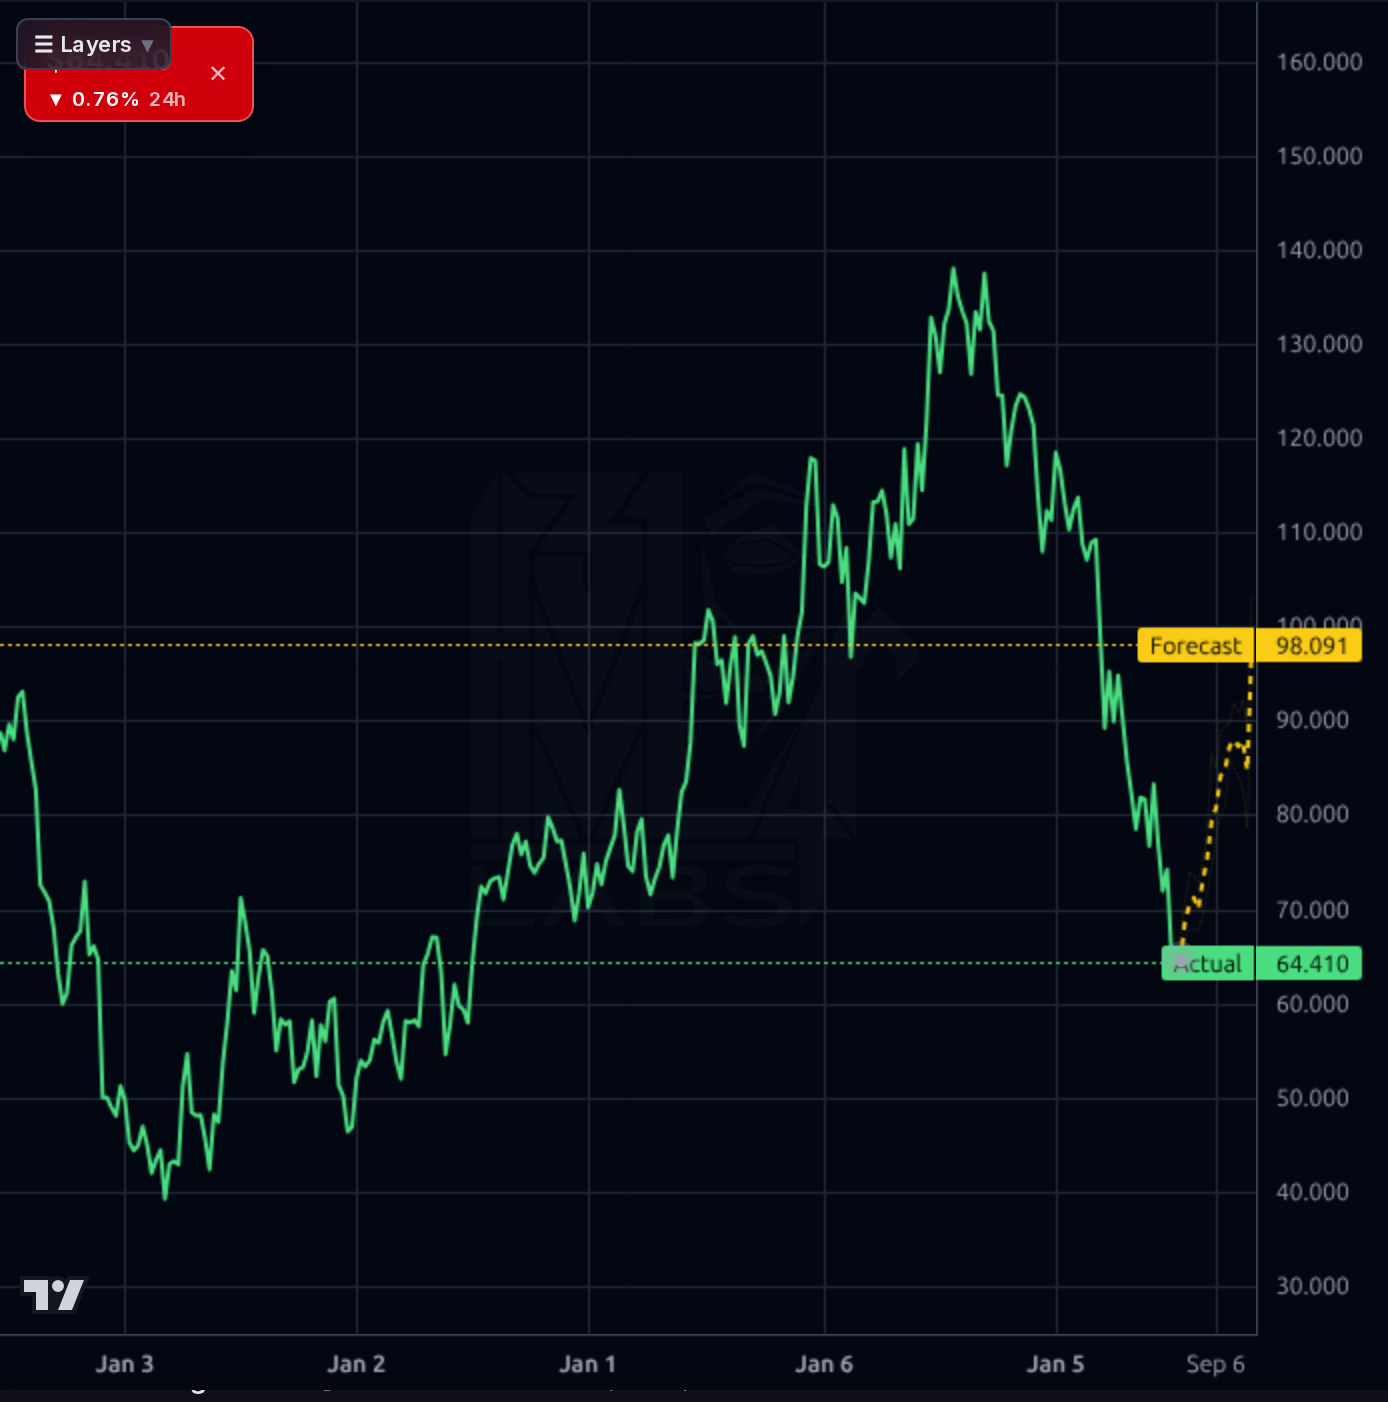
Do nothing aggressive in the next 1-4 weeks. Price is trying to base at $60-64 after a violent JPM-driven flush, but the tape has produced six failed bounces already and the AI forecast is unreliable here. Small starter tranche (10-20% of intended position) only on a hold of $60 with a close back above $66 (recovering the recent gap). Invalidation: a daily close below $58 opens $50-55 and forces a stop. Do not chase strength above $72 without volume confirmation — that is the JPM PT and likely a supply zone.
1-6 months is anchored on the August 27 earnings print. If comps hold positive, gross margin stays 39%+, and management reaffirms unit growth, the stock should re-rate off the 12.6x forward multiple toward 15-17x on $5.07 forward EPS ($76-86). Expected range from current $63.72: base $75 (+18%), bull $90 (+41%) on a sentiment reset plus short cover (10.6% float), bear $52 (-18%) if comps decelerate or margins compress. Add a second tranche only on either (a) a reclaim of the 50-day SMA around $78, or (b) a post-earnings gap that holds. What changes my mind: any evidence of comp deceleration below +2%, gross margin compression below 38%, or a second desk downgrade following JPM.
1-3 year thesis remains intact: closeout retail is counter-cyclically well-positioned in a retail-bankruptcy environment; Ollie's has a durable sourcing moat, 39-41% gross margins that peers can't replicate, disciplined unit expansion economics, and a growing loyalty program (Ollie's Army). At current $3.85B market cap on $2.73B sales and ~$250M net income, the market is pricing in a durable deceleration that the numbers don't yet support. Terminal fair value on a normalized 18-20x multiple against $6-7 EPS in 2-3 years supports $110-140. Biggest structural risk: mass-market discounters (Walmart, TJX, Five Below) encroaching on the closeout niche, plus execution risk on new-store productivity as the base grows.
The P&L is not broken. Q1 FY26 (April) revenue of $658.9M carried a 41.9% gross margin and 11.5% operating margin, with net income of $56.4M and TTM sales up 16.7% Y/Y. Trailing metrics — 39.1% gross margin, 12.3% operating margin, 13.8% ROE, 10.0% ROIC, 9.1% net margin — are consistent with a well-run closeout retailer benefiting from the 2025-2026 retail bankruptcy cycle providing cheap inventory. The balance sheet is a fortress relative to peers: $197.7M cash, 2.32 current ratio, LT debt/equity 0.32, and $1.89B stockholders' equity. Free cash flow of $135.8M TTM is real but lumpy quarter to quarter (Q1 FCF only $20M vs. $164M in Q4). Capital allocation is reinvestment-focused (no dividend, capex funding new-store expansion), with EPS growth 24.4% Y/Y TTM and forward EPS of $5.07 implying a 12.6x forward P/E — cheap versus history and the 15.7 trailing multiple. Nothing in the reported numbers signals structural breakage; the issue is that the market is pricing in a forward-looking margin/comp deceleration that hasn't yet shown up.
The tape is severely damaged across all timeframes. Weekly chart shows a completed distribution top from ~$141 with price now testing a multi-year uptrend base near $60-64. Daily shows a waterfall decline through the 200-day SMA (price -38.8% below it) with only nascent stabilization above the $61.61 52-week low. 4H and 1H show a capitulation low around $60 with a modest bounce to $63.72 (+2.97% on the session, RelVol 2.24x) — the first sign of demand at a level that matters. RSI 32.4 is oversold but not classically washed out; SMA20 -14.6% and SMA50 -18.6% confirm price is stretched. The Kronos AI forecast bands are aggressively bullish on 1h/4h/daily/weekly timeframes (weekly projecting toward $90+), but the model's own realized directional accuracy is 17% versus an 84% naive baseline — it is systematically wrong on this name in this regime, and its bullish signal should be heavily discounted rather than acted upon. Key levels: support $60-61 (must hold), $55 (bear scenario floor); resistance $70-72 (JPM's new PT, likely magnet), $82 (50-day area), $92-95 (200-day). Six consecutive prior calls have been directionally flat-to-wrong on the upside — the technical regime is not yet turning.
The dominant story is the JPMorgan downgrade from Overweight to Neutral with the PT cut in half from $152 to $70, which triggered the July 8 gap down to a fresh 52-week low and appears to be the proximate cause of the entire recent leg lower. Zacks and Yahoo both frame the stock as technically oversold with a potential turnaround setup; Barchart makes an explicit contrarian case citing 14.1x forward P/E, positive comps, and Ollie's Army loyalty growth. Separately, an STLA/OLLI/SMR '52-week lows' article ties the move to broader concerns about slowing growth and rising costs — signal that this is partly sector/macro derating, not solely idiosyncratic. Broader market context (oil rally, US-Iran ceasefire jitters, S&P weakness) argues for continued risk-off pressure on discretionary consumer names in the near term. The June 15 8-K was a routine annual meeting vote (Item 5.07), not a fundamental catalyst. Signal: one high-profile downgrade has reset the sell-side anchor; noise: the broader oversold-bounce commentary is premature until the tape confirms.
- New unit expansion continues — TTM sales +16.7% Y/Y and Q/Q sales +14.3% suggest the store growth algorithm is intact despite macro noise
- 2025-2026 retail bankruptcy wave (referenced in prior sector context) providing outsized closeout inventory availability at attractive gross margins (41.9% in Q1 FY26)
- Ollie's Army loyalty program cited as durable comp driver — needs confirmation on August 27 earnings call
- $197.7M cash + $135.8M FCF supports optionality for accelerated unit rollout or buybacks at compressed valuation
- Forward EPS estimate of $5.07 implies +25% growth from trailing $4.04 — analyst consensus (recom 1.44) still models expansion despite the JPM cut
- JPMorgan PT cut from $152 to $70 sets a new sell-side anchor; follow-on downgrades from other desks would extend the derating
- Short float rose from 8.5% to 10.6% in ~45 days — building bearish conviction into the August 27 print
- Price -38.8% below 200-day SMA and -18.6% below 50-day SMA — technical damage of this magnitude typically requires months of basing before a durable reversal
- AI forecast model has 17% directional accuracy vs. 84% naive baseline on this name — its bullish projection cannot be relied on for sizing
- Consumer discretionary/defensive derating (Perf Y -50%, YTD -41.9%) suggests sector rotation risk that isn't fully resolved
- Competitive encroachment from Walmart, TJX, and Five Below on the closeout niche remains a secular overhang
- Prior 6 calls on this name have averaged +24% optimistic on base targets — my own upside estimates require discounting
Get AI analysis on any stock
This is one of hundreds of Kronos AI reports — scored fundamentals & technicals, bull/base/bear price targets, a multi-horizon plan, and continuously-updated forecasts across the market. Create a free account to explore them all.
Create your free account →Already a member? Sign in · Join our Discord