PAR — AI Stock Forecast & Price Targets
Published 8/7/2026 · A free sample of K3vl4r’s AI-powered analysis.
Kronos price forecasts, scored fundamentals & technicals, and a multi-horizon plan.
View the live PAR price forecast →
PAR Technology just delivered a clean Q2 beat (revenue $133.4M vs $124.6M est, +18.7% Y/Y; non-GAAP EPS $0.18 vs $0.12) and raised full-year sales guidance to $516–523M, validating the top-line reacceleration thesis. However, the stock is still burning cash (Q1'26 FCF -$19.3M, TTM ROE -9.1%), carries $434M of debt, and sits with a 25% short float — so this is a tradable momentum/mean-reversion setup, not yet a durable earnings compounder.
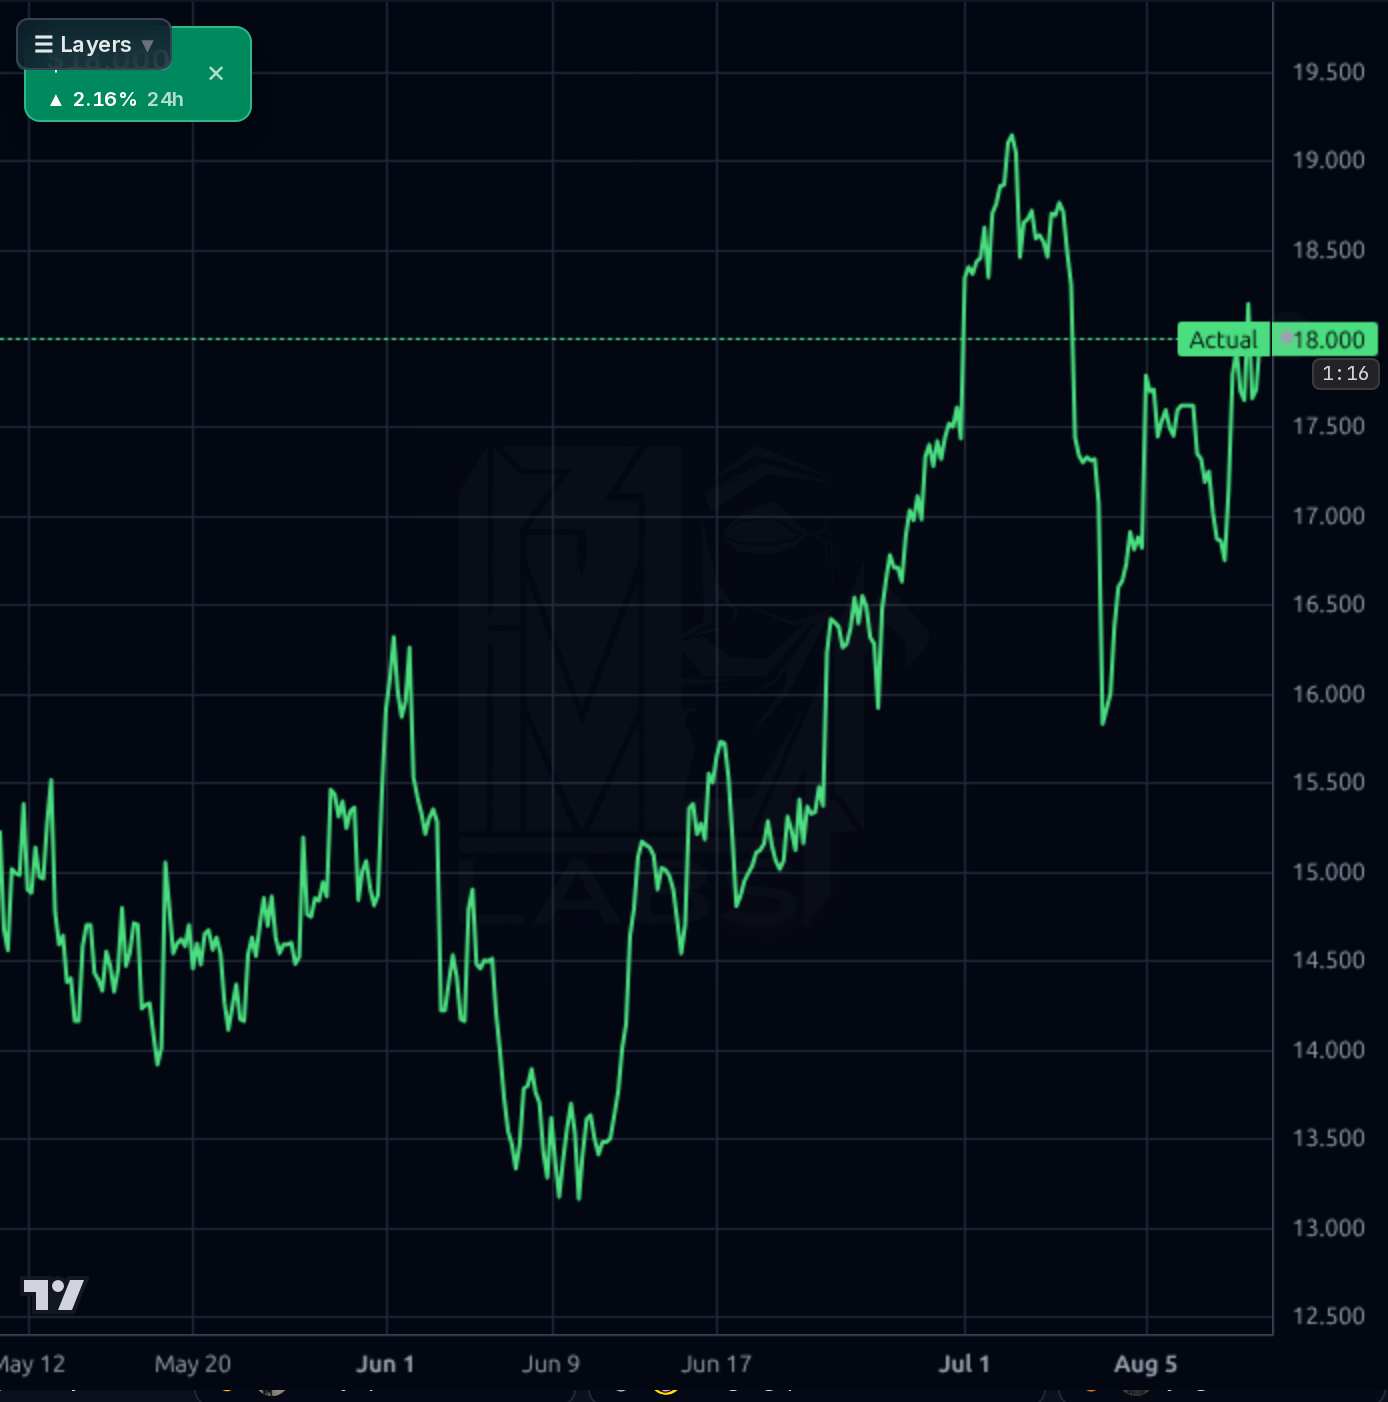
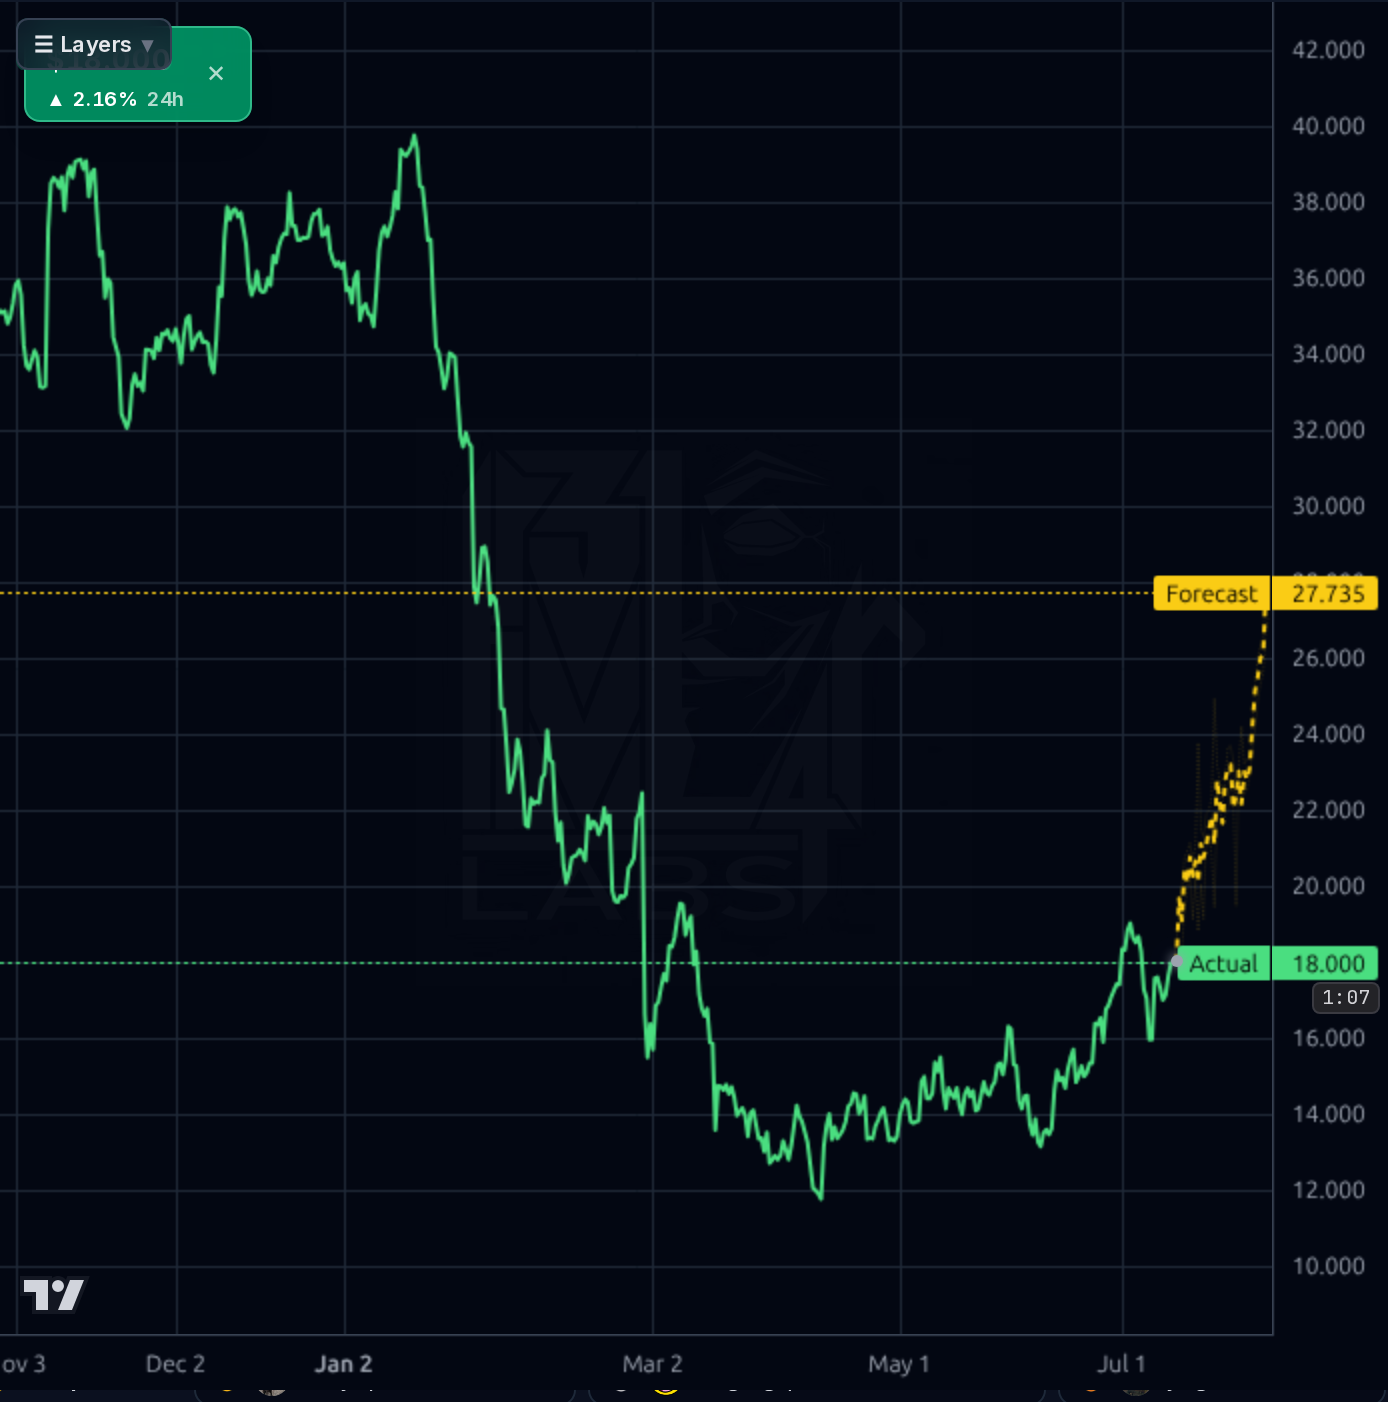
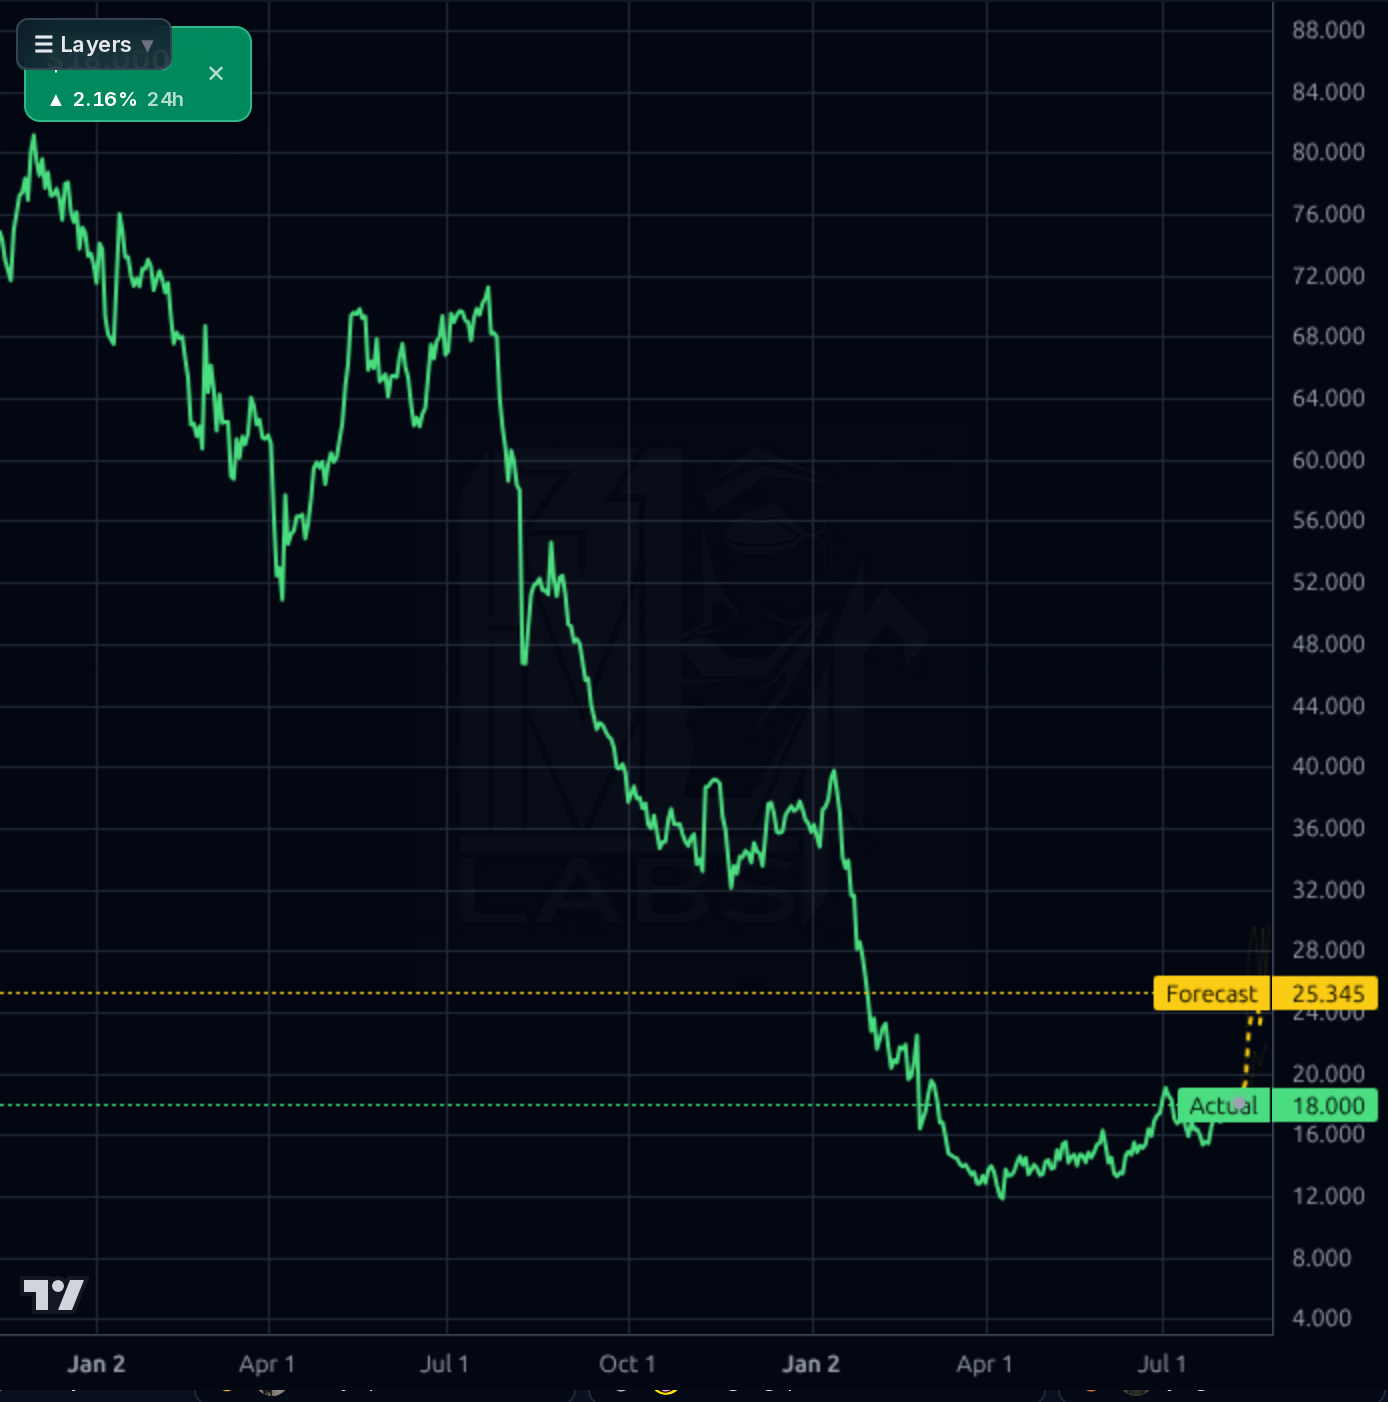
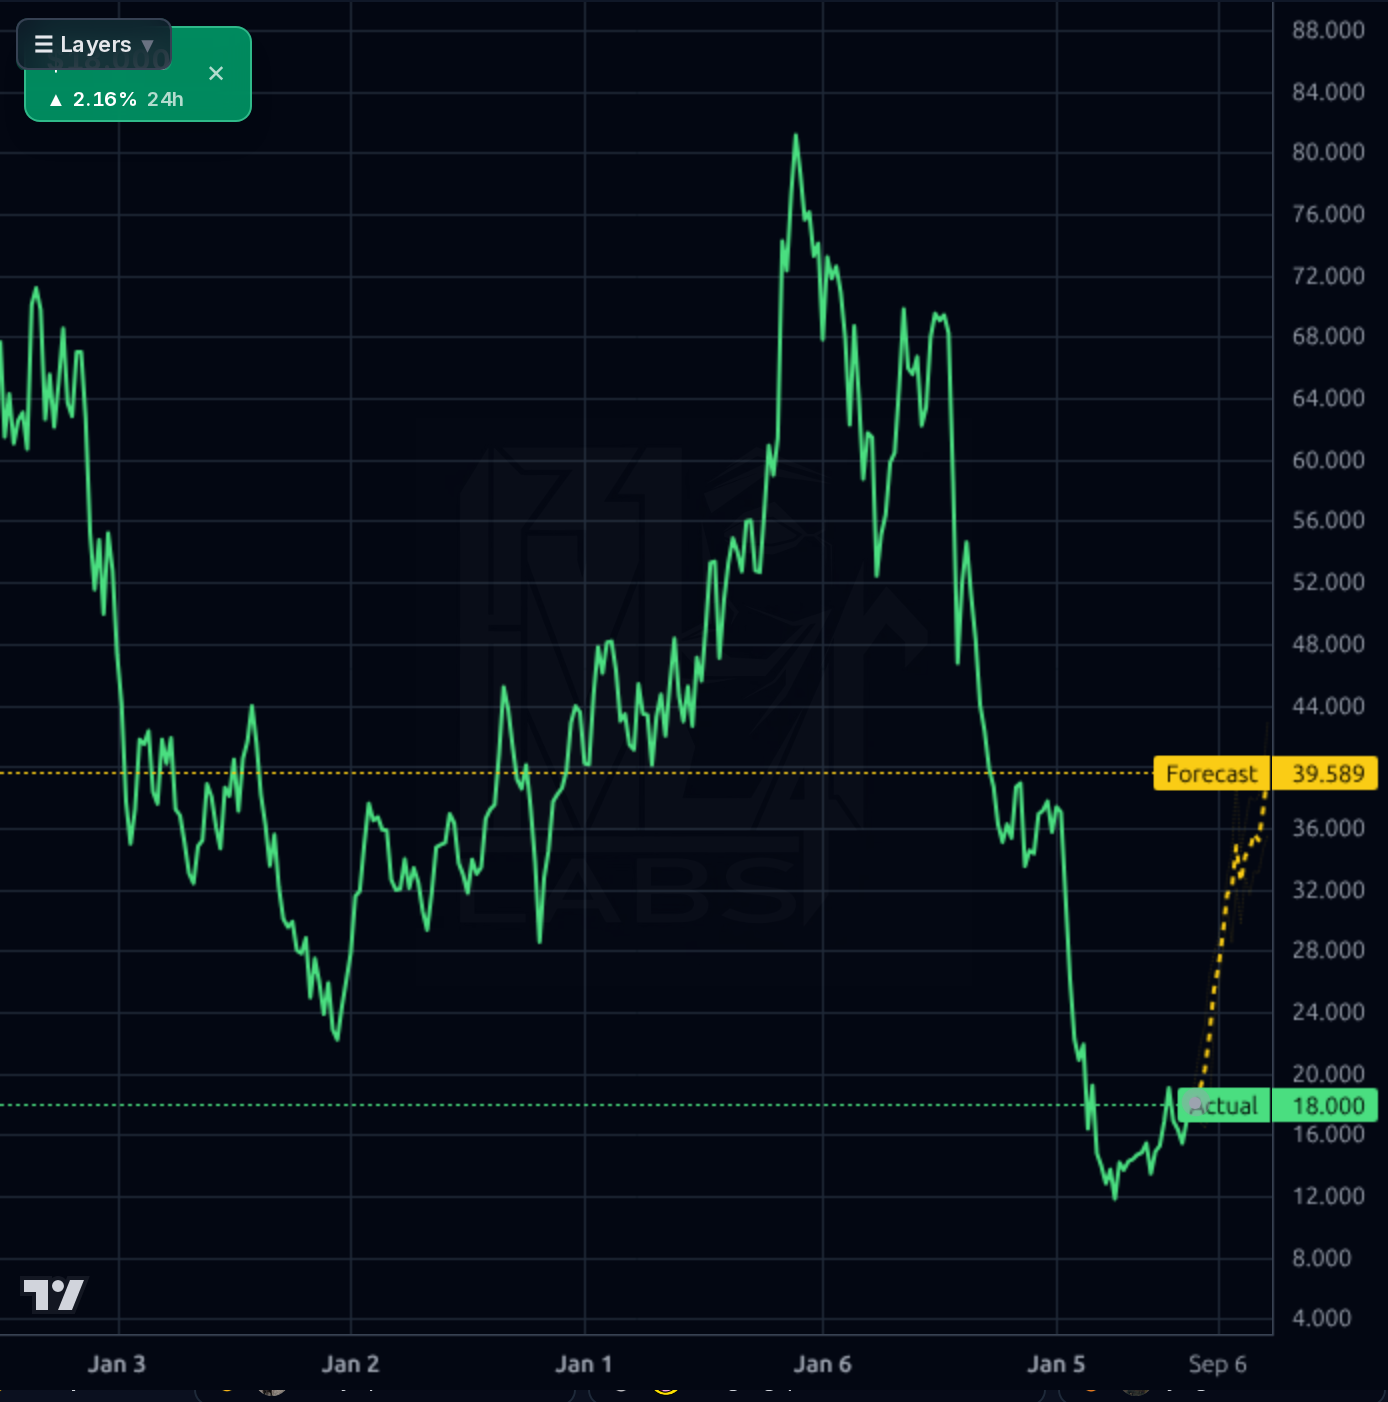
1–4 week view: constructive but not chase-here. Price is at the $17.50–18.00 supply zone directly after a post-earnings gap; wait for either (a) a confirmed daily close above $19.20 to add on breakout continuation toward $21–22, or (b) a pullback to $16.30–16.80 to accumulate. Size: modest starter position now given the fresh earnings beat, add on either trigger. Invalidation: daily close below $15.80 negates the post-earnings breakout and opens $14 retest. The 25% short float and 8.14 days-to-cover create asymmetric upside on any push through $19.20.
1–6 month view: the bull case is that Q3/Q4 continue the margin-improvement trend visible in Q1→Q2 (operating loss narrowed, EBITDA moving toward zero) and that FY26 gets to $520M+ revenue with a credible path to positive operating income in FY27 on the raised guide. Expected return range in base case is $19–22 (+10 to +30%) into the Nov 5 next print. What would change my mind: (i) Q3 print showing operating margin re-widening or FCF still deeply negative; (ii) analyst downward EPS revisions; (iii) failure to hold $15.80 despite the earnings beat.
1–3 year view: PAR is trying to complete the transition from a hardware-centric point-of-sale vendor to a SaaS/hybrid restaurant tech platform (Punchh loyalty, PAR POS, PAR Ordering, PLEXURE engagement). If ARR mix continues to shift and the recent revenue reacceleration (Sales Y/Y TTM +23.9%) sustains, a 3.5–4.5x EV/sales multiple on ~$700M FY28 revenue supports a $30+ equity value. Structural risks: (i) restaurant-tech is intensely competitive (Toast, Square, Olo, Lightspeed) and PAR has consistently lost money for years — Perf 5Y is -72.6%; (ii) $434M debt load requires the operating model to work; (iii) execution risk on integrating multiple acquired platforms (Punchh, Delaget, TASK, Stuzo).
Revenue trend is the clear bull point: quarterly sales climbed from $112.4M (Q2'25) → $119.2M → $120.1M → $124.0M (Q1'26) → $133.4M (Q2'26 just reported), with the company now guiding FY26 to $516–523M (up from $500–515M) and Q3 to $128–132M. Gross margins are healthy at ~44% but operating margins remain deeply negative (-11.9% TTM; Q1'26 operating loss of -$13.9M, net loss -$16.2M) and EBITDA is still negative (Q1 -$0.7M, improving from -$6.3M a year ago). Cash flow quality is weak — Q1'26 operating cash flow -$16.6M, FCF -$19.3M — though this partly reflects working-capital timing; TTM FCF is barely positive at $1.2M. Balance sheet is adequate but not pristine: $77.2M cash vs $433.8M debt (D/E 0.52), current ratio 2.10, book value $20/share (P/B 0.85, one of the few valuation supports). The narrative that matters: margins are trending in the right direction (Q1'26 operating loss narrowed to -11.2% from -15.4% a year prior) and this quarter's EPS beat suggests operating leverage is finally showing. Structural profitability is still broken, but the delta is improving fast.
The 1h and 4h charts show a clean impulsive rally from the June 9 low near $13.20 to the July 1 high near $19.20, then a consolidation/pullback to ~$15.80 on Aug 3–4 before a sharp post-earnings rebound back to $17.12–18.00. Price is now sitting right at horizontal resistance / prior support around $17.50–$18.00, with the next resistance zone at the July highs of $19.00–19.20. Support stacks at $16.50, then $15.80 (recent swing low), then the 200-day area which is far below (SMA200 distance -25.5%). Momentum is constructive: SMA20 +2.9%, SMA50 +6.4%, RSI 54 (room to run before overbought), Perf Quarter +23.6%. The model's forecast bands are aggressively bullish across all timeframes ($27.7 on the 4h, $25.3 on the 1d, $39.6 on the 1wk) — but the model's directional accuracy at 60% actually underperforms the naive baseline (63%) on 1d, so those price levels should be heavily discounted; treat the direction as a mild positive signal, not the magnitude. Prior similar setups on this name have shown bounce power but also fade risk once resistance is hit.
The signal-dominant news is the Aug 6 Q2'26 print: revenue $133.4M (+18.7% Y/Y, beat by 7%), non-GAAP EPS $0.18 (beat by ~64%), Q3 guide $128–132M (above $128.4M consensus), and FY26 guide raised to $516–523M vs $509.5M consensus. GuruFocus highlights 'record revenue' and 'AI-driven platform adoption' as the qualitative drivers, and StockStory notes the full-year outlook exceeds expectations. This is a fundamentally positive catalyst that materially validates the reacceleration story and is the reason the stock gapped up. Noise: the Paramount/WBD 'PAR' headlines in the news feed are ticker-collision items (that's Paramount Skydance, not PAR Technology) and should be ignored. Broader market context (SPY late markup, cyclical leadership, breadth improving) is a mild tailwind for a small-cap tech reacceleration story but doesn't change the security-specific setup.
- Q2'26 revenue $133.4M (+18.7% Y/Y) with FY26 guide raised to $516–523M — organic reacceleration validated
- Non-GAAP EPS $0.18 (+500% Y/Y from $0.03) demonstrates emerging operating leverage; EBITDA trajectory improved from -$6.3M to -$0.7M sequentially
- AI-driven platform adoption cited as demand driver in Q2 earnings call — supports SaaS mix shift and higher-value ARR
- Bolla Oil partnership and continued C-store expansion (PAR RETAIL, formerly Stuzo) opening a second vertical beyond restaurants
- Forward EPS estimate of $1.22 (fwd P/E ~14) implies analysts model a swing to material profitability in the next 12 months
- Analyst recommendation 1.44 (strong-buy cluster) with $26.81 mean price target (~+57% upside)
- Persistent GAAP losses: TTM net income -$76M, Q1'26 net loss -$16M; company has not yet demonstrated a sustained profitable quarter
- Free cash flow negative in 3 of last 4 quarters (Q1'26 FCF -$19.3M); balance-sheet flexibility narrows if this continues
- $433.8M total debt vs $77.2M cash — leverage becomes material if revenue growth decelerates
- 25.13% short float / 8.14 days-to-cover — creates upside squeeze potential but also signals significant informed skepticism
- SMA200 -25.5% and Perf Year -70.7% — the stock is still in a longer-term downtrend and a failed breakout could see rapid downside
- Model's 1d directional accuracy (60%) is below the naive baseline (63%) — its aggressive upside forecast should be heavily discounted
- Institutional ownership shown at 123.5% is an artifact of heavy short interest; ownership crowding cuts both ways
- Competitive intensity from Toast, Square/Block, Olo, Lightspeed in restaurant SaaS
Get AI analysis on any stock
This is one of hundreds of Kronos AI reports — scored fundamentals & technicals, bull/base/bear price targets, a multi-horizon plan, and continuously-updated forecasts across the market. Create a free account to explore them all.
Create your free account →Already a member? Sign in · Join our Discord