PDD — AI Stock Forecast & Price Targets
Published 7/29/2026 · A free sample of K3vl4r’s AI-powered analysis.
Kronos price forecasts, scored fundamentals & technicals, and a multi-horizon plan.
View the live PDD price forecast →
PDD trades at 6.9x forward earnings with a $123B cash fortress and best-in-class margins (56% GM, 25% ROE), but multi-quarter operating margin compression (24.8%→21.1%→18.4%) and stalled price action at $85-86 resistance keep this a deep-value/broken-momentum setup. The August 25 Q2 print is the binary catalyst — margin stabilization above 18.4% unlocks re-rating toward $95+, while a fourth step-down invalidates the thesis and risks a retest of the $75-80 floor.
Hold existing position — do NOT add into $85-86 resistance which has repeatedly capped price. The August 25 earnings print is ~27 days out and is a binary event; sizing a new swing trade into it is inappropriate. If a pre-earnings dip to $80-82 materializes, that's a legitimate add zone with the $75 floor as invalidation. Immediate invalidation of the constructive setup: a decisive break below $78 on volume. Upside cap pre-print: $90-92; do not chase above unless a clean breakout on above-average volume prints. Explicit earnings stance: HOLD THROUGH THE PRINT at current size — do not initiate or trim purely on price action into it.
Base case is that Q2 shows the first sequential margin stabilization (18.4% floor holds or ticks up modestly), triggering a re-rating toward $95-100 over 3-6 months — a ~11-17% return. Bull case ($115) requires both margin stabilization AND a credible capital return announcement or Temu unit-economics breakthrough, which is not currently telegraphed. Bear case ($70) plays out if operating margin steps down a fourth consecutive quarter (below 18.4%), reopening the $75 support test and potentially breaking to the low 70s where the 52-wk low sits at $71.94. What changes my mind: (a) any signal that Temu subsidy losses are widening, (b) fresh regulatory action (EU DSA precedent, US de minimis rule changes), or (c) a fifth consecutive OM step-down.
Terminal thesis rests on Temu's ability to convert market share into sustainable operating margins in the 15-20% range post-subsidy — that would translate the current $442B revenue base into RMB 65-90B of operating profit and easily justify $130-160+ per share on any reasonable multiple. Multi-year drivers: international category expansion, potential capital return event that unlocks the trapped $123B cash discount, and normalization of China e-commerce competitive intensity. Biggest structural risk is regulatory: ADR listing overhang, US import de minimis rule changes that break Temu's cost model, and any escalation of EU/US enforcement against low-cost Chinese platforms. Secondary risk is that the trapped-capital discount persists indefinitely because management continues to prioritize reinvestment over shareholder returns.
PDD's fundamentals remain elite on absolute metrics but show clear deterioration on the margin: TTM revenue of RMB 442B with 56% gross margin, 22% operating margin, and 25% ROE would be top-quartile in any sector. The balance sheet is a fortress — RMB 436B cash / RMB 5B debt / RMB 423B equity, translating to ~$52/share of net cash on an $86 stock. Operating cash flow of RMB 108B and FCF of RMB 72B TTM anchor the valuation floor. However, the quarterly trend is the crux of the bear case: operating margins have stepped down four consecutive quarters (24.8% Q2'25 → 23.1% Q3'25 → 21.1% Q4'25 → 18.4% Q1'26), and Q1'26 net income of RMB 12.5B was less than half the RMB 30.8B run-rate from a year ago (net margin 11.8% vs 29.6%). The trapped-capital problem persists — no dividend, no buyback disclosed, meaning the massive cash pile earns a persistent discount. At 6.9x forward P/E and 0.78x EV/Sales, valuation prices in continued margin compression; the setup is asymmetric to the upside IF Q2 stabilizes.
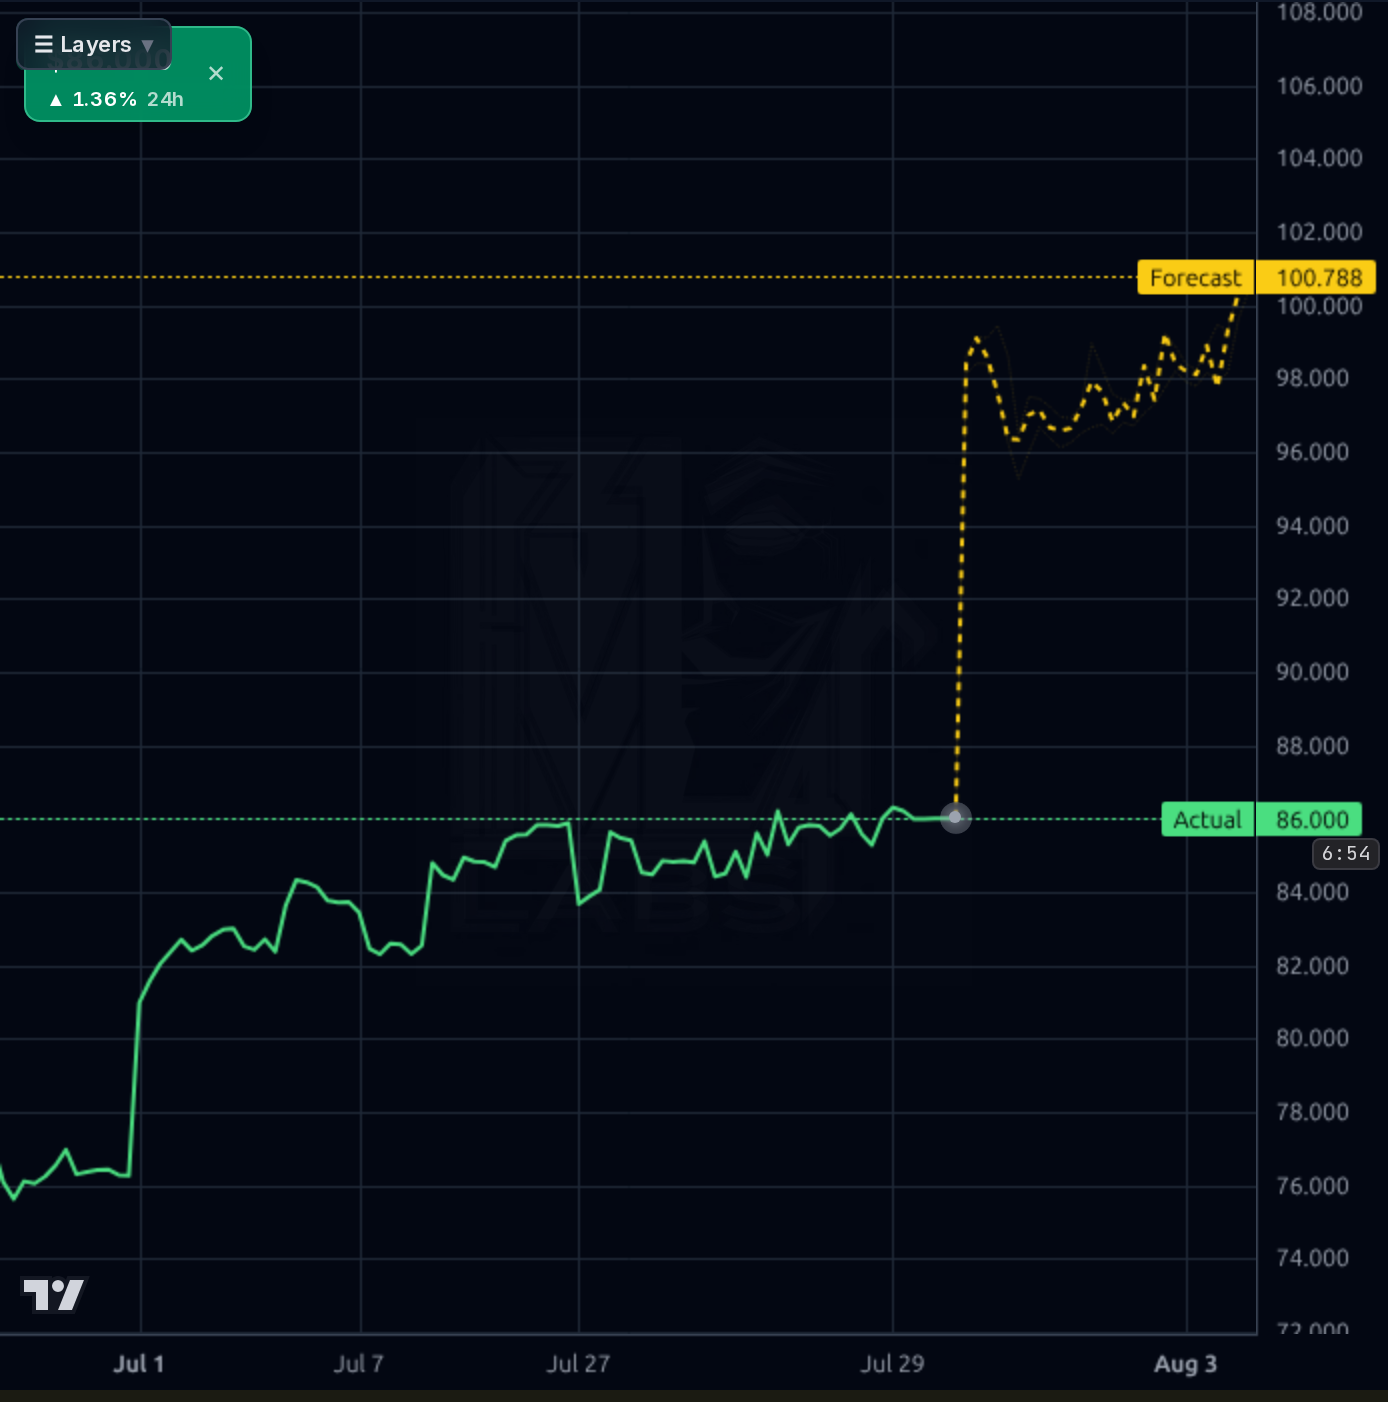
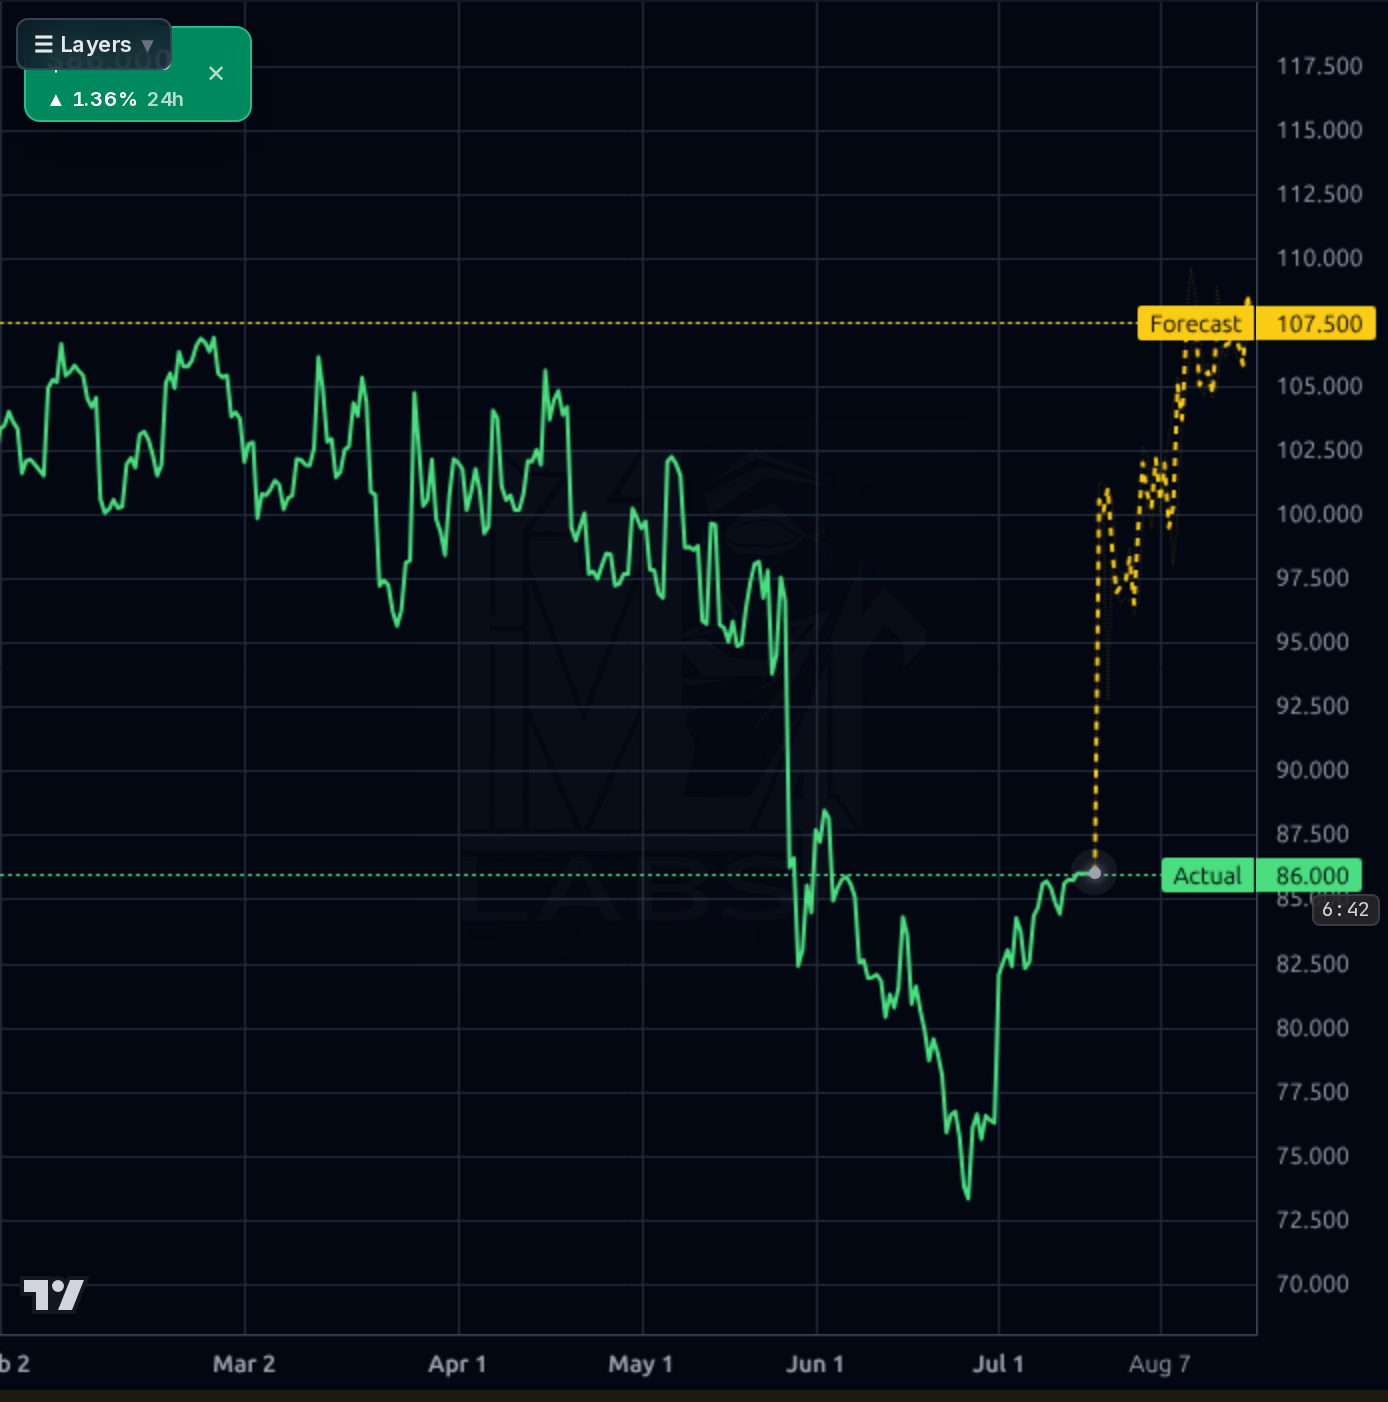
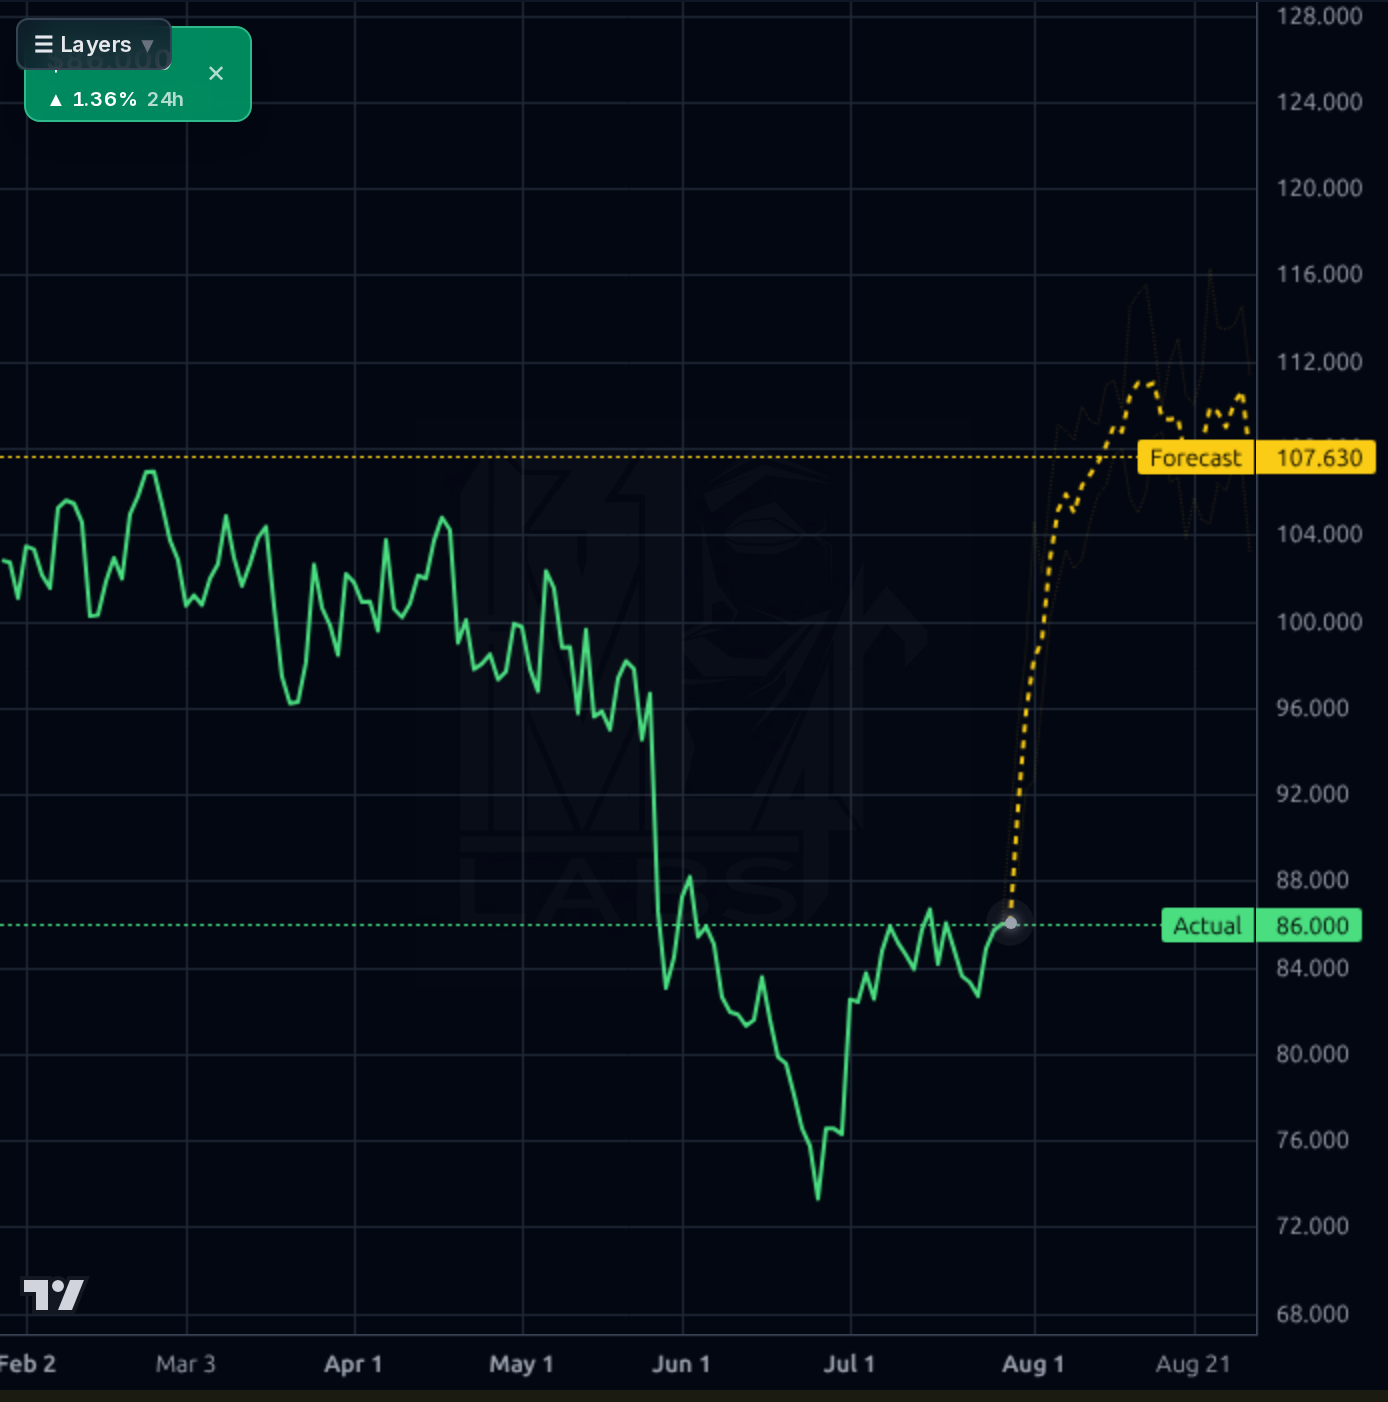
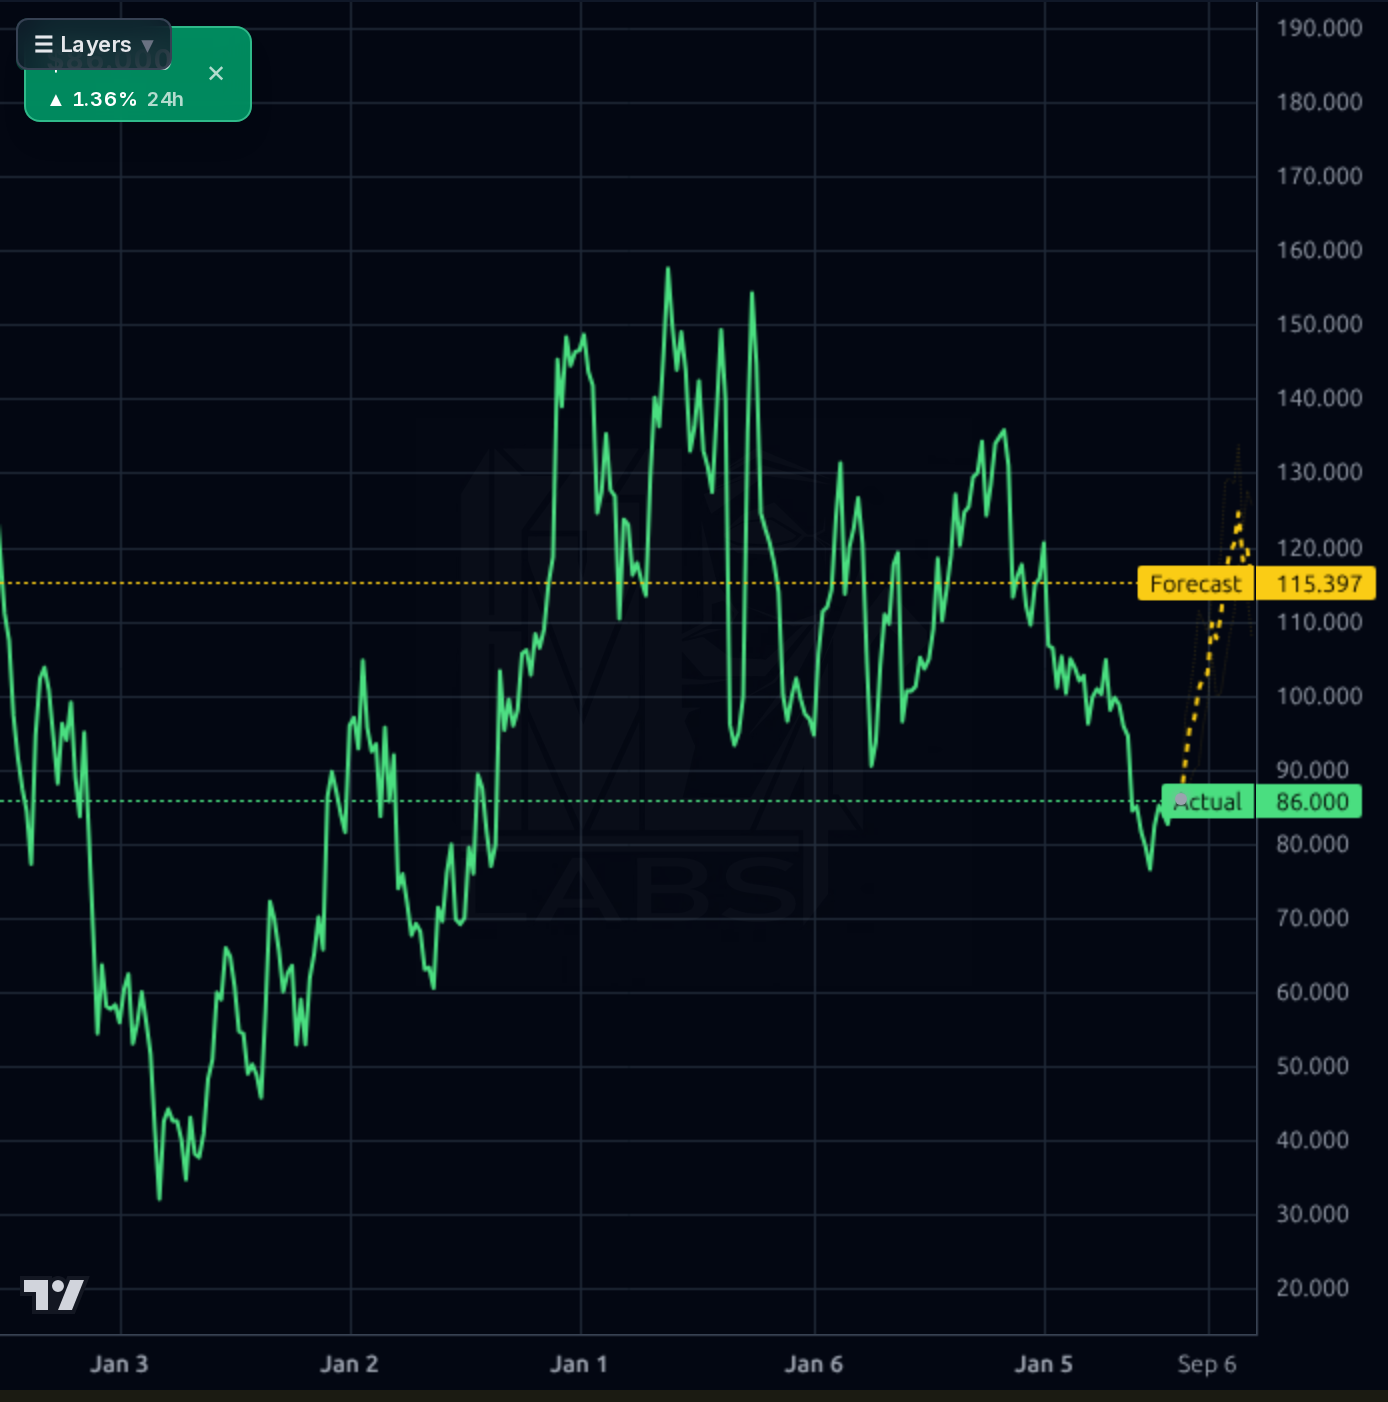
Across timeframes, PDD is in a shallow recovery off the July 73 low but is stalling directly at prior resistance. On the 1h chart, price has grinded from ~76 to 86 through July with the forecast band projecting continuation toward $100 — but the calibration data shows this model systematically overshoots on this name (MAPE 21% at 1d, forecast unreliable at 1d with 59% directional accuracy equal to naive). The 4h chart shows the June-July downtrend from 105 broken but price still ~19% below the 200-day SMA. On the 1d/1wk views, $86 corresponds to the mid-June breakdown level and prior consolidation — a clear supply zone. RSI 54.6, SMA20 +2.1%, SMA50 +1.3%, but SMA200 -17.9% confirms the broken longer-term trend. Key levels: support $80-82 (recent basing), $75-77 (July low / structural floor); resistance $86-88 (current cap), then $92 (must-break for trend change), then $100. The forecast band's 1d bull print $100.8 is aspirational; the 1wk print $107 requires a Q2 beat catalyst to be credible. Momentum is constructive but not yet confirmed.
Signal: recent coverage is dominated by a value-recognition narrative — Zacks and ChartMill flagged PDD as a 'deeply undervalued value stock with zero debt and strong profitability' (P/E 7.96 cited, though live is 9.3x). Options traders are showing elevated activity ahead of the August 25 print. The Citi price target cut from $142 to $123 in mid-June is stale but represents the reset in sell-side expectations following Q1's earnings miss. Consensus target remains $117 (Recom 1.93 = buy), implying ~37% upside if the model is right on stabilization. Noise: broader tape items (Fed meeting, Houthi Red Sea, BTC volumes) are macro backdrop, not stock-specific. Retail sentiment is 89% bullish across a small sample — modestly contrarian caution but not extreme. The pivotal item not in headlines is the August 25 Q2 print itself: analyst commentary and any leaked GMV/Temu subsidy data between now and then will drive positioning.
- Temu global expansion — now operating in >40 countries with a low-cost model driving GMV growth, per DBS/business model analysis
- Q1'26 revenue growth of +11% YoY (RMB 106B) with sales past 3Y CAGR of 45.8% — top-line engine still working even as margins compress
- August 25 Q2 print is the near-term catalyst — margin stabilization above 18.4% OM trough is the single binary that unlocks re-rating
- $123B cash pile (roughly 40% of market cap) offers optionality for a first-ever buyback or dividend that would trigger immediate re-rating
- Forward EPS consensus $12.20 implies a return to earnings growth off the depressed Q1 base — Q2/Q3 prints will be the proof points
- Fourth consecutive operating margin step-down at August 25 print would invalidate the value thesis and trigger a retest of $75-80
- Temu subsidy runway is finite — if losses widen materially, the international growth vector becomes a valuation drag not a lift
- Regulatory risk on multiple fronts: US de minimis rule changes, EU DSA enforcement, ADR delisting overhang
- Trapped-capital discount is persistent — no announced capital return mechanism means the $123B cash keeps earning a discount
- China competitive intensity from Alibaba and JD.com pressuring domestic GMV and take rates
- Forecast model has 21% MAPE at 1d on this name and no directional edge vs naive baseline — the $100+ forecast band should be discounted heavily
- Q1'26 net margin collapsed to 11.8% from 29.6% YoY — if this becomes the new normal rather than a trough, fair value drops toward $70
Get AI analysis on any stock
This is one of hundreds of Kronos AI reports — scored fundamentals & technicals, bull/base/bear price targets, a multi-horizon plan, and continuously-updated forecasts across the market. Create a free account to explore them all.
Create your free account →Already a member? Sign in · Join our Discord