PDD — AI Stock Forecast & Price Targets
Published 8/7/2026 · A free sample of K3vl4r’s AI-powered analysis.
Kronos price forecasts, scored fundamentals & technicals, and a multi-horizon plan.
View the live PDD price forecast →
PDD trades at 7.4x forward earnings with a $123B cash fortress and best-in-class margins (56% GM, 25% ROE), but four consecutive quarters of operating margin compression (24.8%→18.4%) keep this a deep-value/broken-momentum setup rather than a growth story. Price has recovered to $90.85, reclaiming the $84-88 shelf with constructive momentum (RSI 64, +7.2% MoM), but sits directly under the $92 gap-fill resistance heading into the August 25 Q2 print — a binary catalyst that will validate margin stabilization or trigger a fifth compression quarter.
1-4 week view: HOLD existing positions; DO NOT initiate new size ahead of the August 25 earnings binary event (~18 days). Price is pressing $92 resistance with RSI 64 — momentum favors a test of $92-95 pre-print but any 1-4 week target must treat earnings as invalidation. Trim tactical trading positions into $92-95 strength; accumulate only on pullbacks to $84-86 support with hard invalidation below $82. Explicit earnings stance: NEUTRAL/no-add into the print — the risk/reward of catching a fifth margin-compression quarter is unfavorable given ~30% downside to $75 vs ~10% upside to $100 on a beat.
1-6 month view: ACCUMULATE thesis remains intact. Base case: Q2 print stabilizes or modestly compresses operating margin (holding above 17%), triggering re-rating toward $95-100 as valuation catches up to peers. Bull case: margin re-expansion above 20% + any capital return announcement could push toward $110-115. Bear case: fifth compression quarter + revenue miss retests $75-80 floor. Expected return range: -15% to +15% over 3-6 months, skewed slightly positive given valuation cushion. Change my mind: (1) operating margin below 15% on Q2, (2) revenue growth turning negative, (3) material de minimis policy action, (4) any credible fine/restriction from SAMR or EU DSA.
1-3 year view: The terminal thesis rests on whether Temu can achieve profitable international scale without regulatory neutering. If margins stabilize in the 18-22% range and Temu contributes positive contribution margin by 2027, the current 7-8x forward multiple is a coiled spring — fair value ~$120-140 with capital returns as a kicker. Multi-year drivers: (1) international GMV growth, (2) C2M/supply-chain moat monetization, (3) eventual capital return policy from the $123B cash pile, (4) domestic consumption recovery in China. Biggest structural risk: VIE structure and geopolitical delisting/tariff risk — this is a permanent 20-30% valuation discount vs comparable US peers that may never close.
The fundamentals present a bifurcated picture: elite quality metrics against a clear deceleration trend. Q1 2026 revenue of ¥106.2B represents sequential compression from ¥123.9B in Q4 2025, and the operating margin trend is the central concern — 24.8% (Q2'25) → 23.1% (Q3'25) → 21.1% (Q4'25) → 18.4% (Q1'26), a persistent four-quarter compression. Yet profitability remains exceptional in absolute terms: 55.9% gross margin, 25.5% ROE, 22.1% operating margin (TTM), and 21.6% net margin. The balance sheet is a fortress — ¥123B cash (~$52/share net cash), only ¥5.1B debt (0.01 debt/equity), current ratio 2.54, and TTM FCF of ¥71.6B. Valuation is genuinely cheap: 9.9x TTM P/E, 7.4x forward P/E, 0.66 PEG, EV/Sales 0.90. The unresolved governance issue remains zero capital return despite the massive cash hoard, which caps re-rating potential absent a policy shift. Q1 EPS reportedly beat consensus by ~74% ($2.45 vs $1.41), suggesting cost discipline is offsetting revenue weakness — a mixed signal that will be tested on August 25.
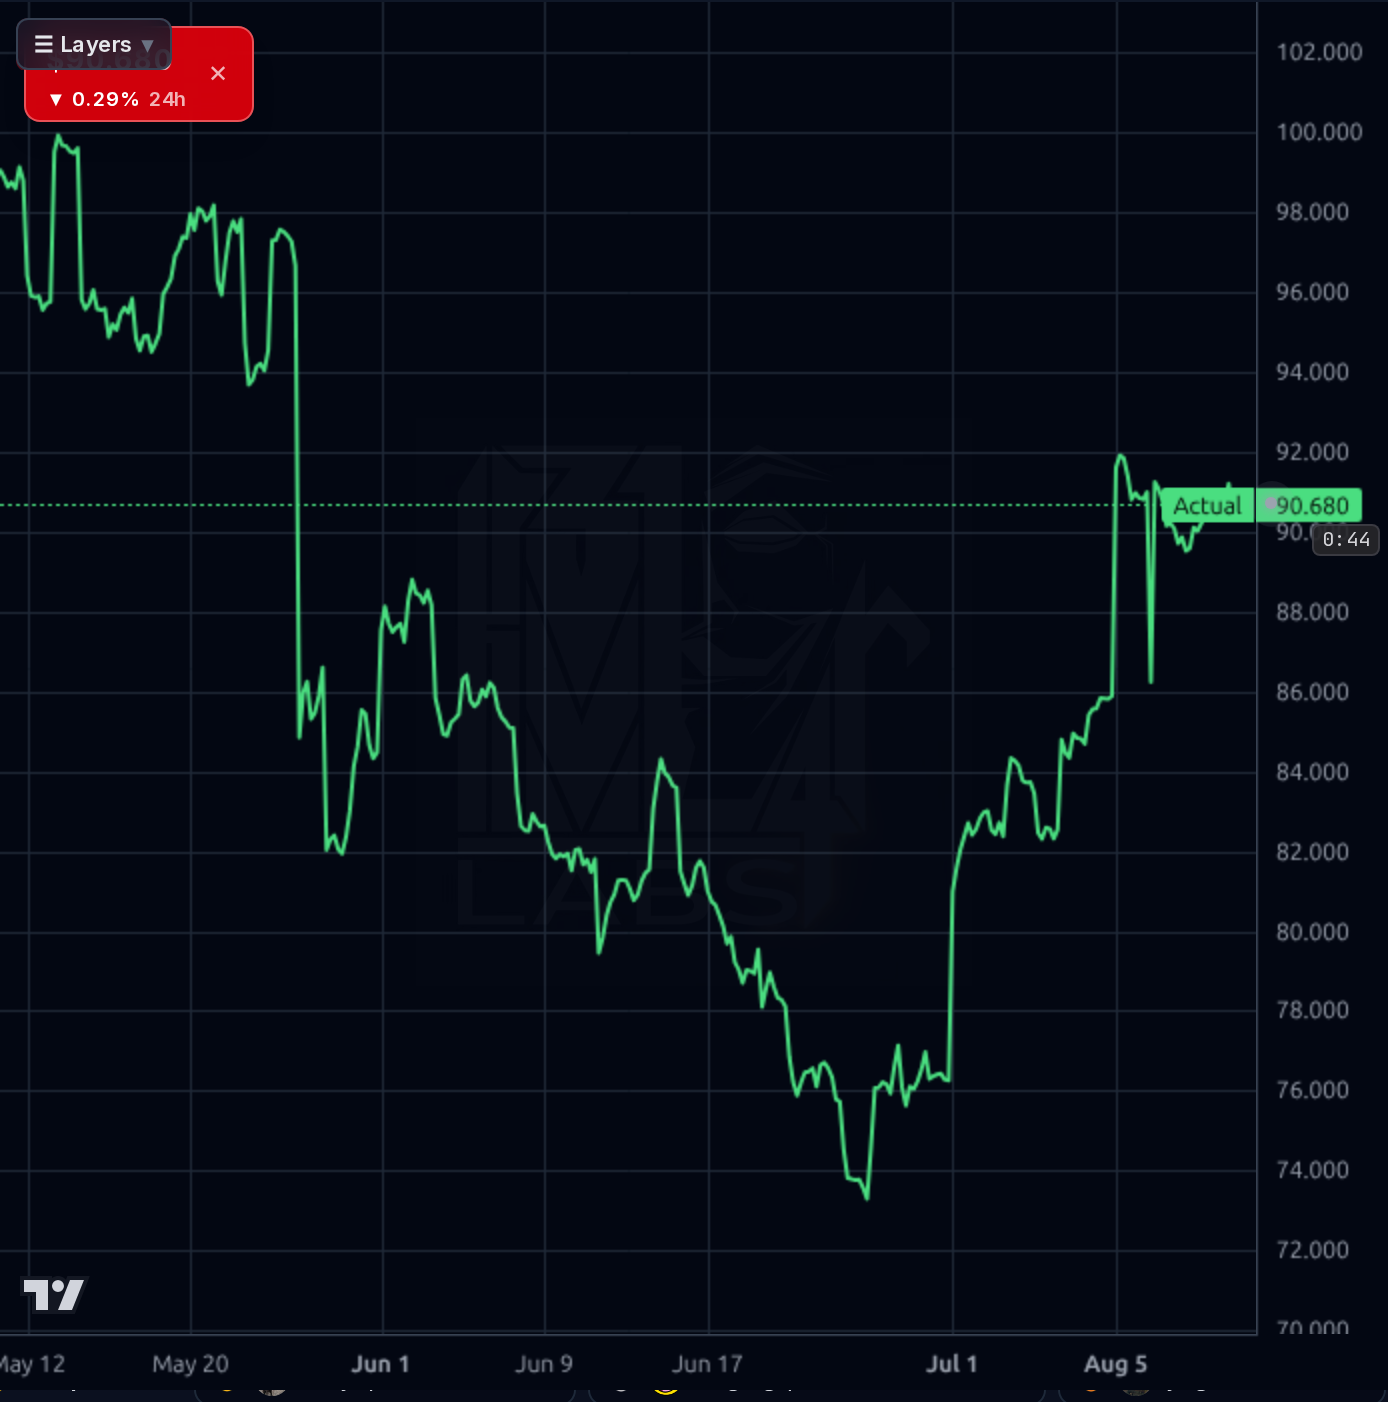
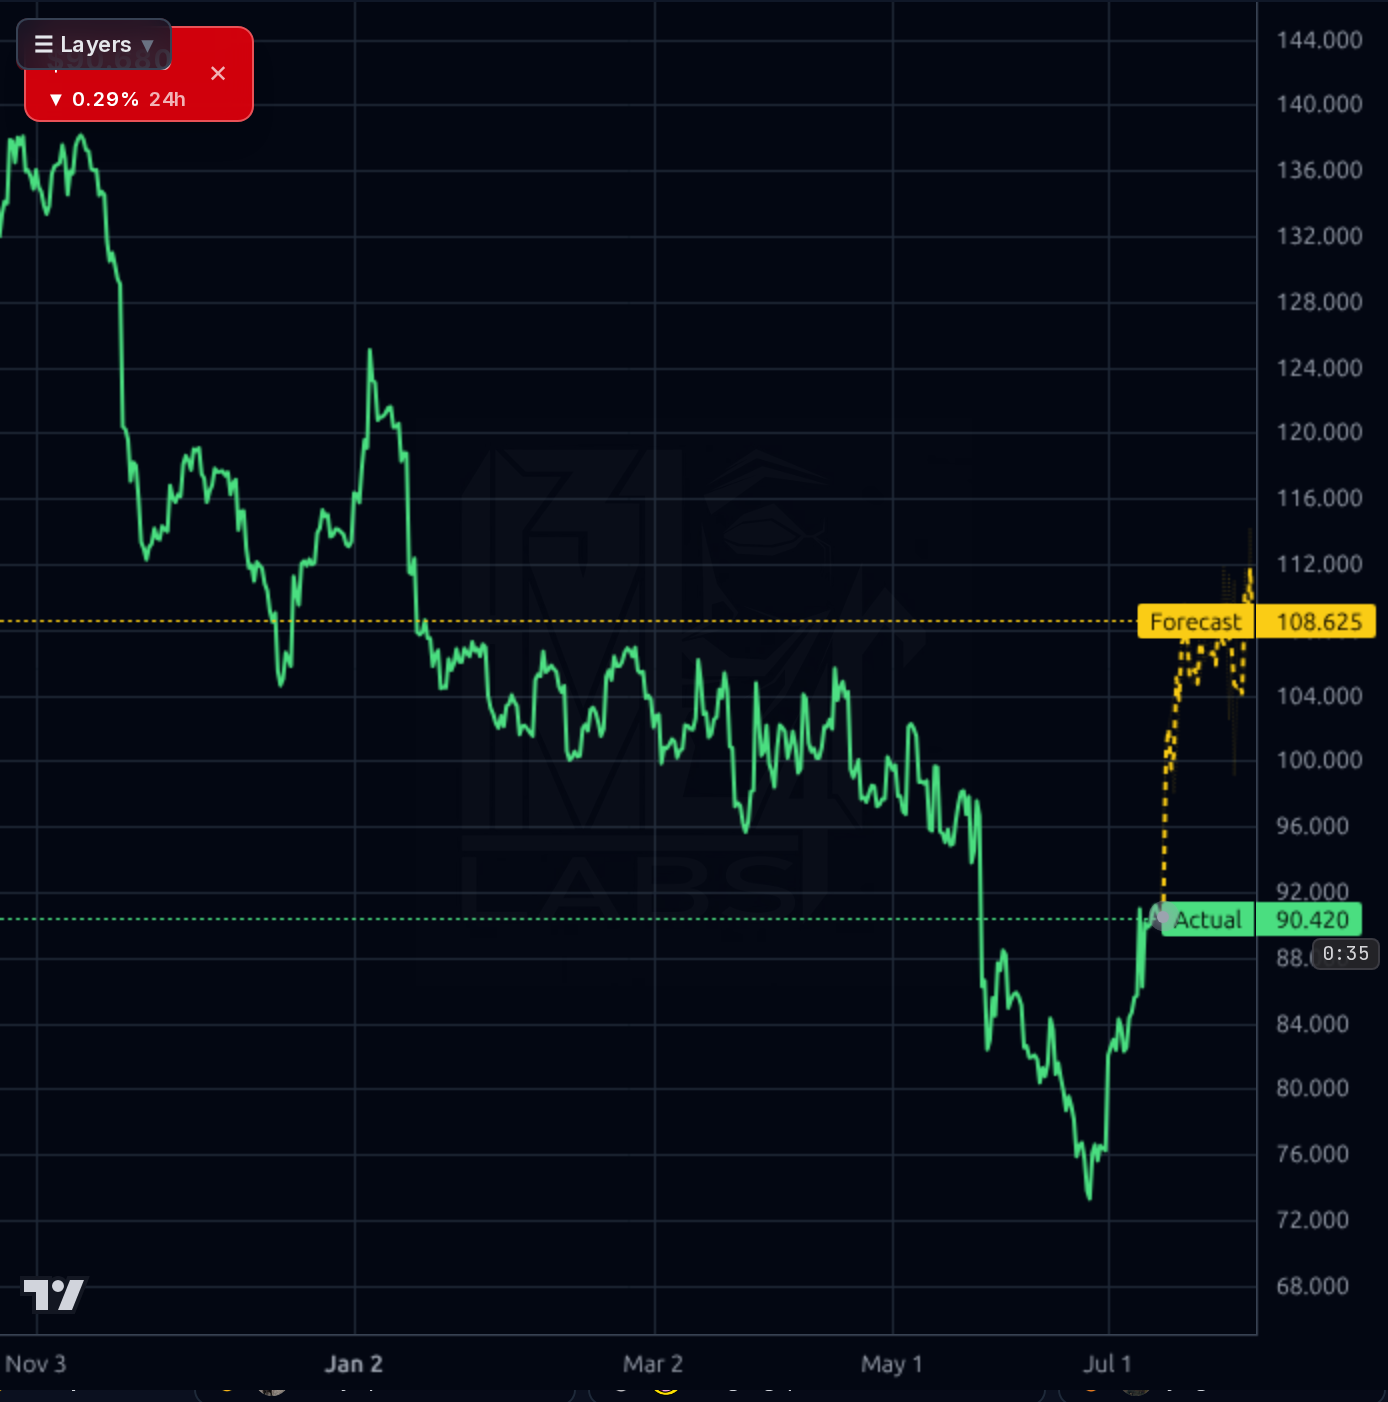
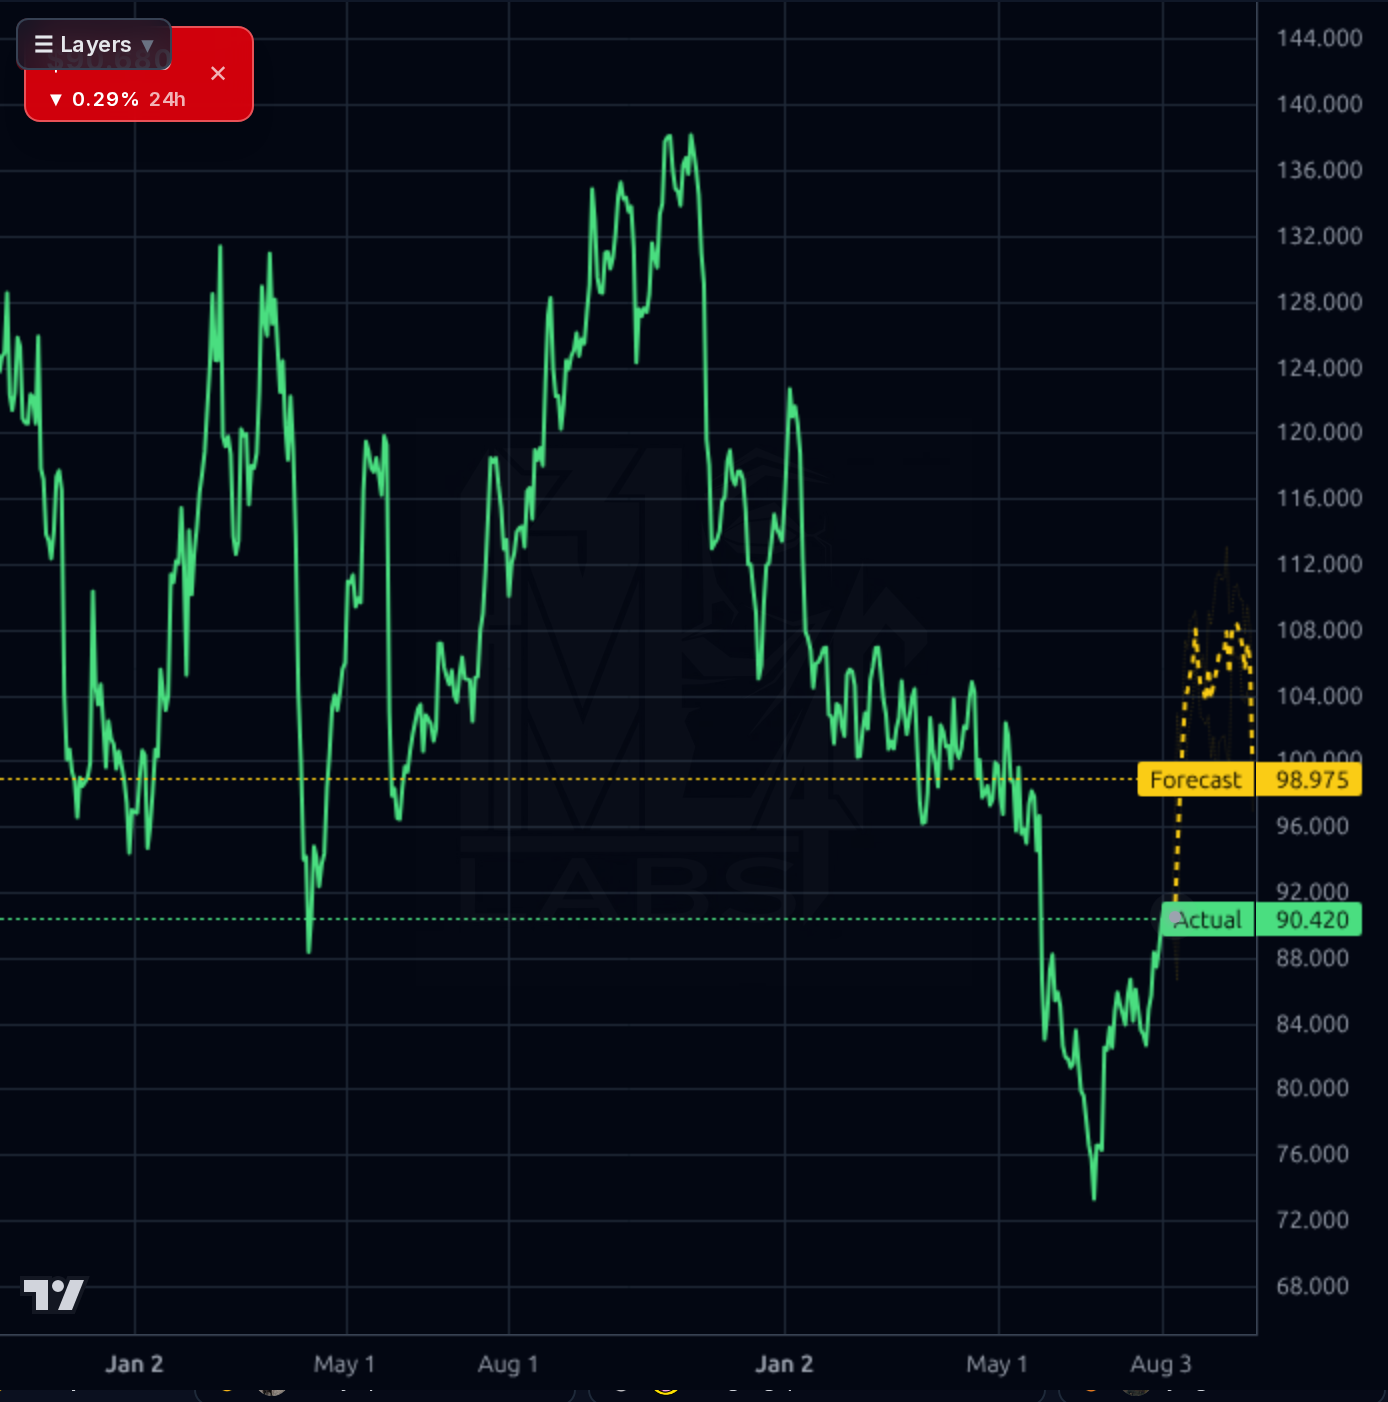
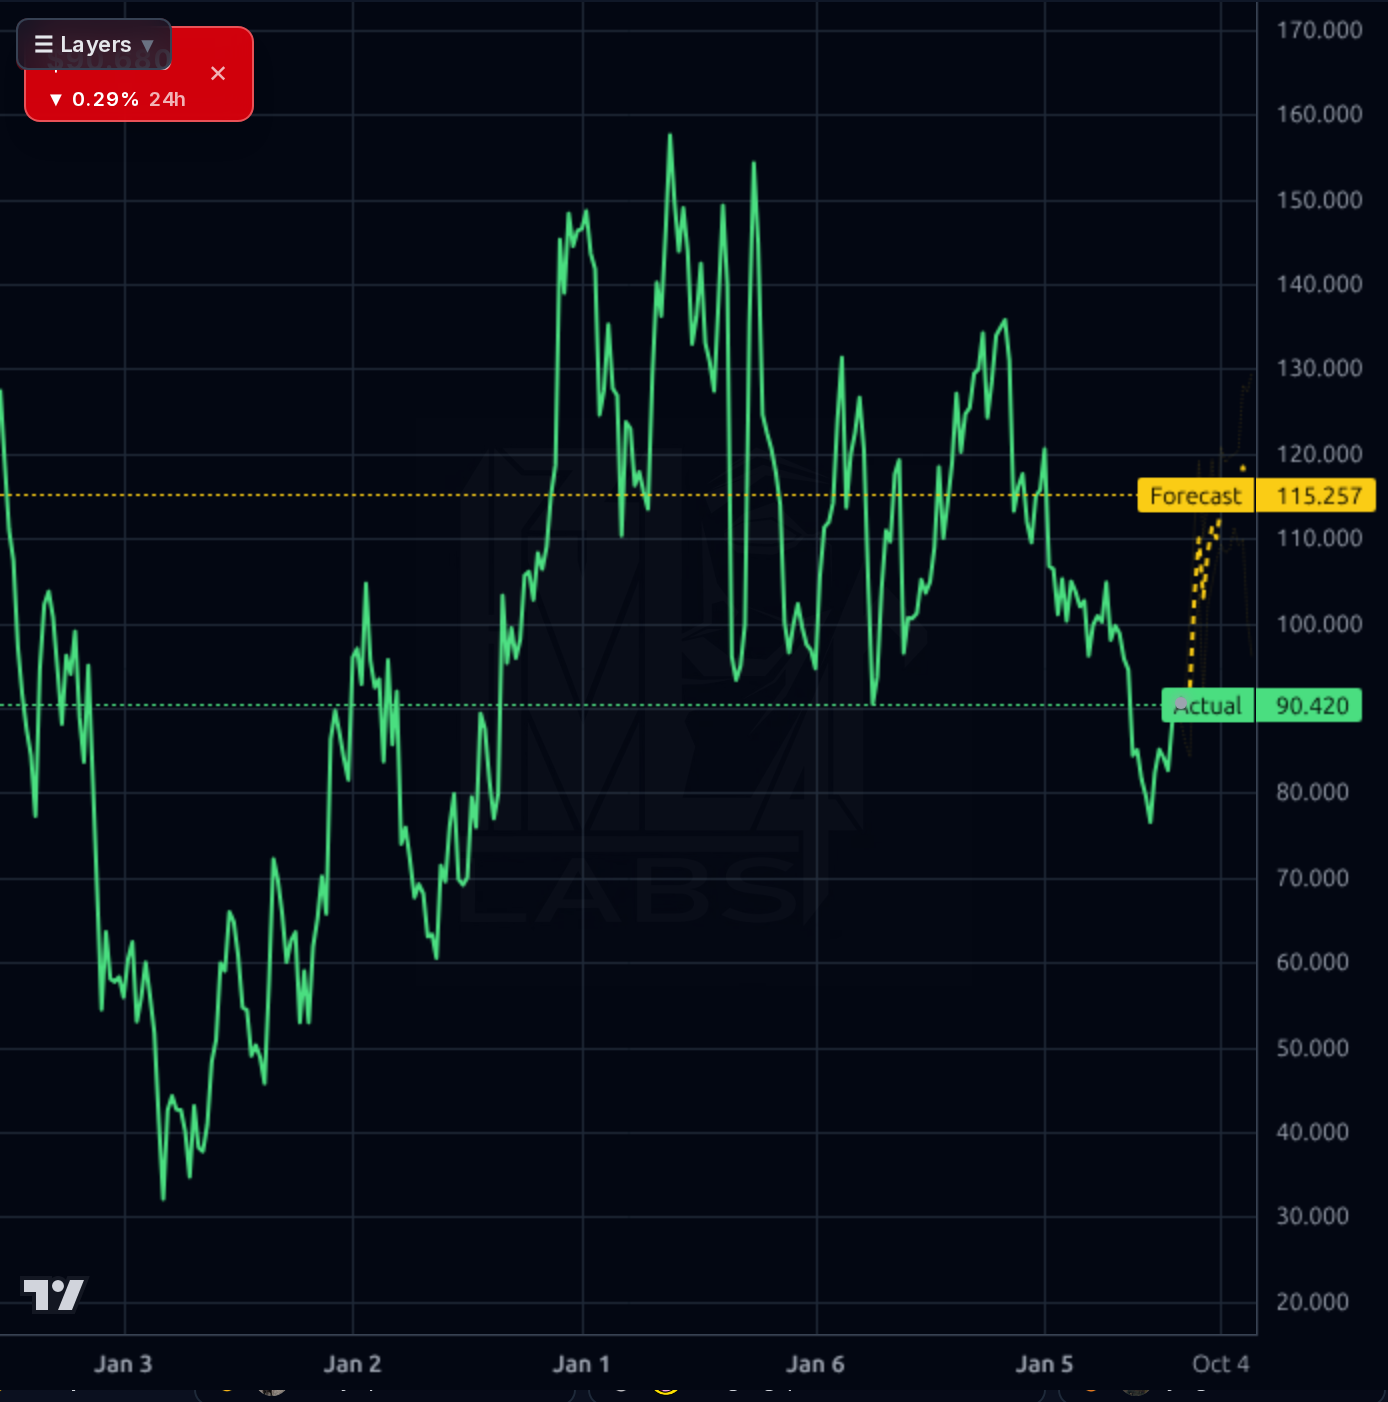
Across timeframes, PDD has executed a legitimate recovery off the mid-July $73-76 lows, rallying ~24% to $90.85 with RSI 64.3 and +5.1%/+8.6% above the 20/50-day SMAs. The 1h chart shows a sharp June-July downtrend that decisively reversed after the July 1 low, with the current level pressing directly into $92 gap-fill/resistance where the last swing high was rejected. The 4h/1d views reinforce that $90-92 is the pivotal supply zone — the last five months of price action have failed here. The 1wk view exposes the broader damage: the stock remains 35% below the $139 52-week high and -11.9% below the 200-day SMA, so this is a mean-reversion bounce within a larger downtrend, not a new bull leg. The model's forecast bands are optimistic ($98-115) but its 1d/1wk directional accuracy is BELOW the naive baseline, so those upside projections deserve heavy discount. Realistic near-term resistance ladder: $92 → $95-96 (base target zone) → $100 psychological. Support ladder: $86-88 shelf → $82 → $76-78 accumulation floor.
Signal: The Q1 2026 print on May 27 delivered a revenue miss but a substantial EPS beat, evidencing management prioritization of profitability/cost discipline over top-line growth — this is the core reason the stock has recovered from the mid-July lows. The August 25 Q2 print is the dominant near-term catalyst; consensus is ~$2.85 EPS. Recent Zacks/Yahoo coverage flags PDD as attracting investor attention with positive short-term price action (+1.8%, +2.65% sessions), and ChartMill's value screen (P/E 7.96, zero debt, strong profitability) validates the quantitative deep-value setup. Noise: The general market news (GrafTech, ANI Pharma, Senate crypto legislation) is unrelated context. Social sentiment is 100% bullish but low-volume (3 tagged messages, plus retail chatter about an unusual $3.1M call buyer for 9/18 expiration) — that options flow is worth noting as it aligns with the August 25 earnings window but should not be treated as informed signal. Regulatory overhang (US de minimis rule, EU DSA, SAMR, VIE structure) remains the persistent bear-case anchor that caps multiple expansion.
- Q2 2026 earnings (August 25) — margin trajectory vs 18.4% Q1 trough is the single most critical near-term catalyst per management guidance
- Temu international expansion continues driving mix shift; management explicitly framed strategy as prioritizing long-term competitiveness over near-term results
- $123B cash pile creates optionality for a first-ever capital return announcement (buyback/dividend) that would trigger immediate re-rating
- C2M (consumer-to-manufacturer) supply chain moat — Barclays cites 'unique ability to thrive in a low-growth macro environment' as structural advantage
- Consensus Q2 EPS of ~$2.85 (vs Q1 $2.45) implies analysts expect sequential profitability improvement — a beat/miss vs this bar is the swing factor
- Fifth consecutive operating margin compression quarter on August 25 would invalidate the deep-value recovery thesis and retest $75-80
- US de minimis rule elimination would materially damage Temu's core cost advantage in its largest international market
- VIE structure and Chinese ADR delisting risk creates a permanent ~20-30% valuation discount vs global peers
- Regulatory overhang from EU DSA and China's SAMR represents ongoing threat of material fines or operational restrictions
- Zero capital return despite $123B cash hoard is a governance red flag that caps multiple expansion
- Revenue growth deceleration (Q1 revenue miss) suggests Temu international ramp may be encountering competitive/regulatory friction
- Model's forecast directional accuracy is BELOW naive baseline on 1d/1wk — do not lean on the upside projection band
- Binary earnings event 18 days out creates asymmetric near-term risk; IV crush + gap risk make pre-print sizing dangerous
Get AI analysis on any stock
This is one of hundreds of Kronos AI reports — scored fundamentals & technicals, bull/base/bear price targets, a multi-horizon plan, and continuously-updated forecasts across the market. Create a free account to explore them all.
Create your free account →Already a member? Sign in · Join our Discord