PDD — AI Stock Forecast & Price Targets
Published 7/14/2026 · A free sample of K3vl4r’s AI-powered analysis.
Kronos price forecasts, scored fundamentals & technicals, and a multi-horizon plan.
View the live PDD price forecast →
PDD trades at $84.56 with a trailing P/E of ~9x and forward P/E of ~6.9x, sitting 39% below its 52-week high despite generating RMB 107B in operating cash flow and holding RMB 436B in cash against just RMB 5B debt. The setup remains a classic deep-value/broken-momentum tension: best-in-class margins (56% GM, 22% OM, 25% ROE) and a Citi endorsement provide a bull case, but decelerating EPS Q/Q (-10%), a 43% Q1 EPS miss, Temu regulatory overhang, and the August 25 earnings binary keep near-term conviction capped.
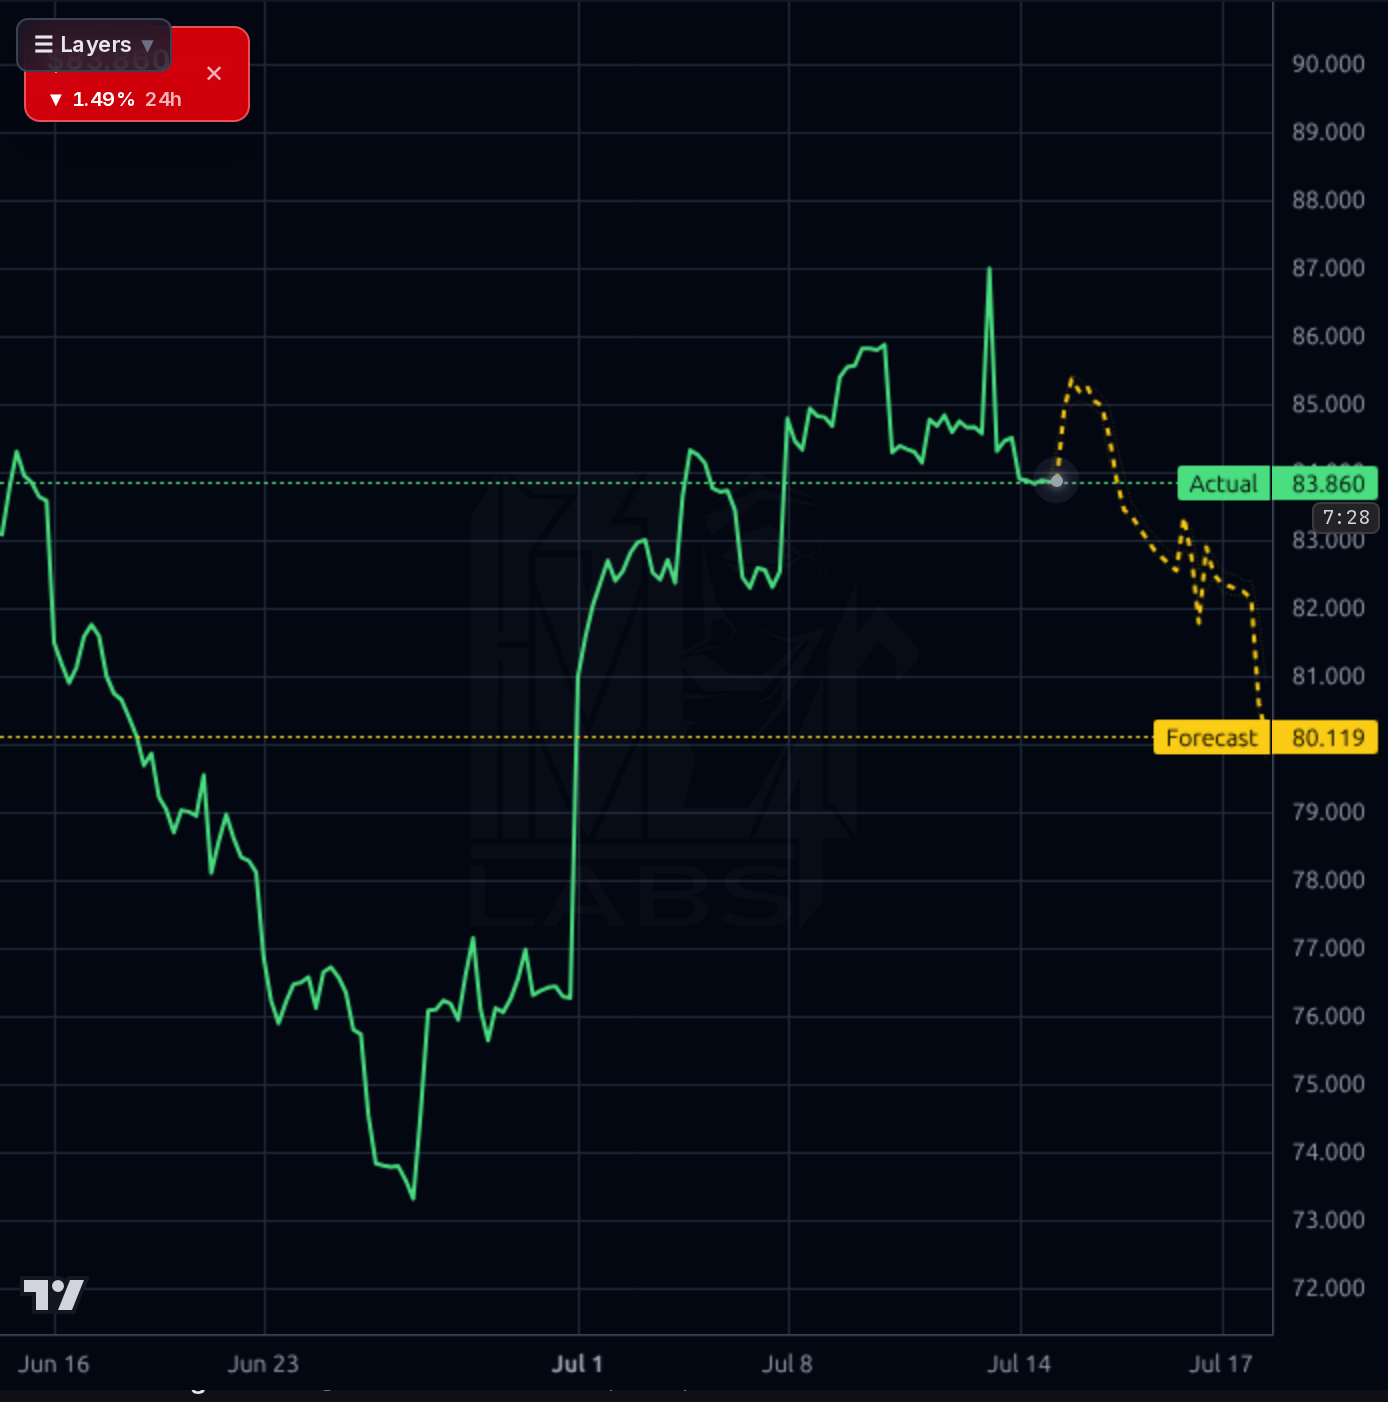
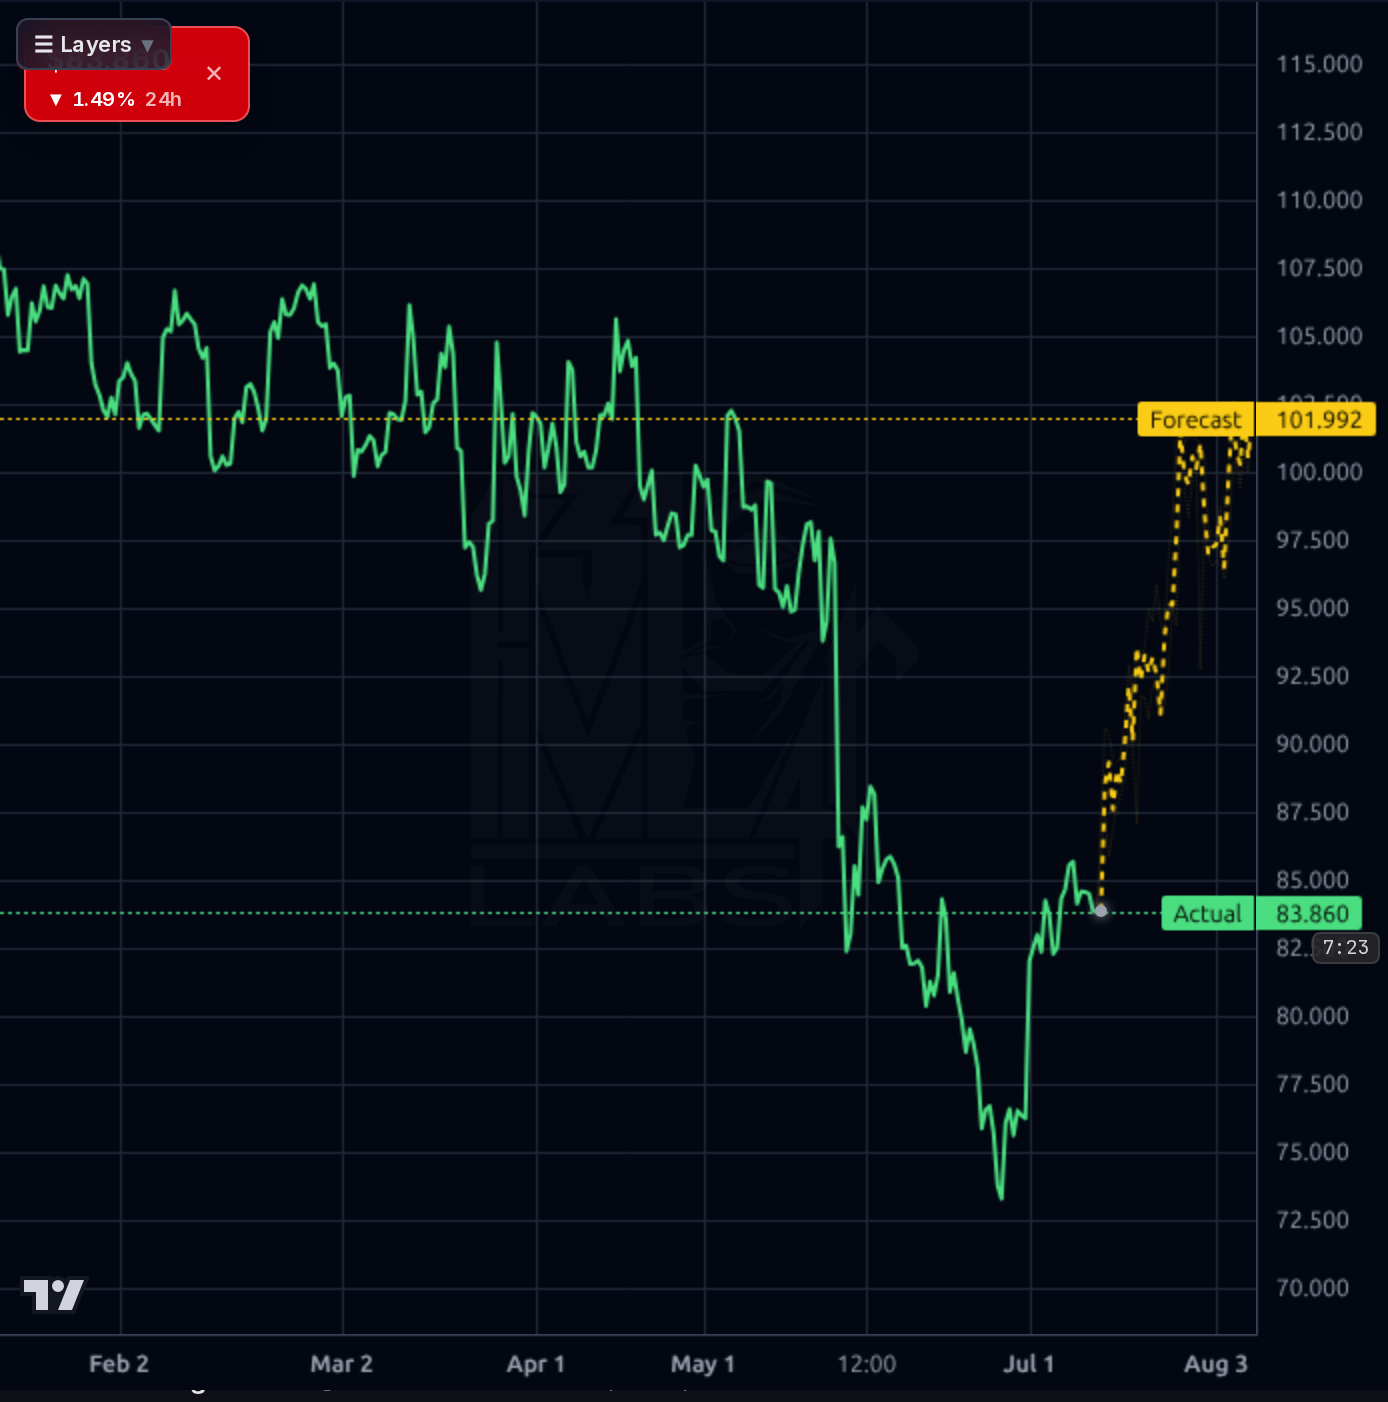
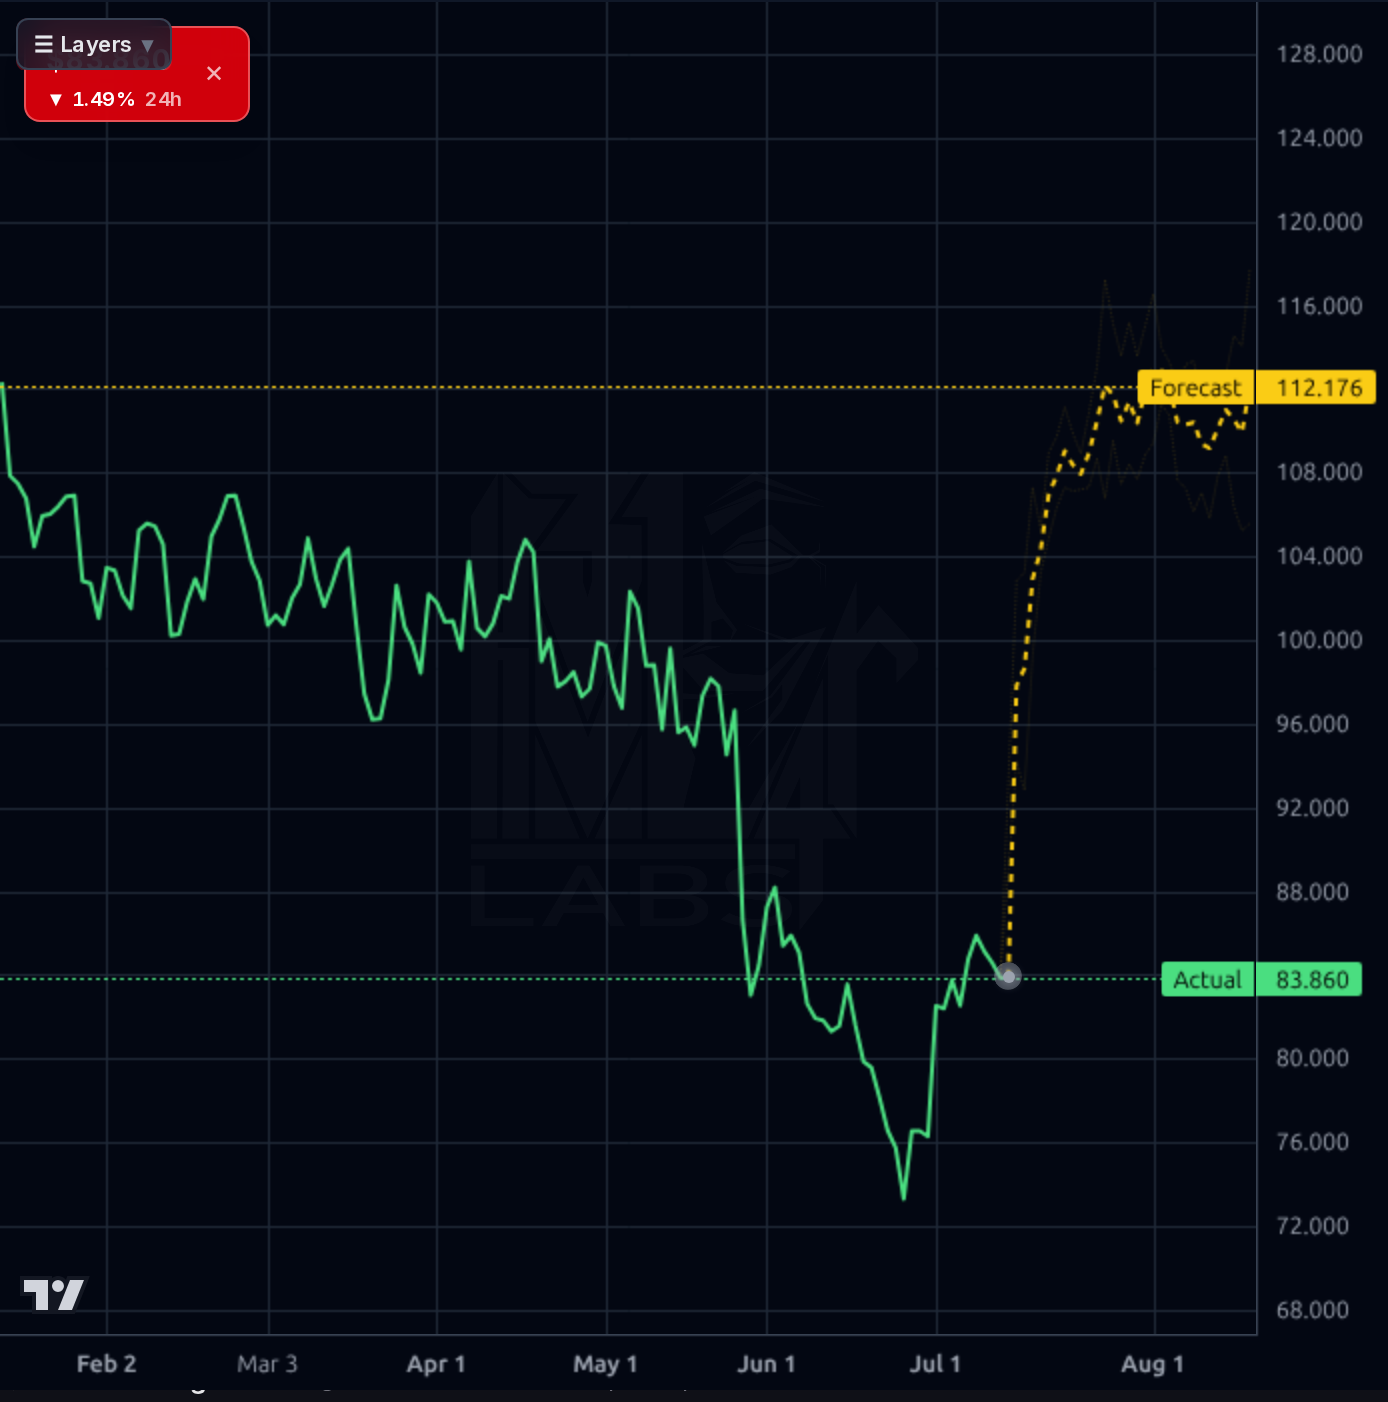
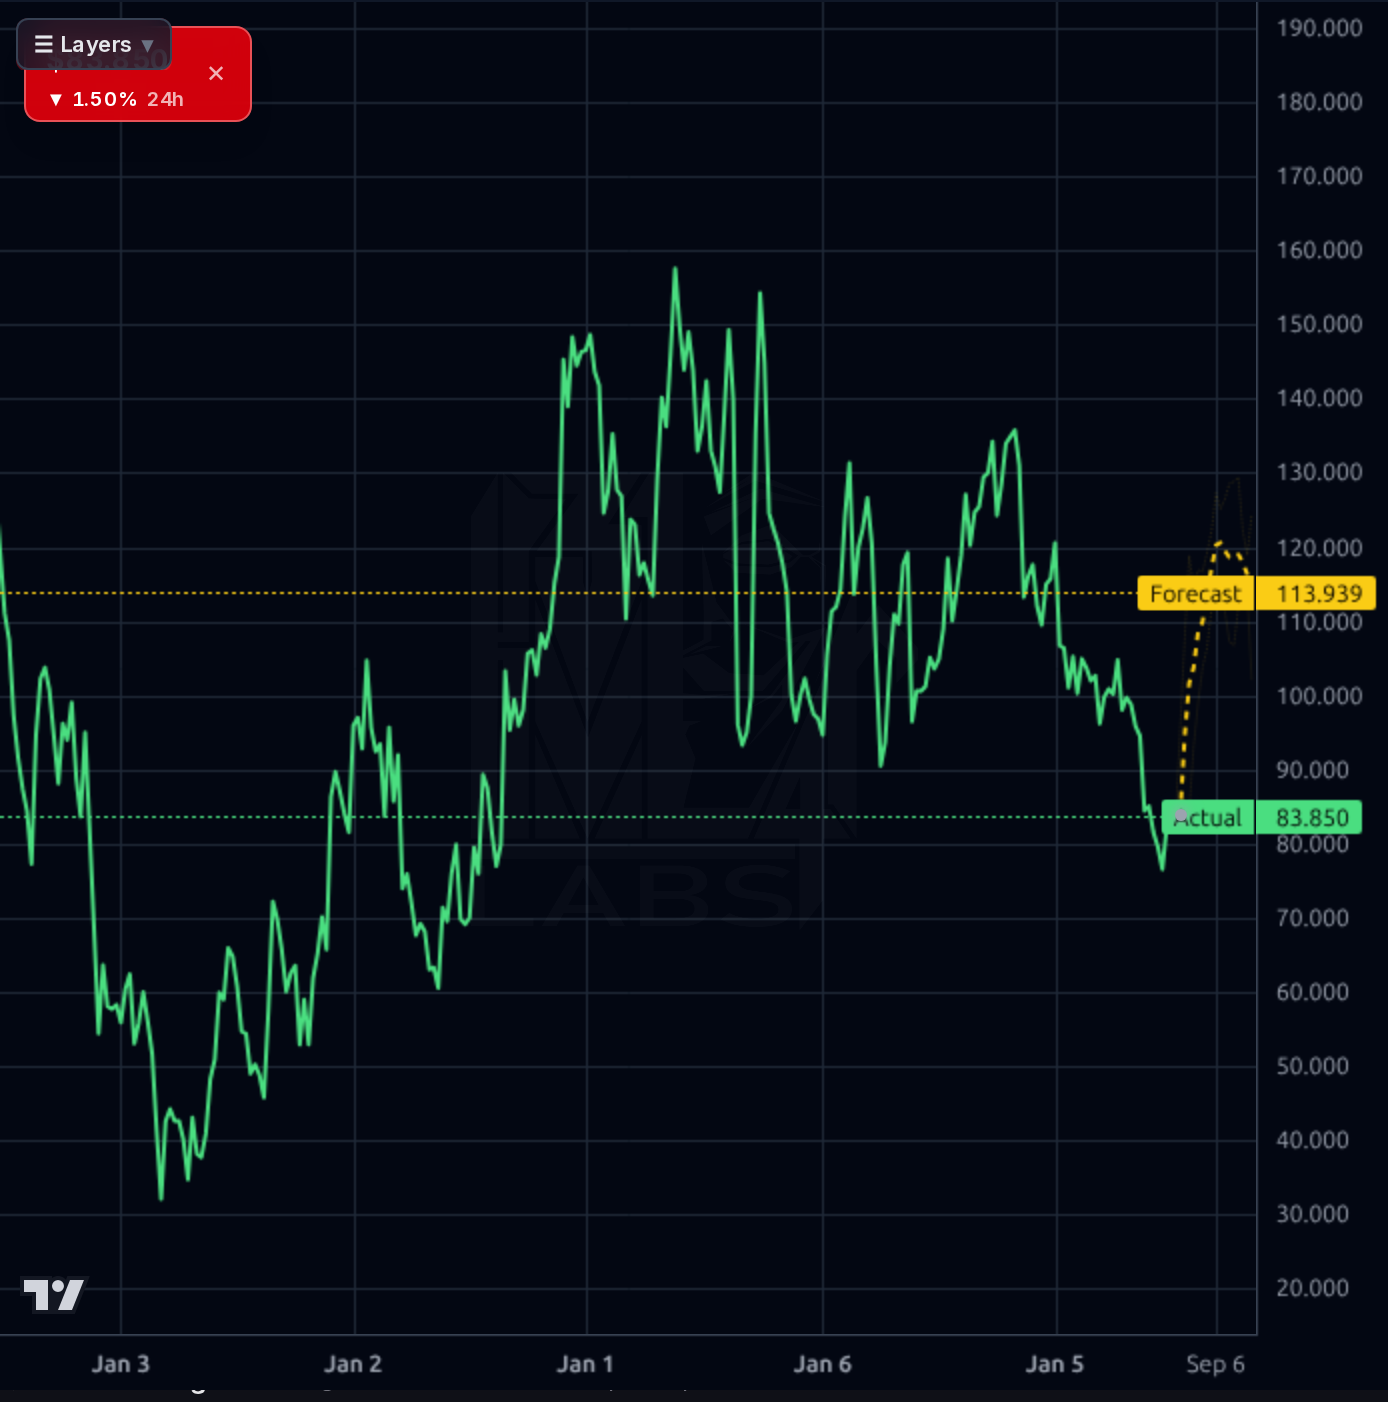
1-4 weeks: The August 25 earnings print is the dominant catalyst and it is BINARY — do not size a swing trade into it. Near-term price action favors a pullback to $80-82 (aligned with the 1h forecast toward $80.12 and daily support), where accumulation is preferable to chasing $85-87 resistance. Tactical plan: scale a starter position on any dip toward $80-82 with invalidation below $76 (June low retest). If price breaks and holds above $87 pre-earnings, that's a confirmation trigger but sizing must remain modest given the print risk. Do not add within 5 trading days of the earnings release; if long into it, hedge with puts or trim by 30-50%.
1-6 months: Base case is a grind-higher toward $95-105 as the market re-rates the cash-rich, sub-9x P/E setup, provided Q2 earnings on Aug 25 do not repeat the 43% miss magnitude. Expected return range: -10% to +25% from spot. Key catalysts: (1) Q2 print showing Temu margin stabilization, (2) any resolution/clarity on the Iowa Temu suit, (3) further sell-side upgrades converging toward the $115.81 consensus. What changes the mind: another >20% EPS miss, evidence Temu subsidy burn is accelerating rather than moderating, or a break of the $74 June low which would open $65.
1-3 years: If Pinduoduo's domestic franchise remains defensively profitable and Temu graduates from subsidy-heavy customer acquisition to a sustainable margin profile, PDD can realistically compound EPS at the 11%+ pace analysts project, supporting a fair multiple of 12-15x — implying $150-200 on current earnings power. The RMB 436B cash pile provides multi-year optionality (buybacks, dividends, or M&A) that is not priced in. Biggest structural risks: (1) US-China regulatory escalation that materially restricts Temu's US access — this is the primary tail risk given the political environment, (2) sustained margin compression from competitive pressure as Alibaba, JD, and Douyin fight back on price, (3) de-listing/VIE risk which is dormant but never zero for China ADRs.
Fundamentals remain elite on most axes but show clear deceleration. TTM revenue of RMB 442B with Q1 2026 at RMB 106.2B is up ~17% Y/Y (Sales Q/Q +16.7%), but net income compression is visible: Q1 2026 net income of RMB 12.5B vs. RMB 30.8B in Q2 2025 — a >50% sequential fade over four quarters as Temu subsidies and AI investment compress profitability. Gross margin held at 55.9% and operating margin at 18.4% (down from 24.8% a year prior), still industry-leading. The balance sheet is the standout: RMB 436B total cash vs. RMB 5.1B debt, book value $43/share and cash/share $52 — meaning ~62% of the $84.56 price is covered by net cash alone, giving an enterprise value of only ~$47B against RMB 71.6B (~$10B) TTM free cash flow, a ~21% FCF/EV yield. ROE 25.5%, ROIC 22.1%. The problem is trend: EPS Q/Q -10.4%, EPS Y/Y TTM -1.85%, and EPS surprise -41.6% — the earnings power is real but visibility is degrading.
Across timeframes the picture is a stabilizing but unconfirmed bottom. The weekly chart shows the stock cut roughly in half from the $158 highs to a $74 low, now curling up to $84 — a bullish base attempt but still well below the $95-100 supply zone. The daily chart shows a sharp June recovery off $74 that has stalled at $85-87 resistance; the 1d model's aggressive $112 forecast is disconnected from realized volatility and directionally beaten by naive baseline on 1wk (70% vs 80%), so discount it. The 4h chart shows the same rally decelerating and the model's shorter-term forecast (81.99-101.99 band, midpoint ~$92) is more credible. The 1h chart shows near-term weakness — price rolling from $87 spike-high to $83.86 with the forecast pointing down to $80.12, consistent with the 1d SMA20 +5% (short-term extended) but SMA50 -3.6% and SMA200 -21% (still in a longer downtrend). RSI 53 is neutral. Key levels: support $80/$76/$74, resistance $87/$92/$100.
The dominant signal is Citi's early-July endorsement naming PDD a top Chinese internet pick, explicitly citing the ~$63B cash position and AI capabilities, with sell-side consensus target of $115.81 (~37% upside) — this is a meaningful sentiment inflection after months of downgrades. Simply Wall St. flags the 26% YTD drawdown as creating undervaluation on multiple checks. Countering this, coverage repeatedly mentions the Iowa Temu lawsuit as a legal overhang and the Q1 EPS miss remains fresh. The Shein Hong Kong IPO news is peripheral but reinforces that the fast-fashion/cross-border e-commerce space is heating up competitively. Noise to strip out: the social sentiment is 90% bullish and driven partly by WhatsApp promotion groups — treat as contrarian caution, not confirmation.
- Temu international expansion continuing to drive TTM sales growth of 11.7% and Q/Q +16.7% despite domestic Chinese consumer softness
- Xiongan New Area expansion cited in July 2026 coverage as a specific domestic growth initiative
- $63B cash pile provides firepower for AI capability build-out cited as a Citi bull-thesis pillar
- Analyst EPS growth estimate of +19.99% for next year, with next-quarter EPS of $2.73 forming a testable near-term milestone at August 25 print
- Sell-side consensus target of $115.81 across 34 analysts implies re-rating room if Q2 execution stabilizes
- August 25 Q2 earnings is binary — Q1 missed EPS by 43%, and a repeat would invalidate the deep-value thesis near-term
- Iowa Temu lawsuit and broader regulatory scrutiny of the cross-border e-commerce model
- Operating margin compression from 24.8% (Q2 2025) to 18.4% (Q1 2026) shows subsidy/investment burn is accelerating faster than revenue
- Net income declined from RMB 30.8B (Q2 2025) to RMB 12.5B (Q1 2026) — earnings power actively deteriorating on absolute basis
- China ADR structural risks (VIE, delisting, capital controls) remain latent
- Retail social sentiment at 90% bullish with organized promotion groups is a contrarian warning sign
- 1d model directional accuracy is at naive baseline and 1wk is below naive — the very bullish AI forecasts should be heavily discounted
Get AI analysis on any stock
This is one of hundreds of Kronos AI reports — scored fundamentals & technicals, bull/base/bear price targets, a multi-horizon plan, and continuously-updated forecasts across the market. Create a free account to explore them all.
Create your free account →Already a member? Sign in · Join our Discord