PDD — AI Stock Forecast & Price Targets
Published 8/3/2026 · A free sample of K3vl4r’s AI-powered analysis.
Kronos price forecasts, scored fundamentals & technicals, and a multi-horizon plan.
View the live PDD price forecast →
PDD trades at 7.2x forward earnings with a $123B cash fortress and 56% gross margins, but four consecutive quarters of operating margin compression (24.8%→18.4%) and a Q1 EPS miss have transformed this from a growth story into a deep-value/broken-momentum setup. Price has reclaimed the $84-88 shelf at $88.56 with RSI 60 and constructive short-term technicals, but the August 25 Q2 print (~22 days away) is a binary catalyst that dictates whether the stock re-rates toward $100+ or retests the $75-80 floor. Accumulate on weakness pre-print; do not chase into the binary.
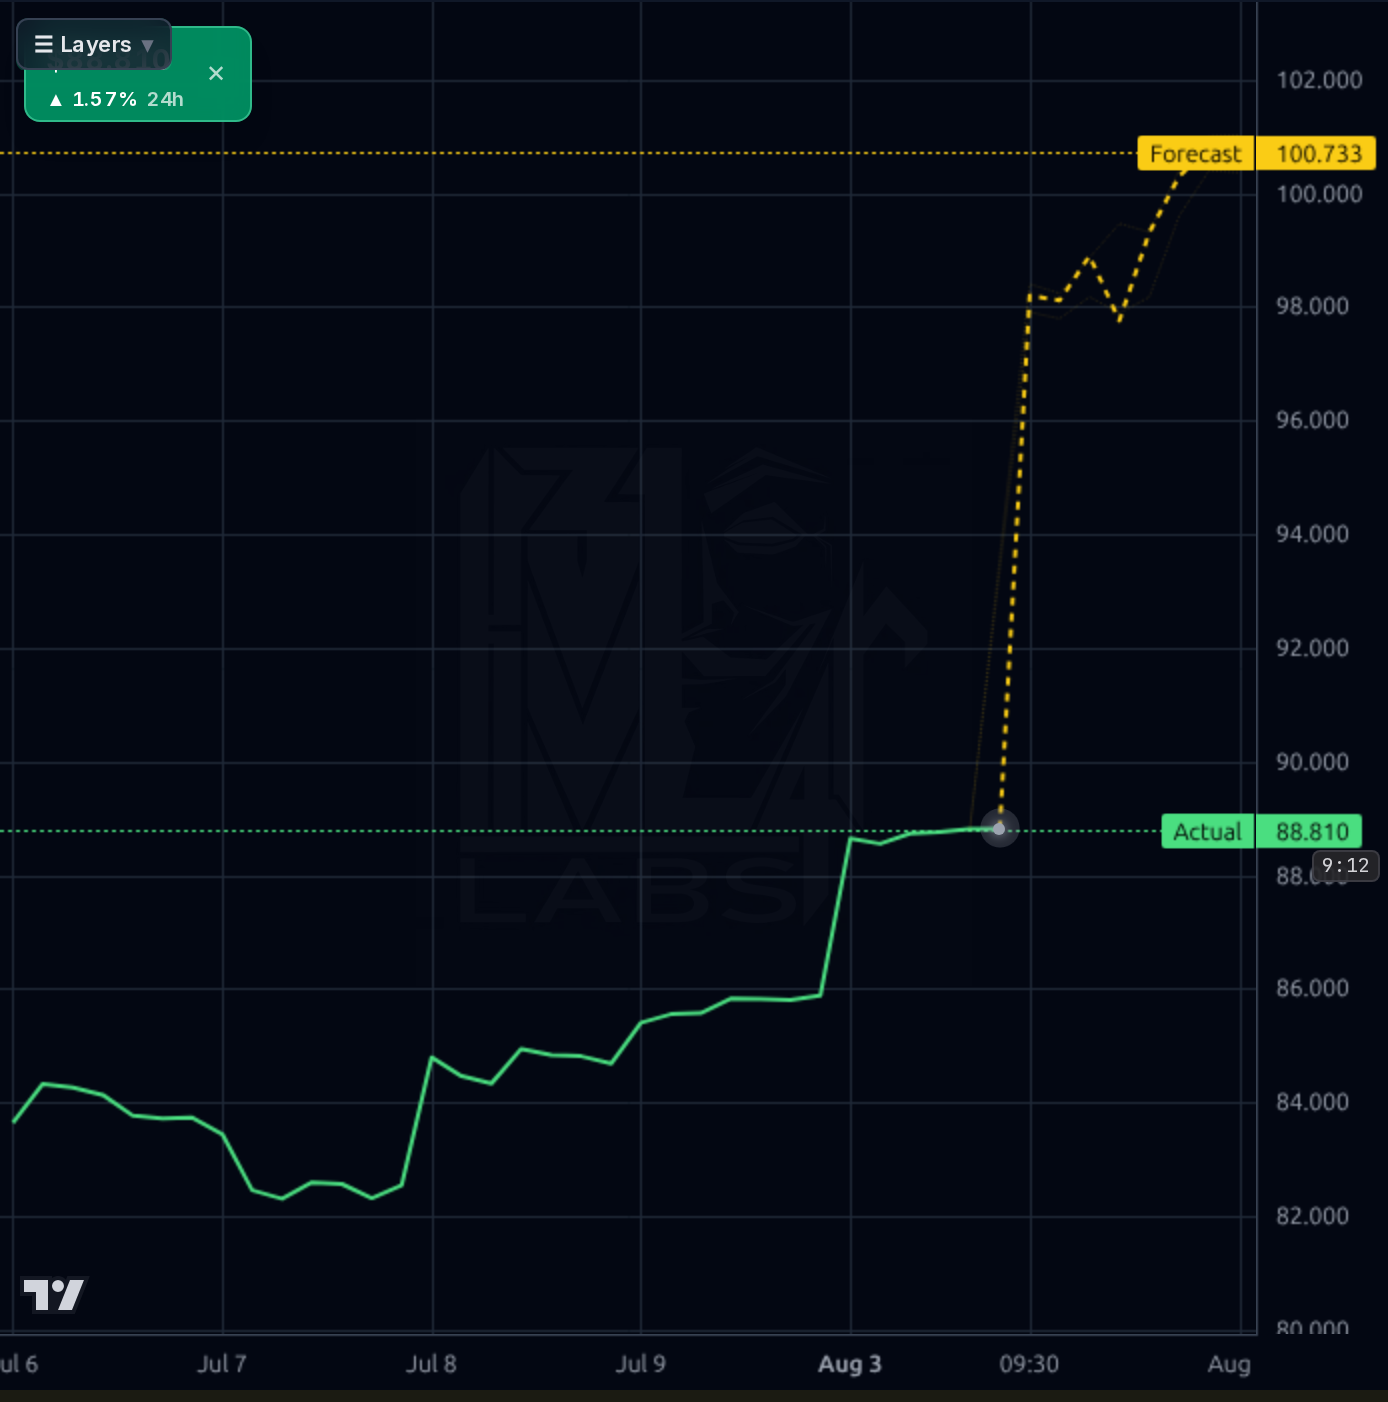
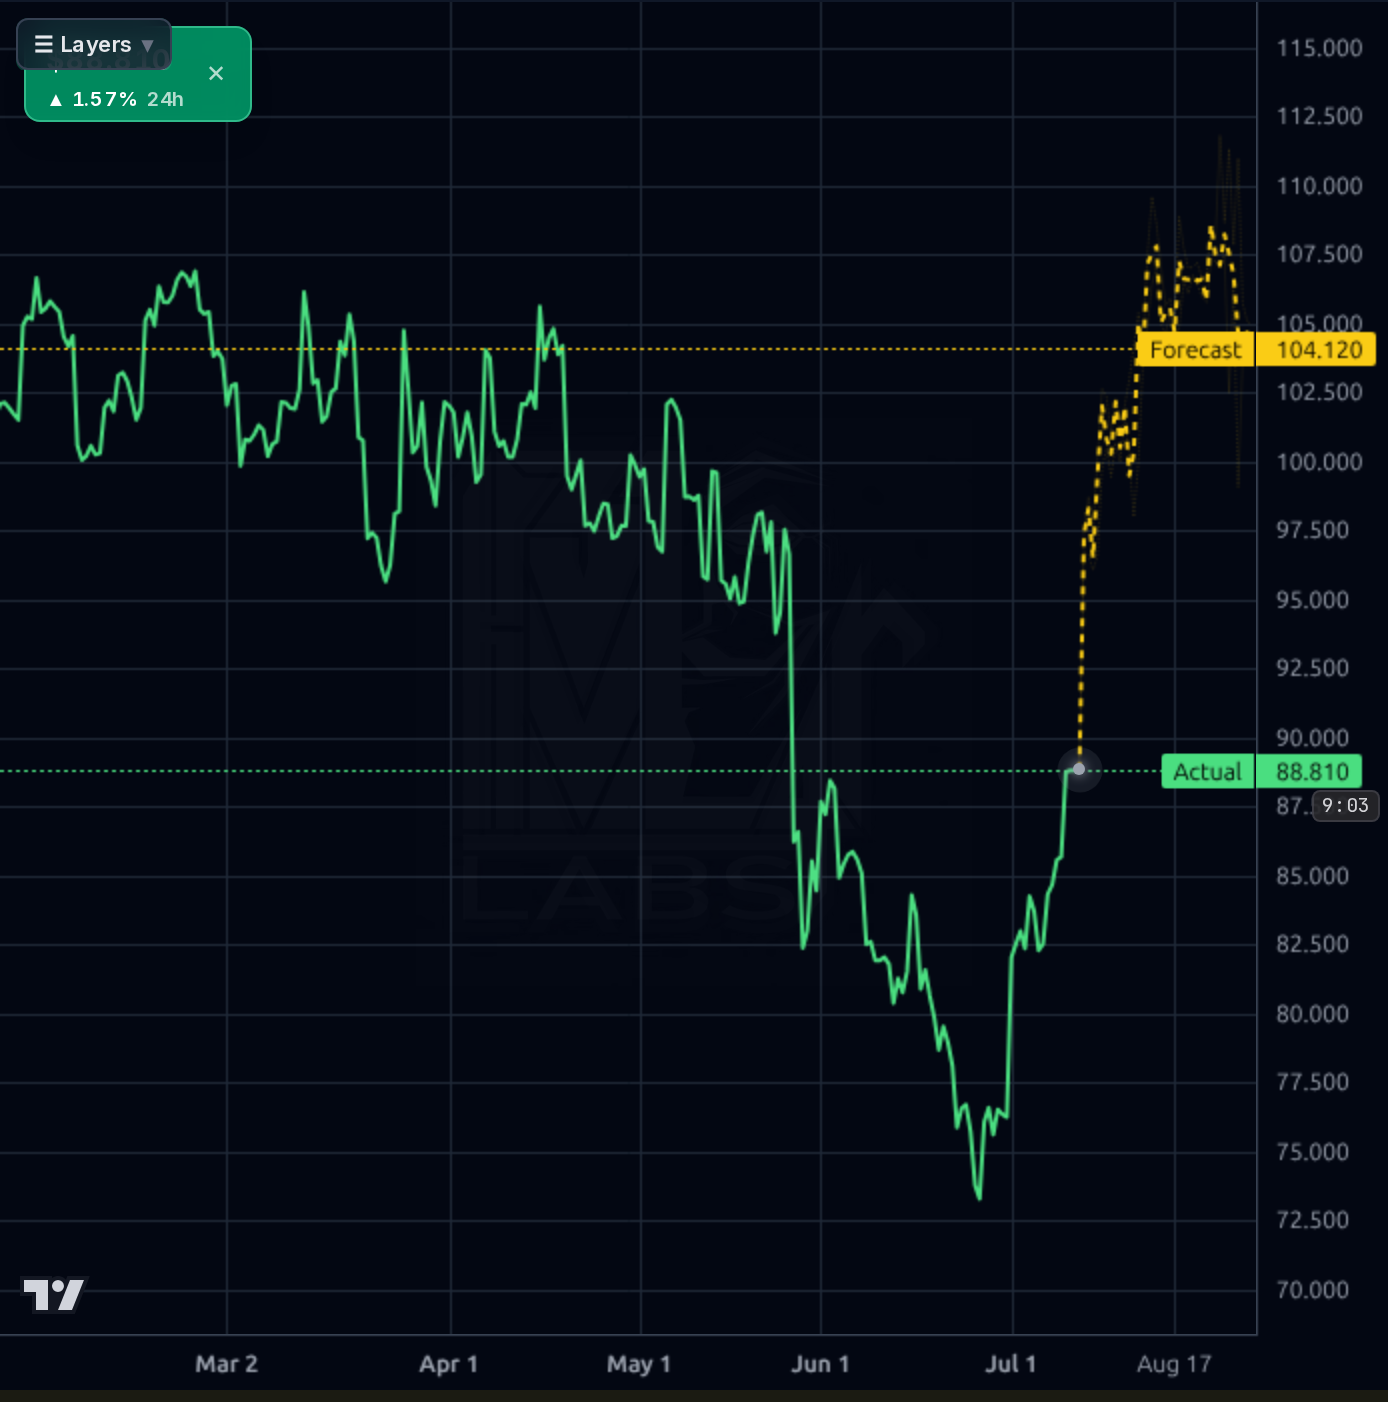
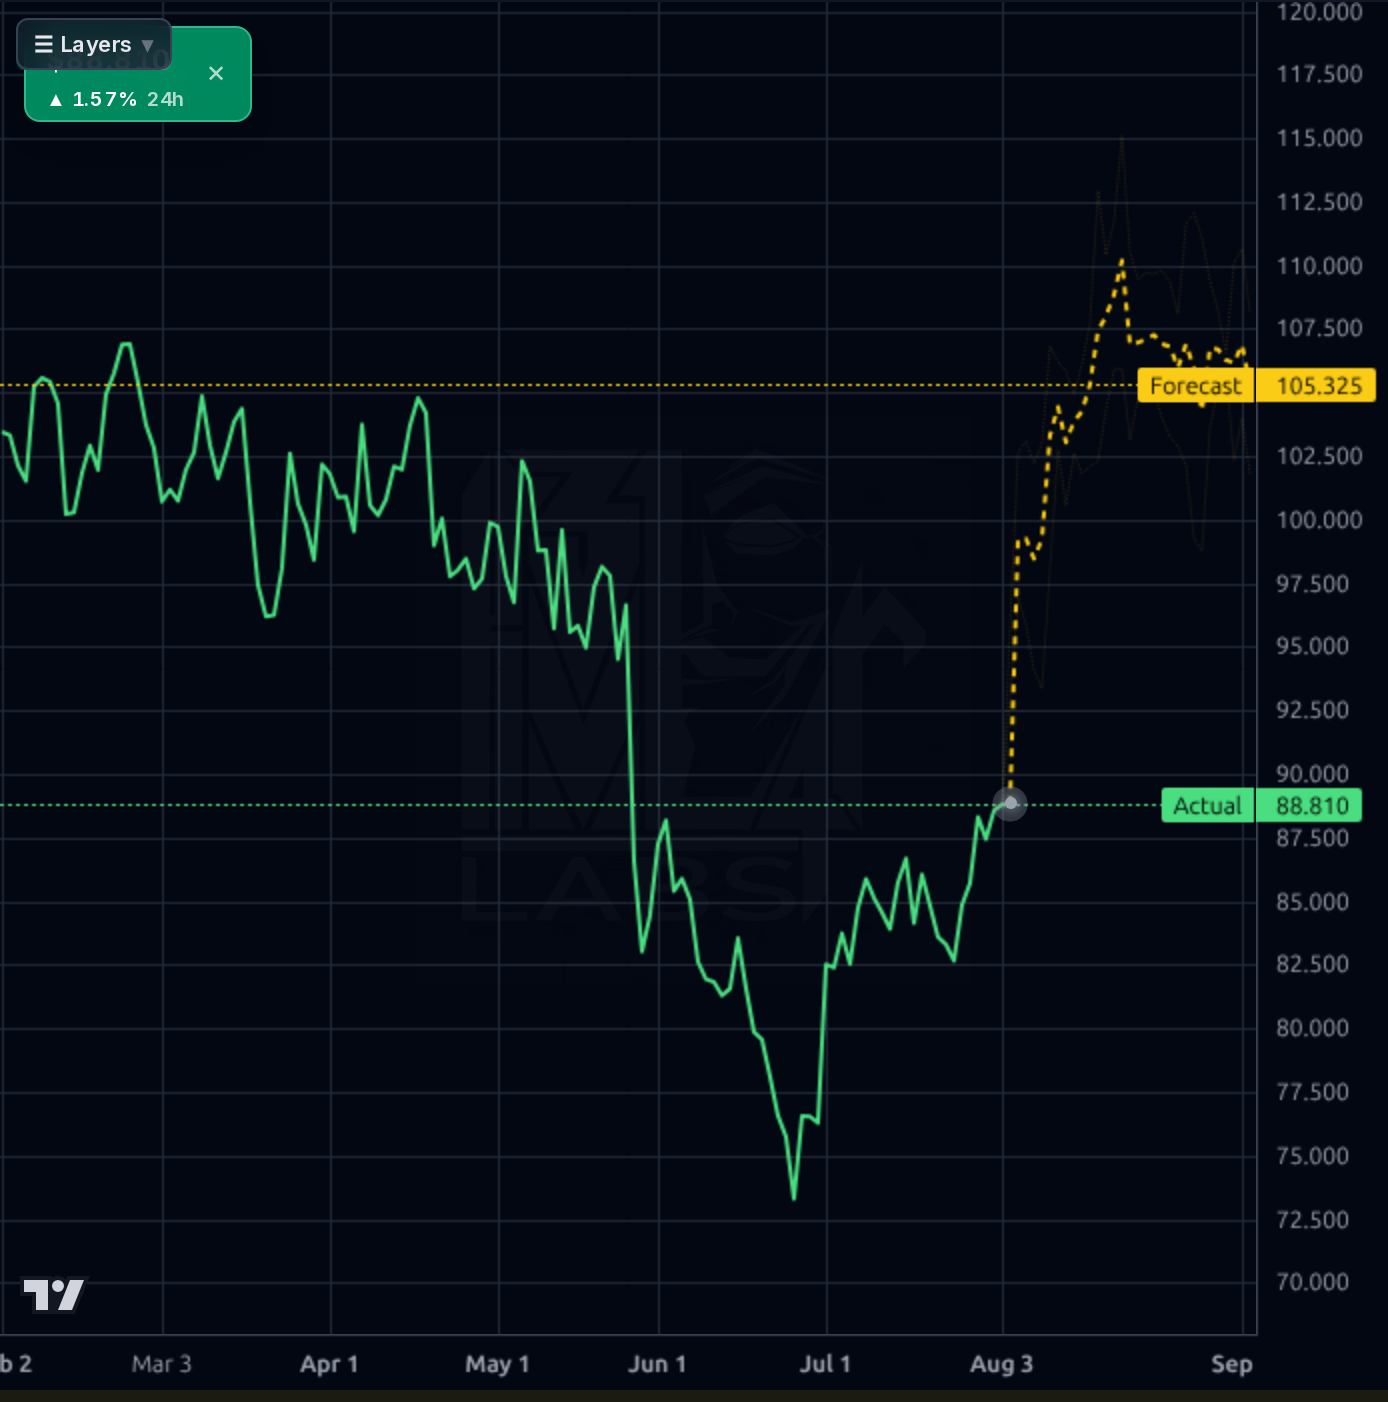
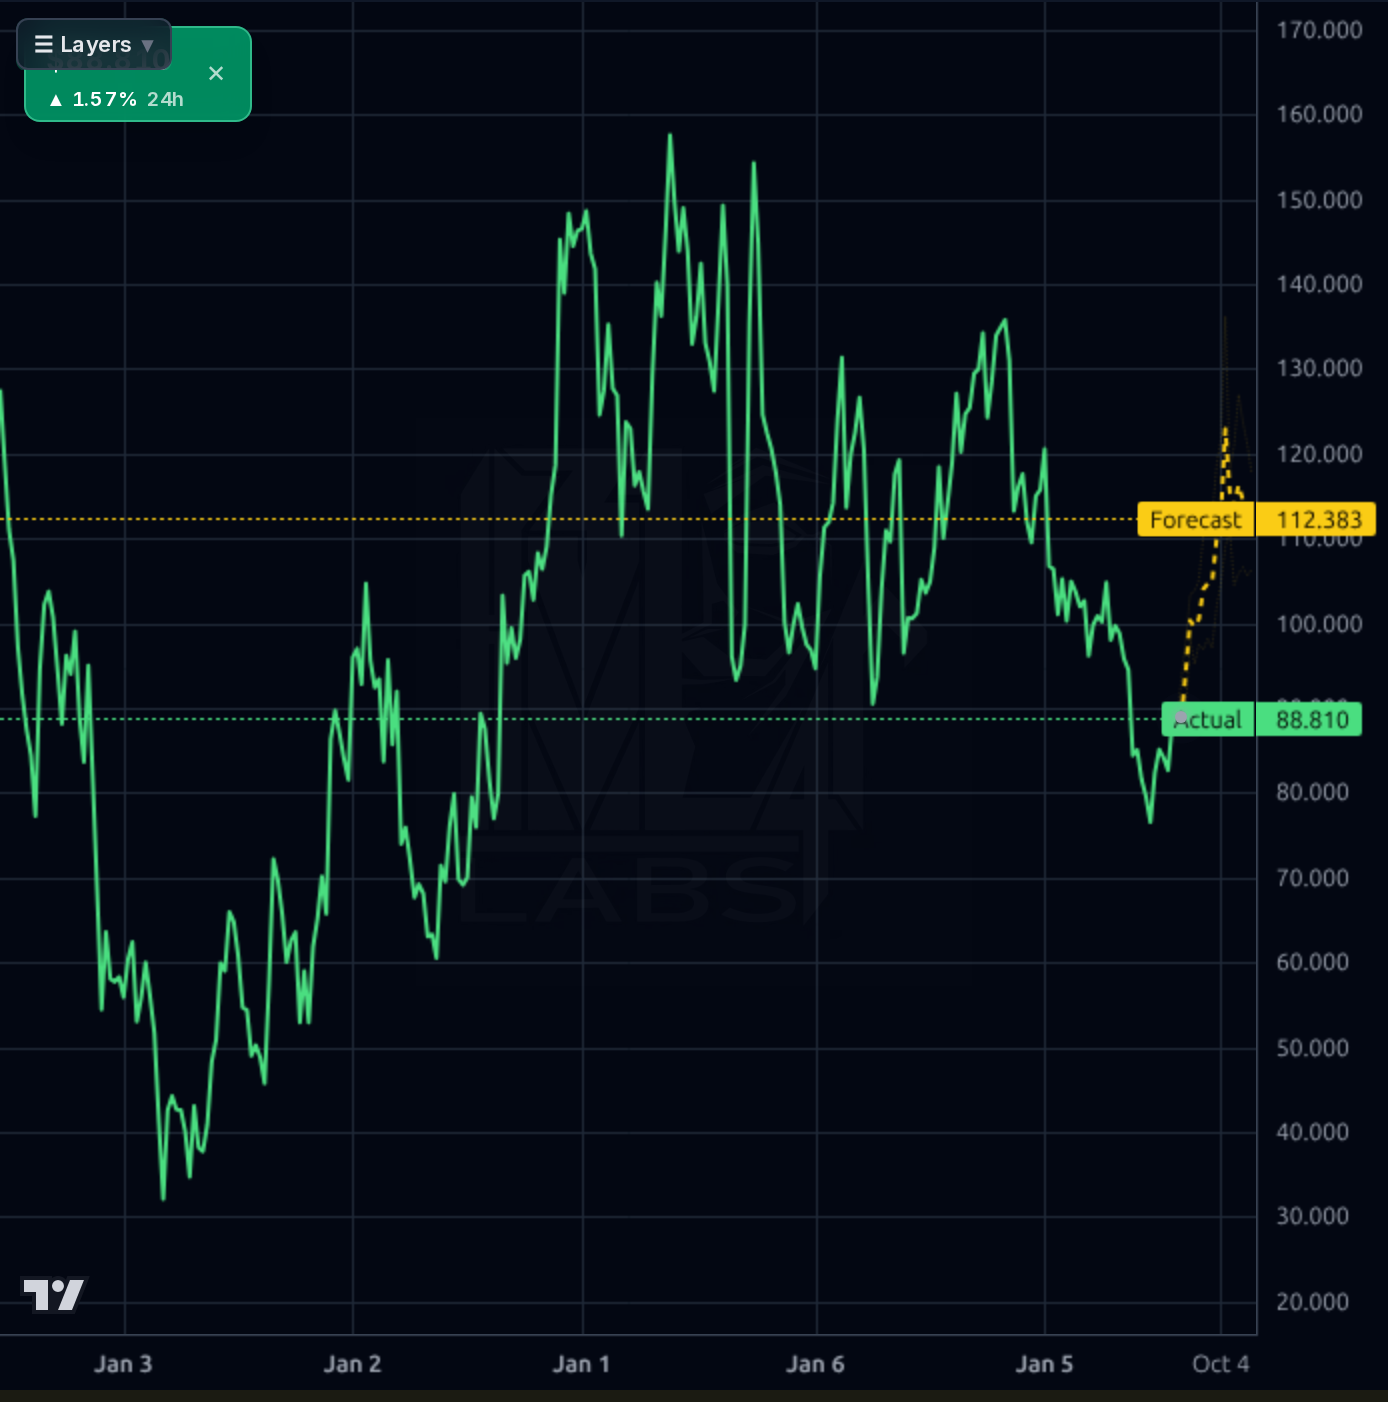
1-4 week view: ACCUMULATE on weakness into $84-86; do NOT chase into $92 resistance. The August 25 Q2 earnings print is a binary event ~22 days away — do not build a full position ahead of it. Trim/pause new adds if price rips to $92-95 pre-print (that becomes a chase into IV crush). Invalidation: decisive break below $84 with volume, or a pre-announcement warning. Any 1-4 week target is pre-earnings only. If a starter position exists, hold through the print with defined downside tolerance to $75.
1-6 month view: The Q2 print dictates the path. Bull case: operating margin stabilizes at or above 18.4% and revenue re-accelerates → re-rating toward $100-110 as fwd P/E expands from 7.2x to ~8-9x. Base case: another modest margin step-down but revenue growth intact → stock chops in $80-95 range, mean-reverting to $92-96 over 3-6 months. Bear case: fifth consecutive margin compression quarter + guidance cut → retest of $75-78 floor. Expected return range: -12% to +25% depending on print. Change of mind: sustained margin recovery + first-ever capital return announcement would shift this to a BUY with $110+ target.
1-3 year view: Terminal thesis rests on whether Temu's supply-chain buildout (local warehousing, fulfillment) creates a durable moat justifying re-rating to 12-15x earnings, OR whether structural competitive pressure (Alibaba, Shein, TikTok Shop) and regulatory constraints (de minimis elimination, EU DSA, potential ADR delisting) permanently cap the multiple at 7-9x. The $123B cash pile is either latent shareholder value waiting to be unlocked via buybacks/dividends, or a trapped balance sheet reflecting VIE structure limitations. Biggest structural risk is the VIE/ADR delisting scenario — this is a tail risk that cannot be fully hedged and warrants sizing discipline (position cap 3-5% of portfolio). Multi-year fair value $110-140 in a benign regulatory scenario.
PDD's fundamentals present a bifurcated picture. On the strength side: TTM revenue of RMB 442B, 56% gross margins, 25.5% ROE, 22.1% ROIC, and a fortress balance sheet with RMB 436B cash ($52/share net cash) against just RMB 5B debt — debt/equity of 0.01. Trailing P/E of 9.65 and forward P/E of 7.15 with PEG of 0.64 make this statistically cheap. However, the trend is deteriorating: operating margin has compressed for four consecutive quarters (24.8% Q2'25 → 23.1% Q3'25 → 21.1% Q4'25 → 18.4% Q1'26), Q1'26 net income fell 15% YoY to RMB 12.5B, and EPS Q/Q is -10.4%. The Q1 EPS miss ($1.38 vs $2.13-$2.40 consensus) was a material disappointment. Free cash flow of RMB 71.6B TTM remains robust, but capital allocation is a glaring issue — zero shareholder returns despite the massive cash pile is now a legitimate governance concern rather than optionality. The August 25 print will confirm whether the margin trough has been established or whether the deterioration continues.
The multi-timeframe picture shows constructive short-term momentum against a broken longer-term structure. On the 1h chart, price broke decisively above the $84-86 shelf to $88.56 with a clean upward step. The 4h and 1d charts show the stock has rallied ~20% off the sub-$75 late-June low, reclaiming the $84-88 support zone that had previously been resistance. RSI at 60.12 is constructive but not overbought, and price sits +4% above SMA20 and +5.3% above SMA50 — momentum is confirmed short-term. However, price remains -14.7% below SMA200 and -36.5% below the 52-week high of $139.41, so the weekly chart shows this is still a deep drawdown/basing pattern, not a confirmed trend reversal. The forecast band is aggressively bullish across all timeframes ($100+ on 1h, $105 on 4h/1d, $112 on 1wk), but historical MAPE of 19% on 1d and directional accuracy essentially matching the naive baseline suggests this bullish band should be heavily discounted. Critical resistance sits at $92 (gap fill zone that retail is watching), with $95-96 as the next major hurdle. Immediate support at $86, then $84, with the real floor at $75-78.
Signal: The Q1 2026 miss (revenue $15.4B vs $15.9B est, EPS $1.38 vs $2.13-$2.40 est) and 15% YoY net income decline are the dominant fundamental narrative, compounded by Temu regulatory actions in the EU (fines) and the Texas AG 'spyware' lawsuit filed in February. YTD performance is -21.9%, reflecting the market's pricing of margin compression and regulatory overhang. Recent Zacks/Yahoo coverage frames the stock as attracting renewed investor attention with mixed trading action, and one value-focused piece highlights the zero-debt, low-P/E setup as a compelling opportunity. Noise: The social media chatter (75% bullish crowd, gap-fill setups, breakout scans) is momentum-chasing retail positioning that historically fades quickly on Chinese ADRs and should be treated as contrarian. Broader market context (DEX volumes, Alibaba AI models, Bitcoin whale movements) is irrelevant to PDD-specific thesis. The key un-priced catalyst remains the August 25 Q2 print — analyst consensus PT of $117.75 (+32% upside) and bull cases of $170-$202 are contingent on margin stabilization that has not yet been demonstrated.
- August 25 Q2 print misses again — fifth consecutive operating margin compression quarter would invalidate the deep-value thesis and trigger retest of $75-78
- US de minimis rule elimination materially damages Temu unit economics (core cost advantage on sub-$800 shipments)
- EU DSA enforcement and Texas 'spyware' lawsuit escalate into material fines or operational restrictions on Temu
- VIE structure and ADR delisting tail risk — unhedgeable structural overhang on all Chinese ADRs
- SAMR anti-monopoly investigation in China could force operational changes or fines
- Zero capital return continues indefinitely — RMB 436B cash pile becomes a valuation drag rather than optionality
- Intensifying competition from Alibaba, Shein, TikTok Shop pressures both domestic and international margins
- Forecast model historical directional accuracy (61% at 1d, matching naive baseline) suggests the aggressive bullish forecast band ($100-112) should be heavily discounted
Get AI analysis on any stock
This is one of hundreds of Kronos AI reports — scored fundamentals & technicals, bull/base/bear price targets, a multi-horizon plan, and continuously-updated forecasts across the market. Create a free account to explore them all.
Create your free account →Already a member? Sign in · Join our Discord