PGY — AI Stock Forecast & Price Targets
Published 9/16/2026 · A free sample of K3vl4r’s AI-powered analysis.
Kronos price forecasts, scored fundamentals & technicals, and a multi-horizon plan.
View the live PGY price forecast →
Pagaya combines genuine fundamental momentum — record Q2 net income of $45.3M, 22% operating margins, $71M FCF — with a demonstrably cheap valuation (fwd P/E ~9, PEG 0.18) and a technical structure that just broke out from an 18-24 consolidation into the low $20s. Insider selling clusters and a 16% short float temper enthusiasm, but the setup favors continued accumulation with disciplined risk around $19-20 support.
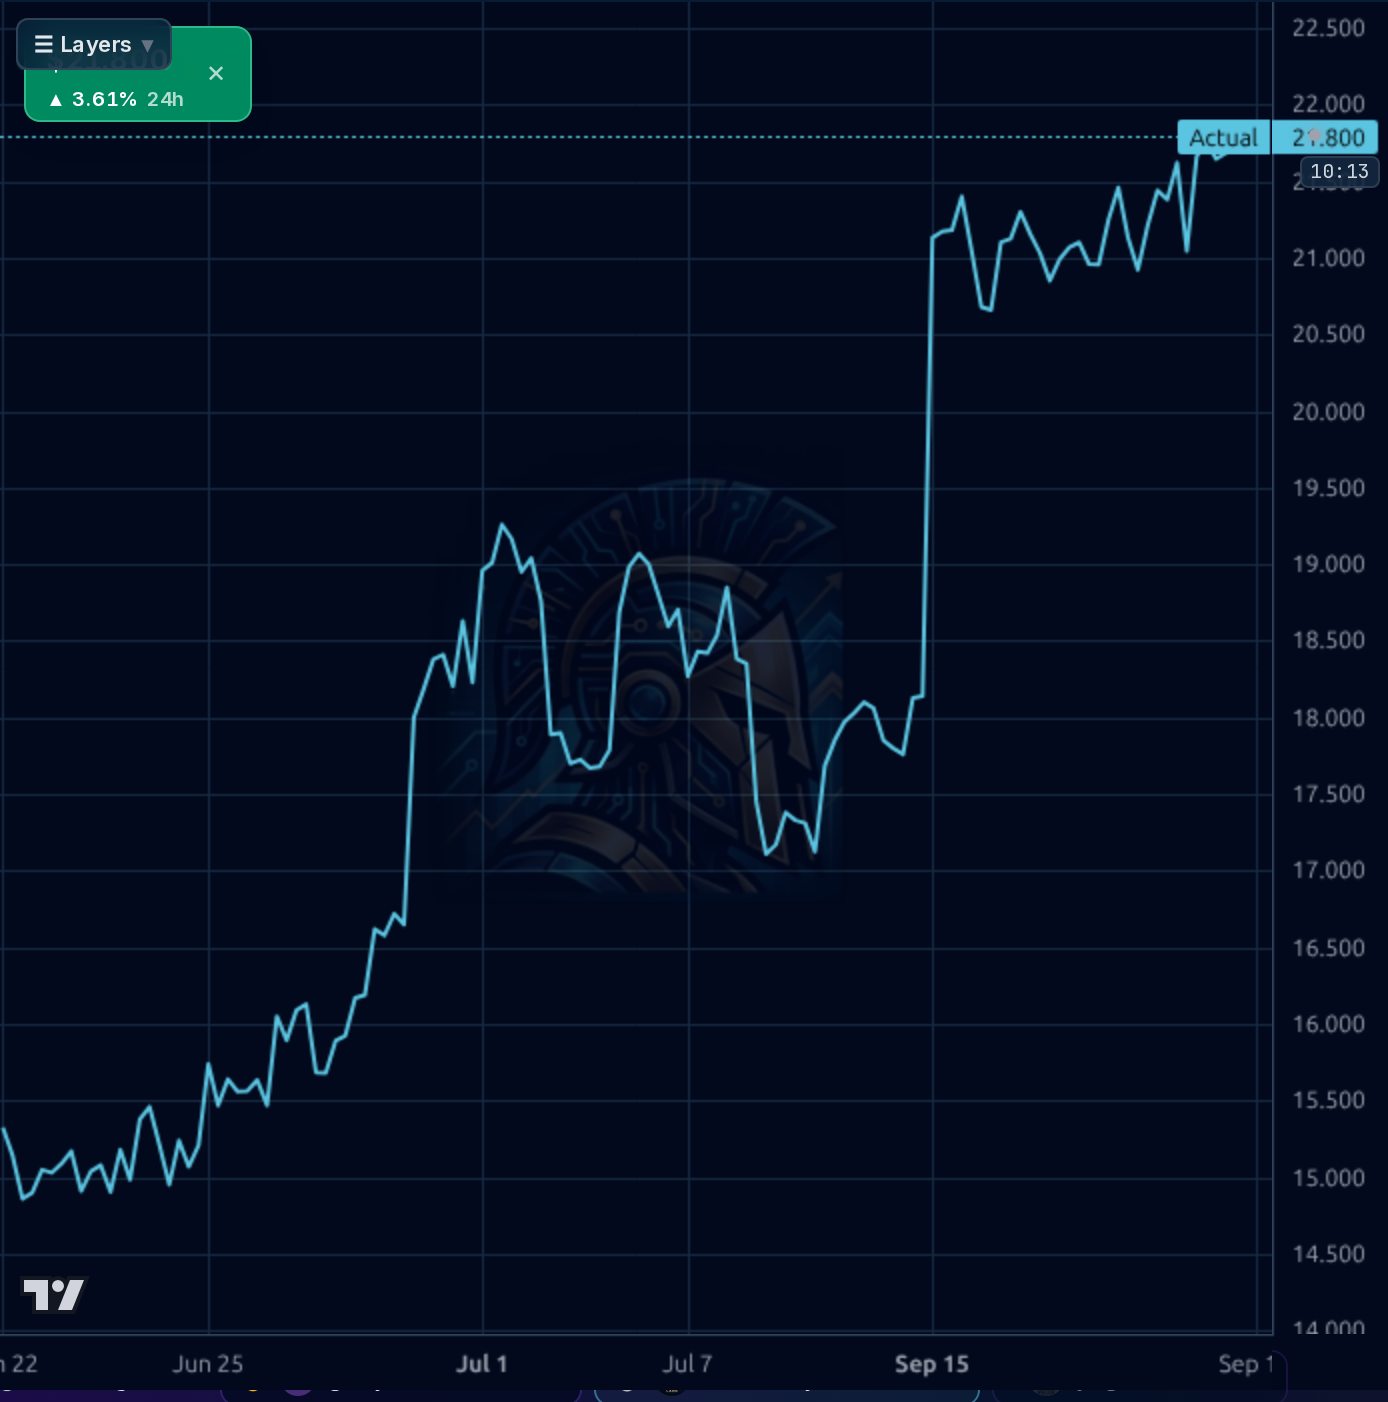
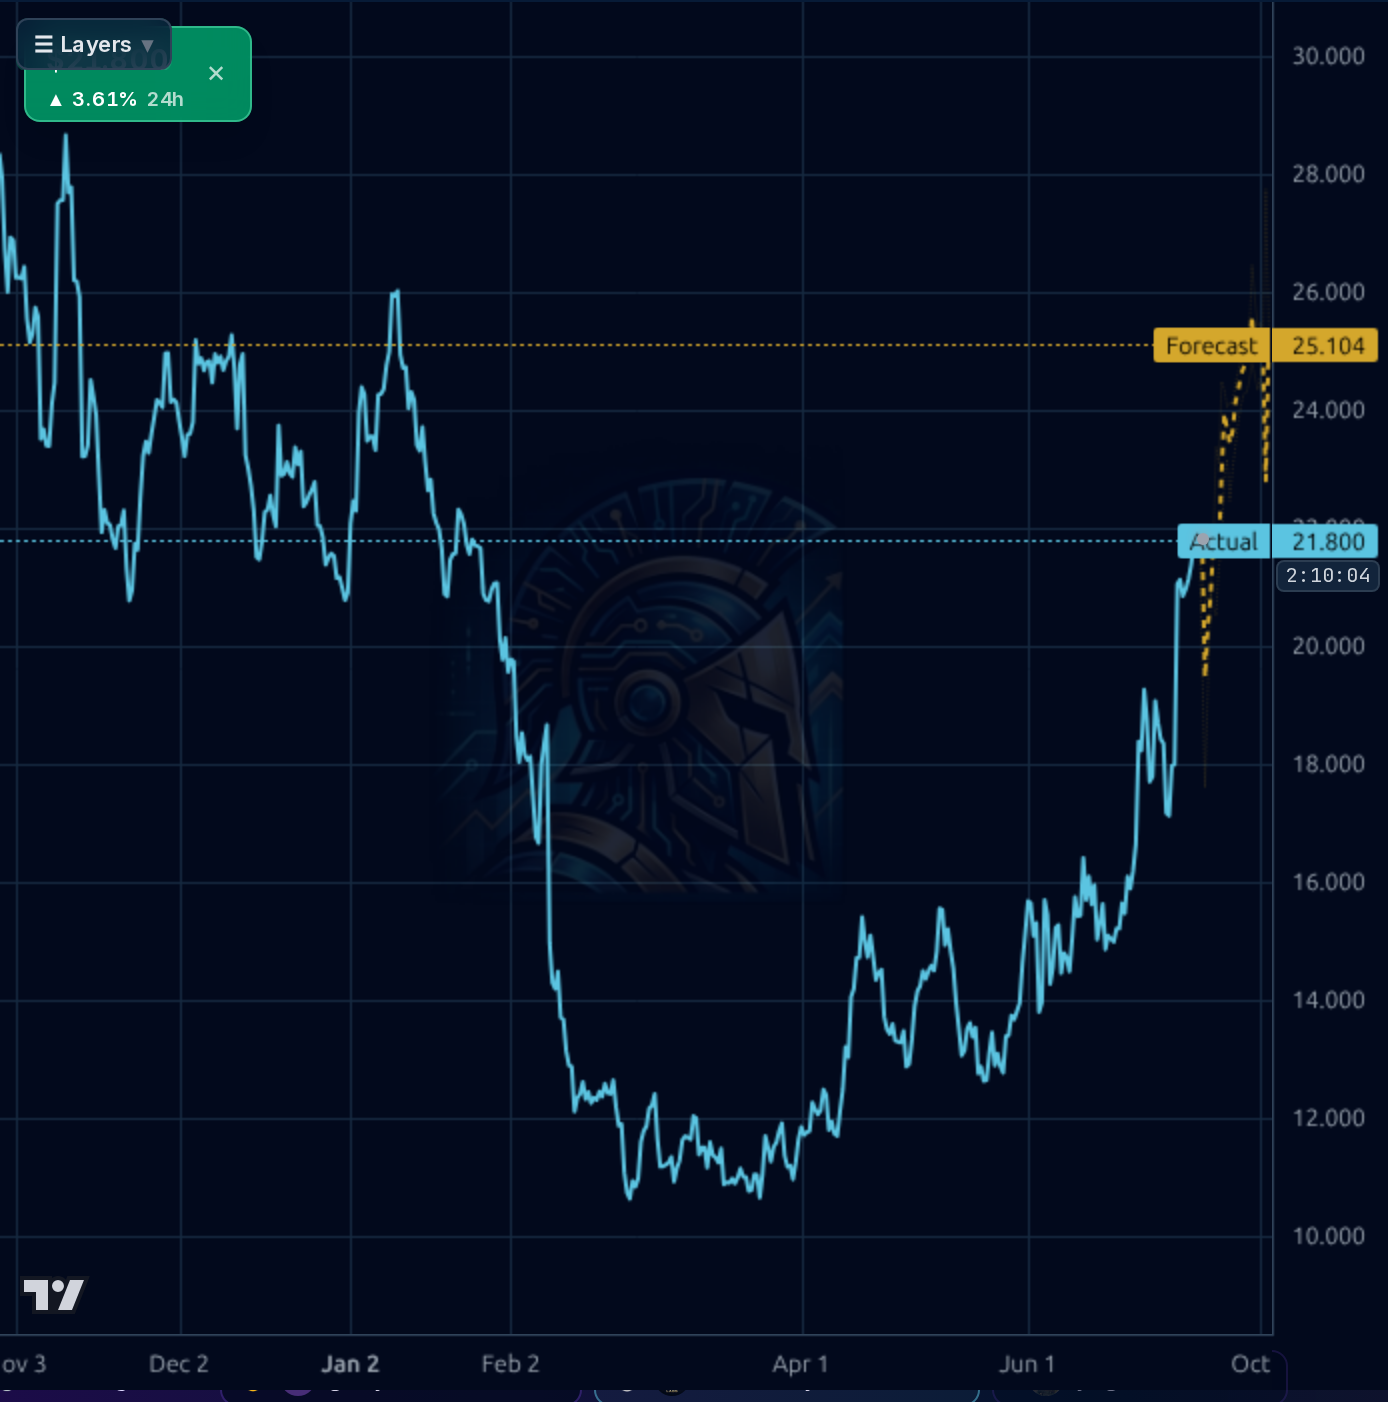
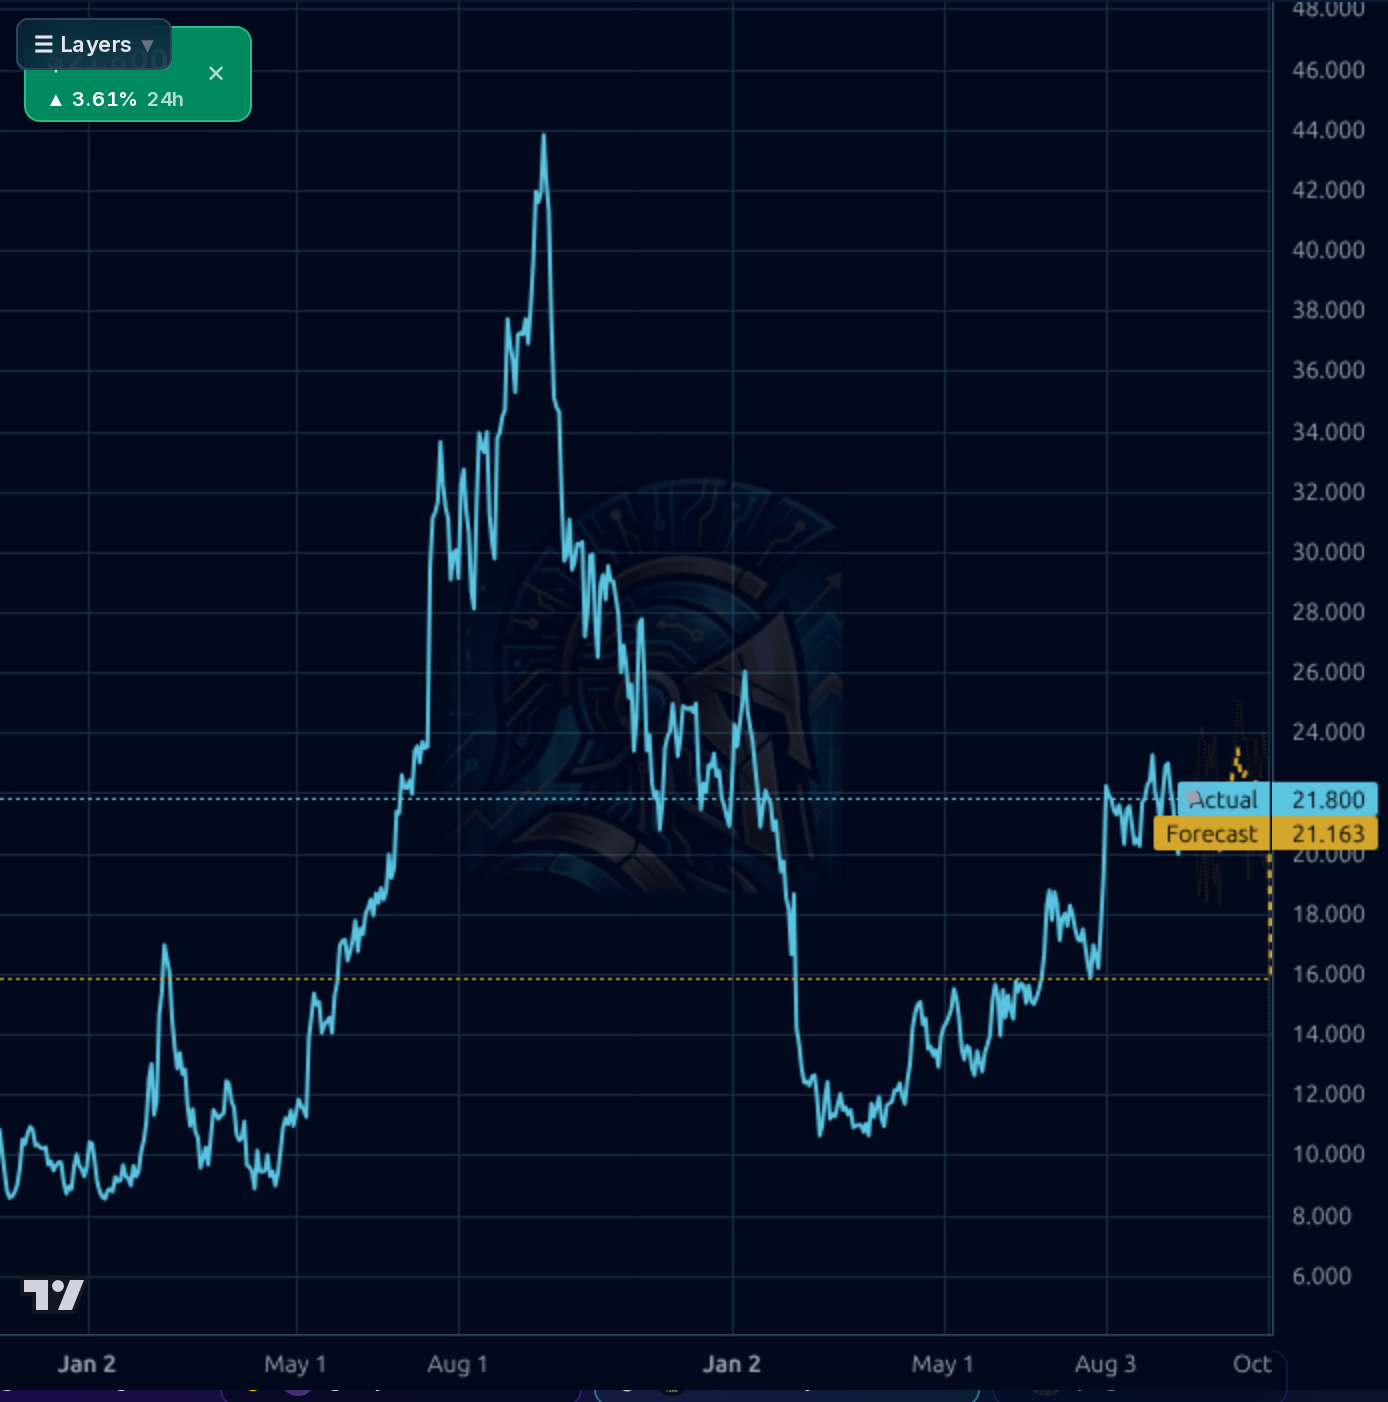
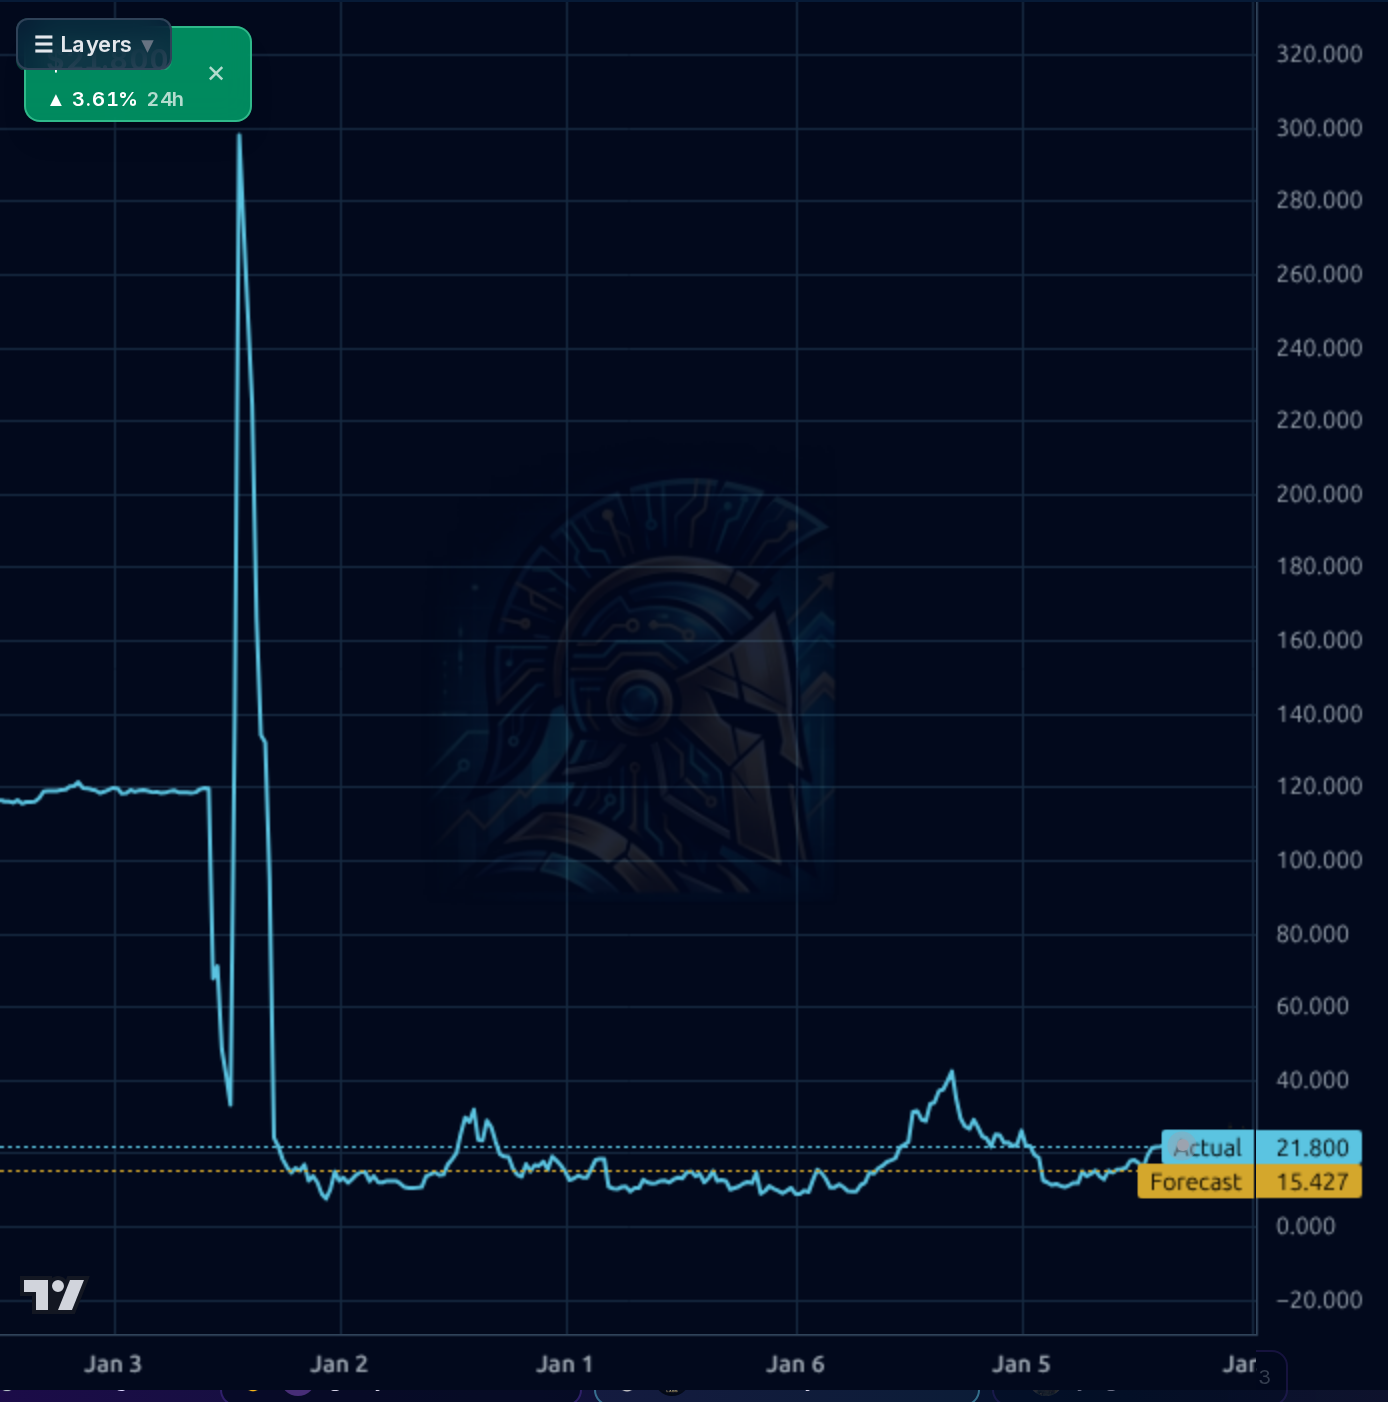
1-4 week: The breakout from the $18-24 range into $21-22 is intact and the 1h/4h forecast bands point marginally higher toward $25. Enter or add on pullbacks to $20.50-21.00; stop below $19.50 (invalidates the breakout retest). First target $23.50-24.00 (August high). Size at ~60% of a normal position given beta 5.37 and 16% short float — moves will be violent in both directions. If price closes back inside the range under $19.50, step aside and re-evaluate.
1-6 month: Base case is a grind toward $26-29 (analyst target $29.25, fwd P/E rerating from 9 to ~11-12 on continued earnings execution). Catalyst path: Q3 print on Nov 10 must confirm the sequential net income progression ($45M+ again would justify a fwd P/E rerating); Neuberger $700M forward flow auto-loan agreement should begin contributing to origination volume. Expected return range +15% to +35% base case, with -20% downside if Q3 disappoints or leverage concerns re-emerge. Change my mind if: net income reverses lower Q/Q, another meaningful institutional ownership drop (37% → sub-33%), or a downgrade cycle begins.
1-3 year: If Pagaya can hit CFO's 2027 run-rate targets while sustaining 20%+ operating margins, this is a $35-45 stock — the fundamentals justify a Software-Infrastructure multiple that's currently absent. Multi-year drivers: auto lending TAM expansion, ABS deal flow, decline-monetization network effects, and continued mix shift toward asset-light fee revenue. Biggest structural risk is a consumer credit downturn hitting loss rates in the underlying loans Pagaya originates — 133% D/E means the equity gets squeezed hard in a real credit cycle. Secondary risk is regulatory (CFPB-style fintech lending scrutiny). This name should be sized as a higher-vol growth position, not a core holding.
The fundamental trajectory is clearly improving: Q2 2026 revenue of $365.6M grew 22% sequentially from Q1's $299M and is the highest print in the four-quarter series, with net income scaling from $22.5M (Q3 25) → $34.3M → $24.7M → $45.3M in Q2 26, a genuine profitability inflection. Operating margin expanded to 23.1% and TTM EBITDA hit $351.6M against $1.39B revenue. Free cash flow was $71.3M in Q2 alone ($207M TTM), which at a $1.81B market cap implies a P/FCF near 7 — extremely cheap for a name growing top-line ~18% Y/Y with 26% ROE. The balance sheet is the asterisk: $907M total debt against $594M equity (D/E 1.58, or 133% on Yahoo's figure) is heavy, though $1.29B total cash and a 14.6x current ratio mitigate near-term liquidity risk. Capital allocation looks disciplined — capex is tiny (~$3M/qtr), and the model appears to be scaling asset-light. The clean broken piece is leverage and dilution history; the working piece is that GAAP profitability is now real and sustained across four quarters.
Across timeframes the picture is mixed-to-constructive. The 1h chart shows a clean vertical repricing from ~$17.50 into the $21-22 zone in mid-September with actual price at $21.80, printing higher highs. The 4h chart confirms this as a base breakout from a broad November-August range with the forecast band pointing to $25.10 near-term. The 1d chart shows price reclaiming the $20 shelf that had been resistance since May and sitting well above the yellow $16 forecast floor — SMA50 +8.2% and SMA200 +25.4% confirm the uptrend. RSI at 53 is neutral, leaving room to run. Key support: $19.50-20.00 (breakout retest), then $17.50 (July pivot). Resistance: $23-24 (August highs) then the $25-26 zone. The 52-week high at $44.99 vs current $21.64 shows how much air remains below prior peaks — but also how brutally this name can unwind. The 1d model forecast at $21.16 essentially agrees with spot (neutral), while the 1wk model shows only 20% bullish probability — but its 1wk MAPE of 31% and directional accuracy tied with naive baseline means that signal should be heavily discounted. Beta of 5.37 means directional moves in either direction will be amplified.
The signal in the news is a genuine profitability milestone: Pagaya reported a record $45M GAAP net income in Q2, which is being framed by financial media as the moment AI lending 'finally works' for this name. Multiple sell-side comparison pieces (vs ENVA) highlight the asset-light model, lower valuation, and stronger ROE — this is exactly the narrative catalyst a deeply-discounted growth name needs. Chartmill flags a growth+valuation+technical trifecta setup. The noise: a $53M seed round for an unrelated AI firm, Amtrak funding, and generic short-interest reports on unrelated tickers. The only 8-K in 30 days is a routine annual meeting vote (Item 5.07) — no material corporate action. More concerning is the insider selling cluster: CFO, President (Das), CAO, and a director all sold in early September ($524k combined) following larger August sales ($1.1M from Das and Rosen combined). This is not conviction-building; it's noise-elevated but persistent enough to note as a caution flag, particularly the President-level selling.
- Neuberger Specialty Finance forward flow agreement — up to $700M of auto loans, per Stocktwits-reported news; validates auto lending diversification thesis
- Sequential GAAP profitability scaling: $22.5M → $34.3M → $24.7M → $45.3M net income across last four quarters
- Free cash flow ramp: $63.8M → $76.7M → $40M → $71.3M quarterly; TTM FCF now $207M against $1.81B market cap
- Operating margin expansion from ~20% to 23.1% in latest quarter with room toward 27%+ on flagship product Decline Monetization scaling
- Analyst consensus 1.00 (strong buy) with $29.25 target = 35% upside; fundamental rerating catalyst if PEG 0.18 gets recognized
- High leverage: $907M debt vs $594M equity (D/E 1.58); credit cycle downturn would squeeze equity hard given beta 5.37
- Insider selling cluster: President, CFO, CAO, and director all sold in September ($524k) after $1.1M August sales — not confidence-inspiring
- Institutional ownership dropped 5.3pp (42.5% → 37.2%) in August — meaningful bearish structural signal
- Short float 16% and short ratio 3.45 days — squeeze potential exists but also reflects real skepticism
- Consumer credit deterioration in the underlying loans Pagaya originates would hit both fees and any retained risk exposure
- Fintech regulatory overhang (CFPB, state-level lending rules) remains persistent
- 52-week performance -48% shows how quickly sentiment can reverse; 1wk model bullish probability only 20%
Get AI analysis on any stock
This is one of hundreds of Kronos AI reports — scored fundamentals & technicals, bull/base/bear price targets, a multi-horizon plan, and continuously-updated forecasts across the market. Create a free account to explore them all.
Create your free account →Already a member? Sign in · Join our Discord