PTC — AI Stock Forecast & Price Targets
Published 9/11/2026 · A free sample of K3vl4r’s AI-powered analysis.
Kronos price forecasts, scored fundamentals & technicals, and a multi-horizon plan.
View the live PTC price forecast →
PTC is a best-in-class PLM/CAD compounder (84% gross margin, 35% ROE, ~$1B FCF) trading at 14.5x fwd P/E and 38% below its 52-week high after a brutal 13.7% weekly drop back to $128.72. The technical setup is oversold (RSI 32.8) but the tape is structurally broken (below all major MAs, L1 sales estimate cut), and prior bull targets in the $158-172 zone have repeatedly failed to print — favor accumulating in tranches rather than chasing a bounce.
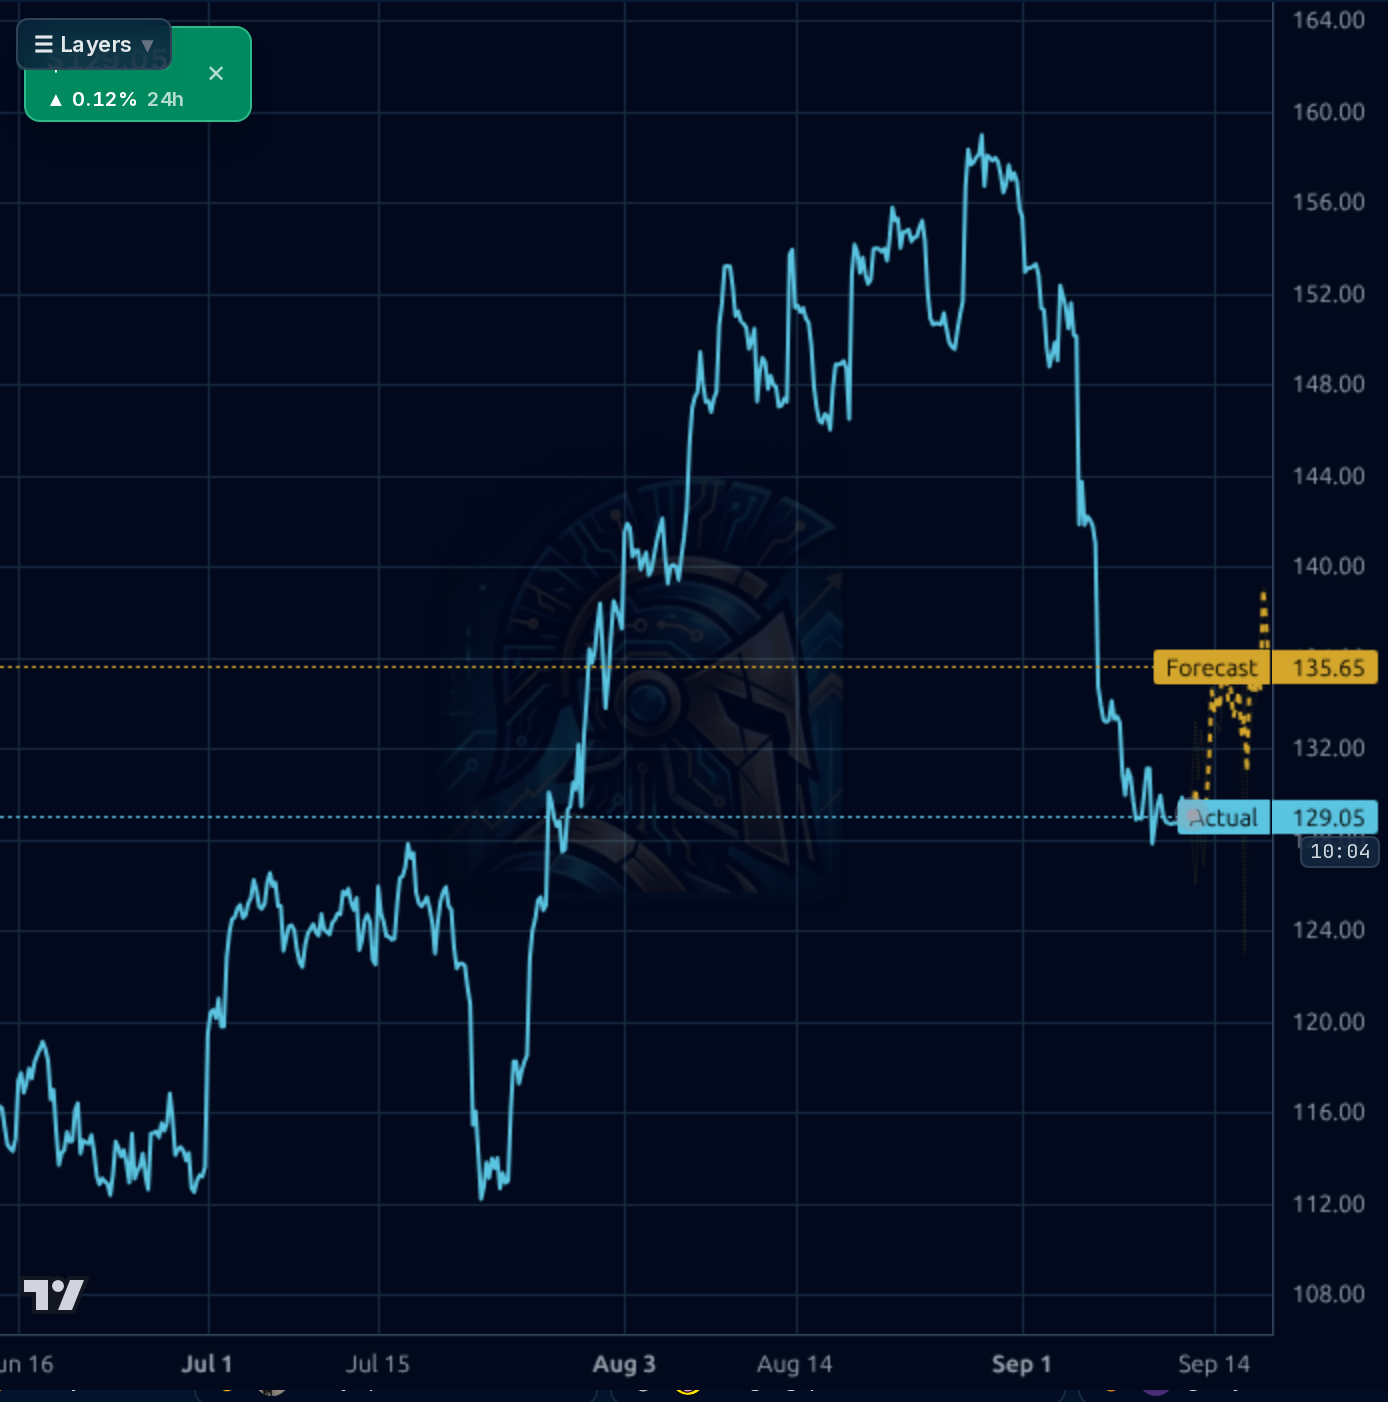
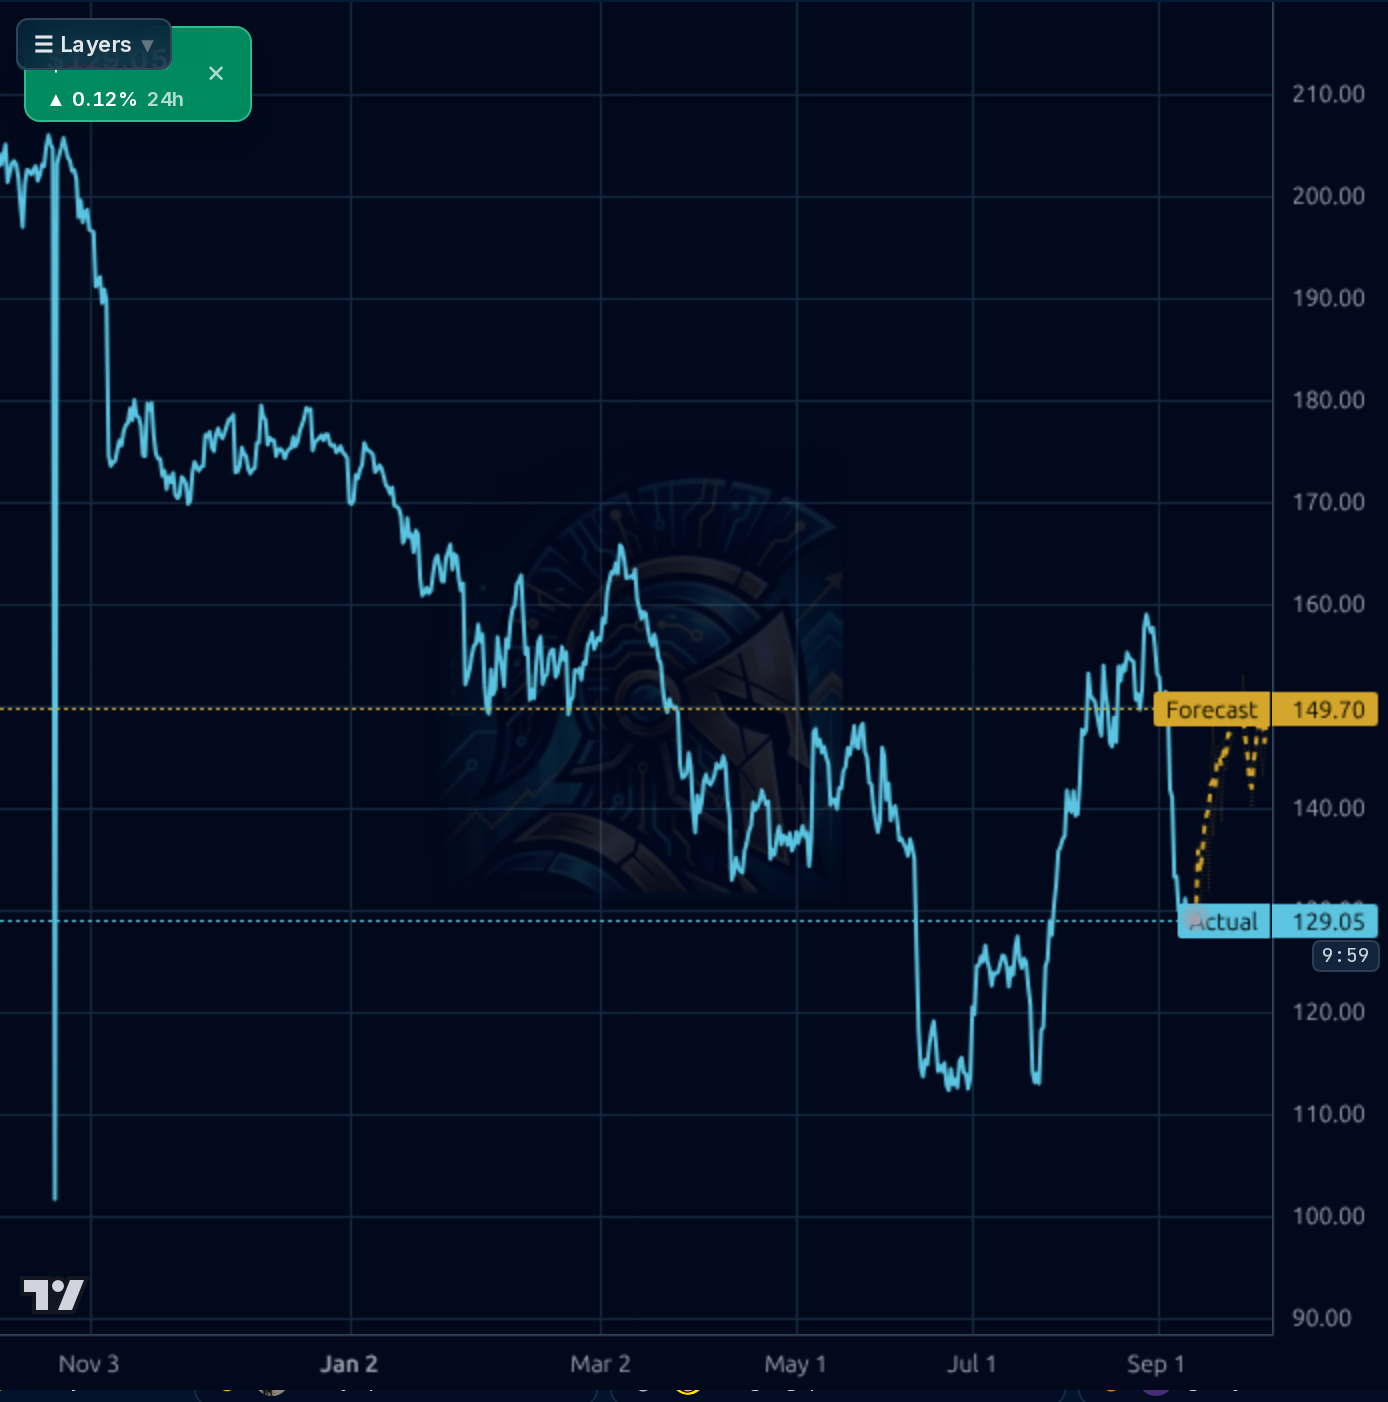
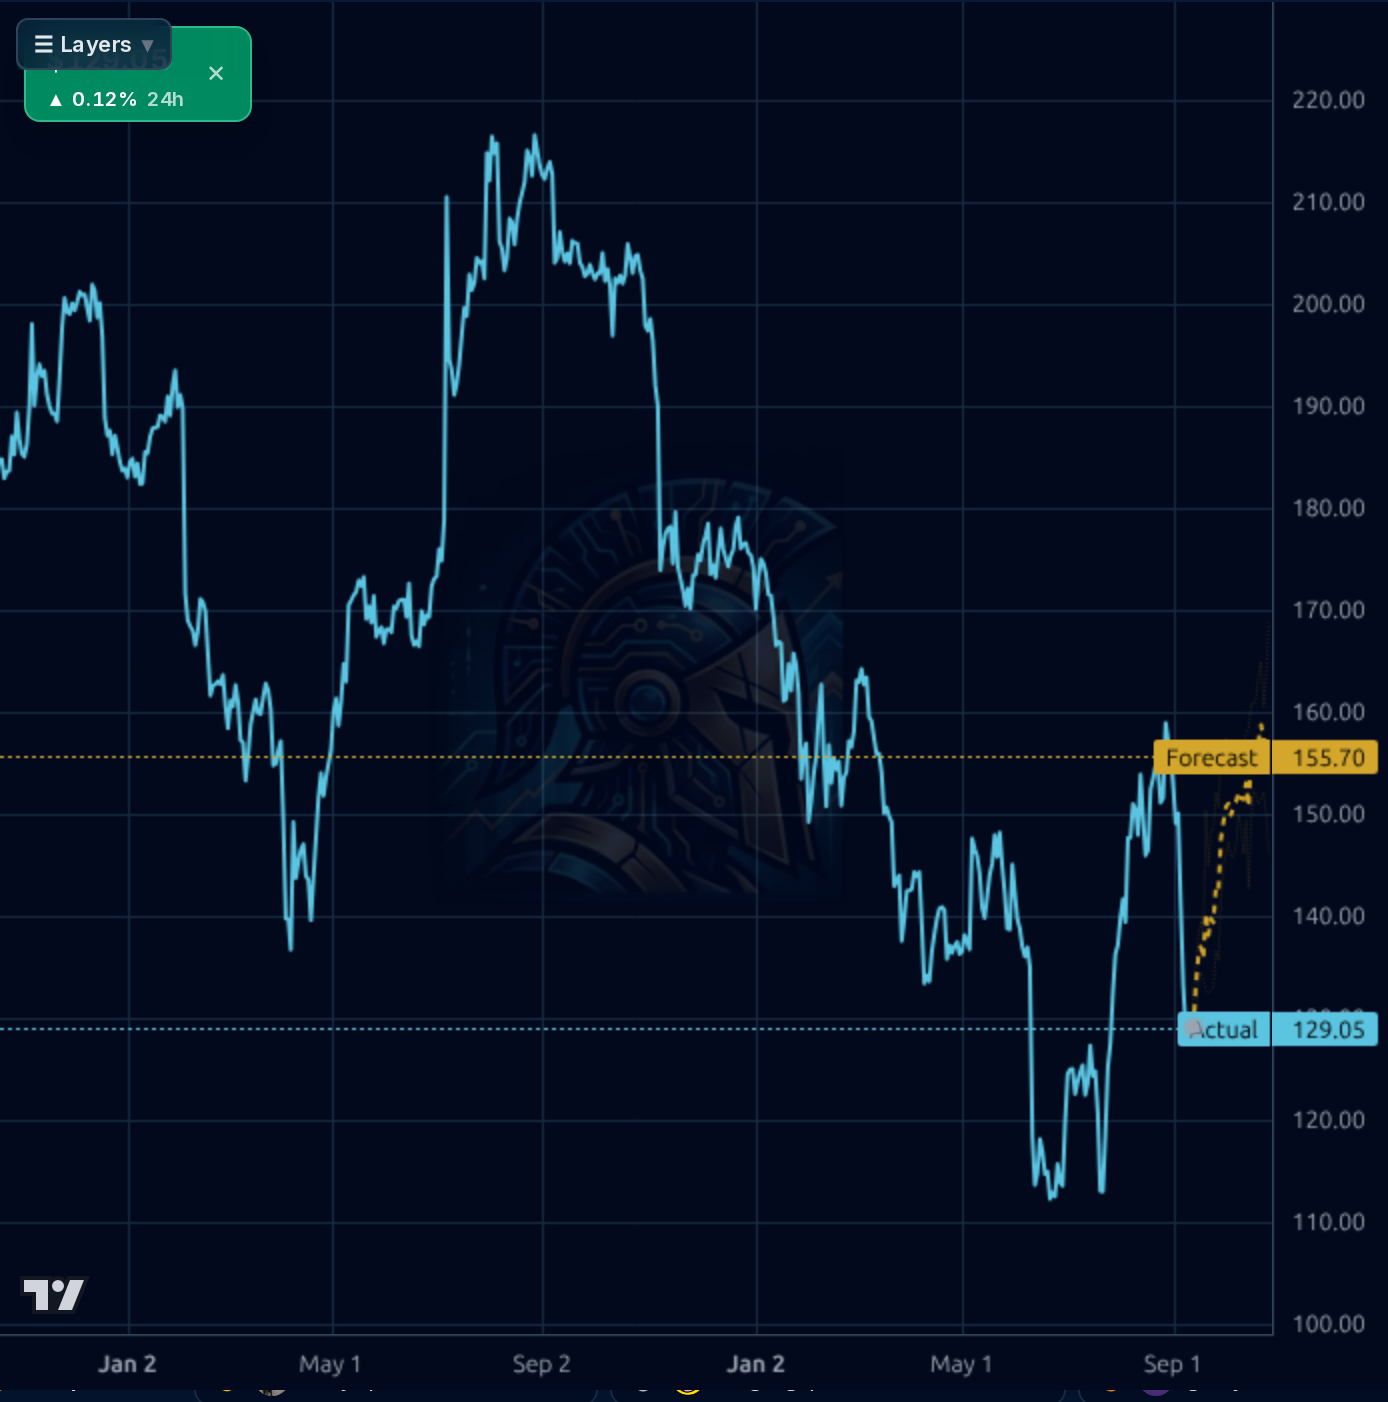
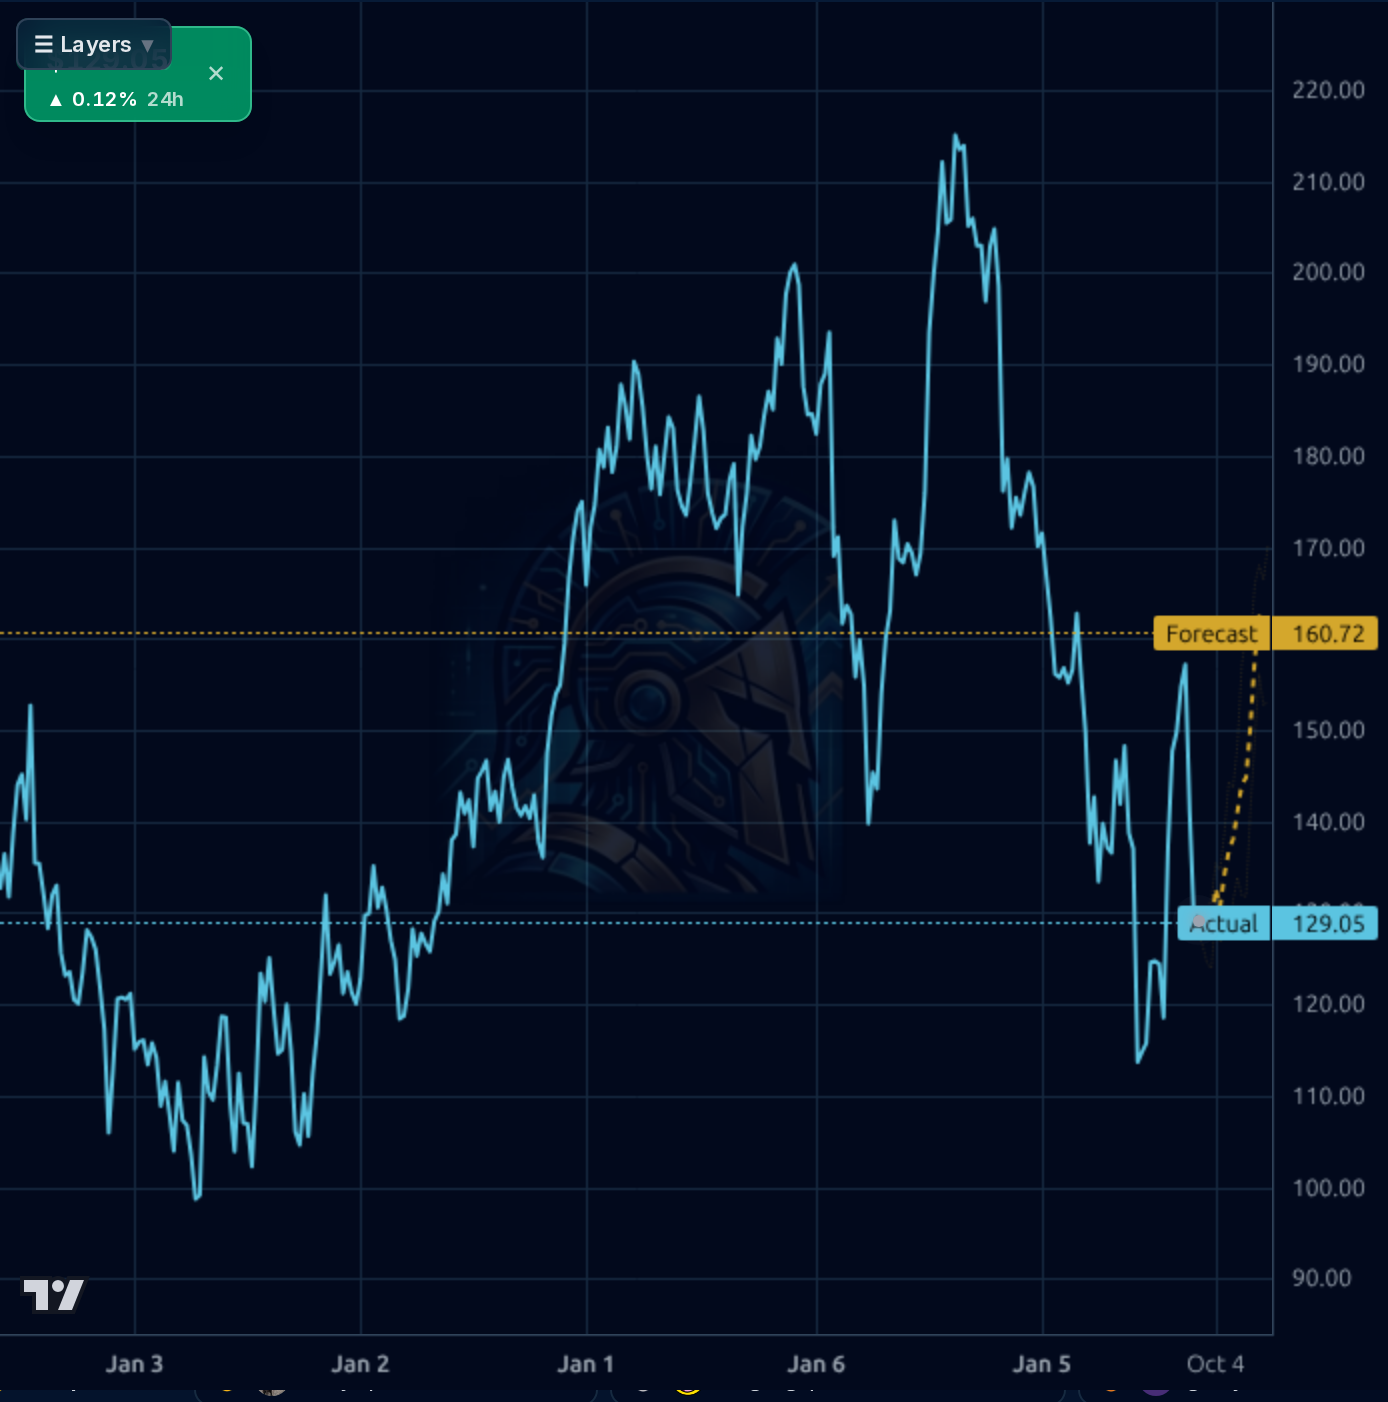
1-4 week view: Do not chase. Price is testing critical $128 support with negative momentum and no confirmed reversal. Prefer a first tranche (25-33% of intended position) at $126-129, adding a second tranche on either (a) a reclaim of $135 with volume, or (b) a flush to $118-120 that holds. Invalidation: a daily close below $118 opens the door to the $108-113 July lows and negates the mean-reversion setup. Stop discipline: if entering at $128, hard stop $116 (~9%). Key resistance: $135 / $142 (SMA50 area) / $148.
1-6 month view: The setup rewards patience. The Nov 11 earnings print (~61 days out) is the dominant near-term catalyst — a beat/raise on organic ARR above the 9.25% guide would likely unlock a re-rating toward $148-155; a miss or guide-down would confirm the L1 sales-cut signal and open $108-118. Expected return range from current $128.72: bear -12%, base +12-15%, bull +25%. Watch working capital normalization in the Q4 report and institutional ownership trend (-5.2pp move on Aug 18 was bearish, needs to reverse). What would change my mind: a decisive daily close below $118 (structural break) or above $148 with volume (regime change).
1-3 year view: PTC remains a high-quality PLM/CAD/IoT compounder with defensible market positions (Windchill, Creo, ThingWorx, Onshape) in regulated end-markets (aerospace, auto, medtech) with real AI/digital-twin optionality. At 14.5x fwd P/E on a business generating $1B+ FCF with 35% ROE, the multiple is reasonable for a franchise of this quality. Multi-year drivers: continued SaaS transition (Onshape, Arena), AR/IoT monetization, industrial digitization tailwinds. Biggest structural risk: sustained deceleration in industrial capex and rising competition from Dassault/Siemens/Autodesk compressing pricing power. Base case is that patient accumulation at these levels compounds at low-double-digit returns over 3 years.
PTC's franchise economics remain elite: TTM revenue $2.95B (+19.5% Y/Y), gross margin 82.9%, operating margin 39.8%, net margin 41.7%, ROE 35.25%, ROIC 24.5%, and $1.03B TTM FCF. The most recent quarter (Jun-2026) shows some sequential softening — revenue $600M vs $774M prior quarter (though Q2 was inflated by a divestiture gain driving 76% net margin), operating margin compressed to 27.7% from 38.2%, and EPS Q/Q -11.9%. The balance sheet is adequate but weakened: cash fell from $439M (Mar) to $351M (Jun), total debt climbed to $1.61B (D/E 0.46), and working capital collapsed from $285M to $34M — a signal worth monitoring for structural vs. seasonal explanation. Capital allocation via aggressive buybacks (shares outstanding 108.5M) is directly EPS-accretive. Valuation is reasonable: 12.4x trailing P/E, 14.5x fwd P/E, EV/EBITDA 11.6x, P/FCF 14.95 — a discount to the software peer group given the quality profile, though PEG 2.05 tempers the 'cheap' narrative given only 7% forward EPS growth expectations.
The tape is decisively broken across all short/medium timeframes. Price $128.72 sits -13.3% below SMA20, -6.4% below SMA50, -13.1% below SMA200, with a -13.69% weekly performance, -14.4% monthly, and -26.1% YTD. The 1h chart shows a clean top formation near $160 in mid-August followed by a waterfall decline to test $128-129 support (near July lows). The 4h and 1d charts confirm the stock has round-tripped its entire summer rally and is now retesting the top of the pre-earnings base ($118-130 zone). RSI 32.84 is approaching but not confirming oversold — a weaker mean-reversion signal than the headline suggests. The AI forecast projects a modest bounce to $135-149 on shorter timeframes and $155-160 on weekly, but the model's own realized directional accuracy (55% on 1d, 67% on 1wk) trails the naive baseline — the forecast should be discounted. Critical levels: $128 must hold to prevent a retest of the $113-118 July lows; overhead resistance is layered at $135 (post-earnings pivot), $148 (SMA50), and the punishing $155-160 zone that has repeatedly rejected rallies.
The signal-to-noise on PTC-specific news is low. The most relevant item is a Sep 9 presentation at Citi's 2026 Global TMT Conference — no direct headline shock, but management commentary on ARR trajectory would matter. Sector-adjacent Autodesk (ADSK) news is telling: ADSK fell 16.6% in eight sessions despite beating and raising, illustrating that the market is punishing application-software names on any hint of decelerating growth or one-time-driven guidance — this is exactly the vulnerability PTC faces into its Nov 11 print. Two mid-cap stock roundups mention PTC without a clear bullish or bearish framing. Broader macro backdrop (rising yields, oil, CPI risk, deteriorating breadth at 46.7% >200dMA) is a headwind for high-multiple software. The most material fundamental-change signal remains the L1 sales-growth estimate cut from 27.8% to 19.5% on Jul 30 — a leading indicator that has historically preceded tape breakdowns on this name and is consistent with the current price action.
- Raised FY26 organic ARR guidance to ~9.25% provides a durable growth floor into the Nov 11 print
- Aggressive buyback cadence with shares outstanding at 108.5M directly accretive to EPS
- Onshape SaaS PLM platform expanding TAM into smaller mid-market customers with cloud-native product development
- ServiceMax service lifecycle management cross-sell into Windchill installed base
- AI/digital-twin monetization pathway signaled by recent deal announcements and industrial IoT tailwinds
- Japan Project PLATEAU participation signals continued government/enterprise digital-twin deployment wins
- L1 sales-growth estimate cut from 27.8% to 19.5% is a leading indicator that has historically preceded tape breakdowns on this name
- Working capital collapsed from $285M to $34M in one quarter alongside rising debt and falling cash — needs Q4 normalization
- $150-160 resistance has repeatedly rejected rallies; overhead supply is significant
- Sector read-through from ADSK (-16.6% in 8 days despite beat/raise) shows the market is punishing any application-software decel
- Nov 11 earnings is a binary catalyst; GAAP FY26 EPS guided down ~2.7% Y/Y due to divestiture drag
- Institutional ownership shed 5.2pp on Aug 18 signaling smart-money trimming
- Macro backdrop of rising yields, deteriorating breadth (46.7% >200dMA), and industrial capex slowdown pressures the core PLM customer base
Get AI analysis on any stock
This is one of hundreds of Kronos AI reports — scored fundamentals & technicals, bull/base/bear price targets, a multi-horizon plan, and continuously-updated forecasts across the market. Create a free account to explore them all.
Create your free account →Already a member? Sign in · Join our Discord