PTC — AI Stock Forecast & Price Targets
Published 7/21/2026 · A free sample of K3vl4r’s AI-powered analysis.
Kronos price forecasts, scored fundamentals & technicals, and a multi-horizon plan.
View the live PTC price forecast →
PTC is a bombed-out quality compounder at $124.83, ~43% off its 52-week high, with best-in-class 41.6% operating margins, 34.6% ROE and ~$986M TTM FCF — but the setup is entirely dominated by the binary July 29 earnings print (~7 days out). Accumulate below $125 remains disciplined, but do not size aggressively into the print; the $140-$145 resistance band has repeatedly failed and prior bull targets have systematically overshot reality.
Do NOT add into the July 29 AMC print — 7 days out is a binary IV-crush event and the model's 1wk edge is negative vs. naive. Hold existing accumulation from the $118-$125 zone. Levels: support $118 then $112; resistance $132 then $140-$145. Invalidation: a close below $115 on volume would break the working base and warrant trimming. Earnings stance: sit on hands into the print; react to the tape post-gap. If the print surprises to the upside with clear ARR acceleration, chase strength only on a reclaim and hold of $132.
1-6 month thesis is that a clean earnings print — specifically double-digit organic ARR growth with Codebeamer ALM quantified as a durable contributor — is the catalyst to close the gap toward $140-$145 first and then test $155. Absent that, the stock likely churns $115-$135 given the intact lower-high pattern. Expected return range: -10% to +20% depending on print. What changes my mind: any commentary confirming industrial CapEx budget compression or organic growth deceleration excluding acquired revenue would flip the call to HOLD/TRIM.
Over 1-3 years, PTC remains a high-quality software compounder with a defensible PLM/CAD moat (Gartner Leader), 40%+ operating margins, ~$1B FCF and optionality from AI integration (Creo AI Assistant) and ALM/IIoT expansion. If Codebeamer scales into a genuine second growth engine and Onshape/AI features drive seat expansion, the terminal fair value is materially higher than today. The biggest structural risk is that the PLM/CAD market matures faster than management can layer on new vectors, forcing continued M&A-dependent growth and multiple compression from the current forward P/E of 14.5.
PTC's franchise economics remain best-in-class: 83.1% gross margin, 40.6% operating margin, 41.8% profit margin, 34.6% ROE and 24.1% ROIC — hallmarks of a subscription PLM/CAD compounder. TTM sales of $3.0B grew 27.8% Y/Y and EPS Y/Y TTM is +187%, with EPS Q/Q at +270% — although these prints are flattered by the ServiceMax and Codebeamer acquisition contributions, which is why organic ARR disclosure at the July 29 print matters. FCF generation approximates $986M (P/FCF 15.5), supporting the modest 0.36 debt/equity balance sheet. Valuation is bifurcated: trailing P/E of 11.9 looks cheap, but forward P/E of 14.5 and PEG of 2.08 — against consensus EPS-next-5Y of only 6.99% — imply the market is skeptical of durable double-digit growth. EV/Sales 5.12 and EV/EBITDA 11.35 are reasonable for the quality tier. Capital allocation has favored M&A over dividends (payout 0%), which is defensible if Codebeamer/ServiceMax deliver but risks masking organic deceleration.
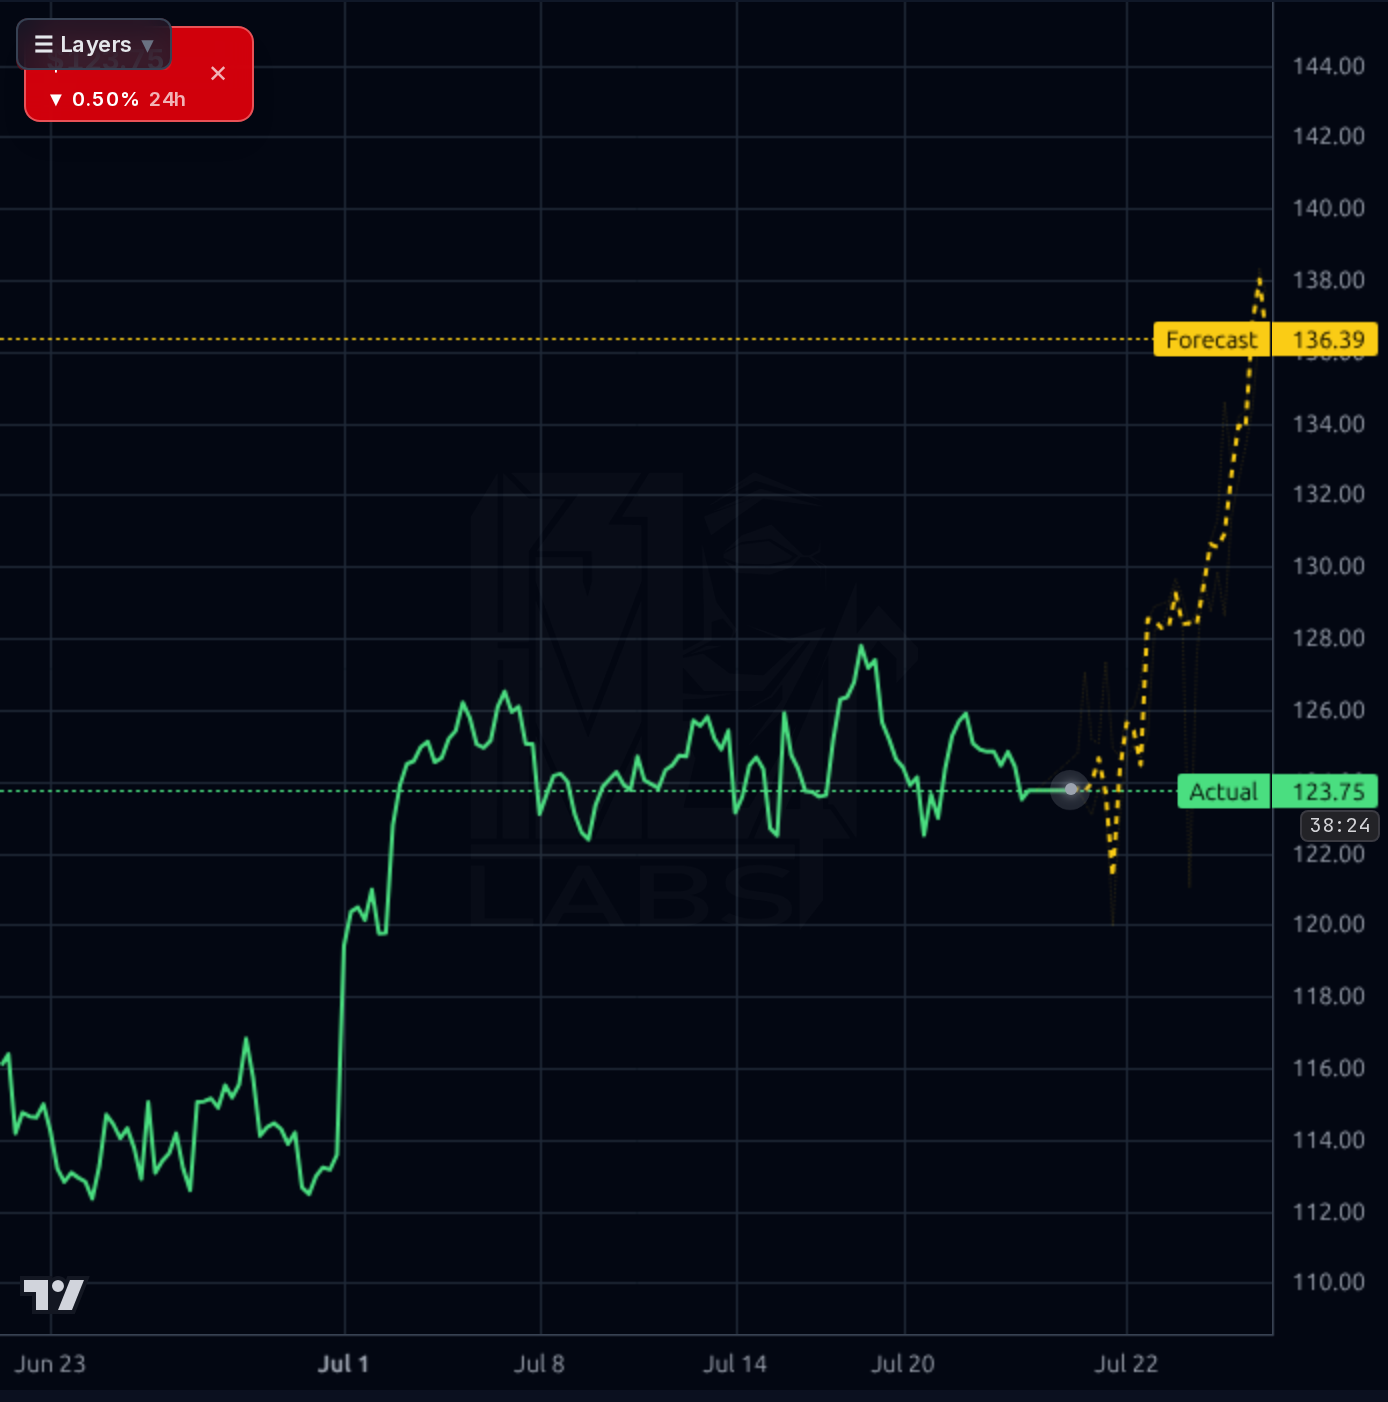
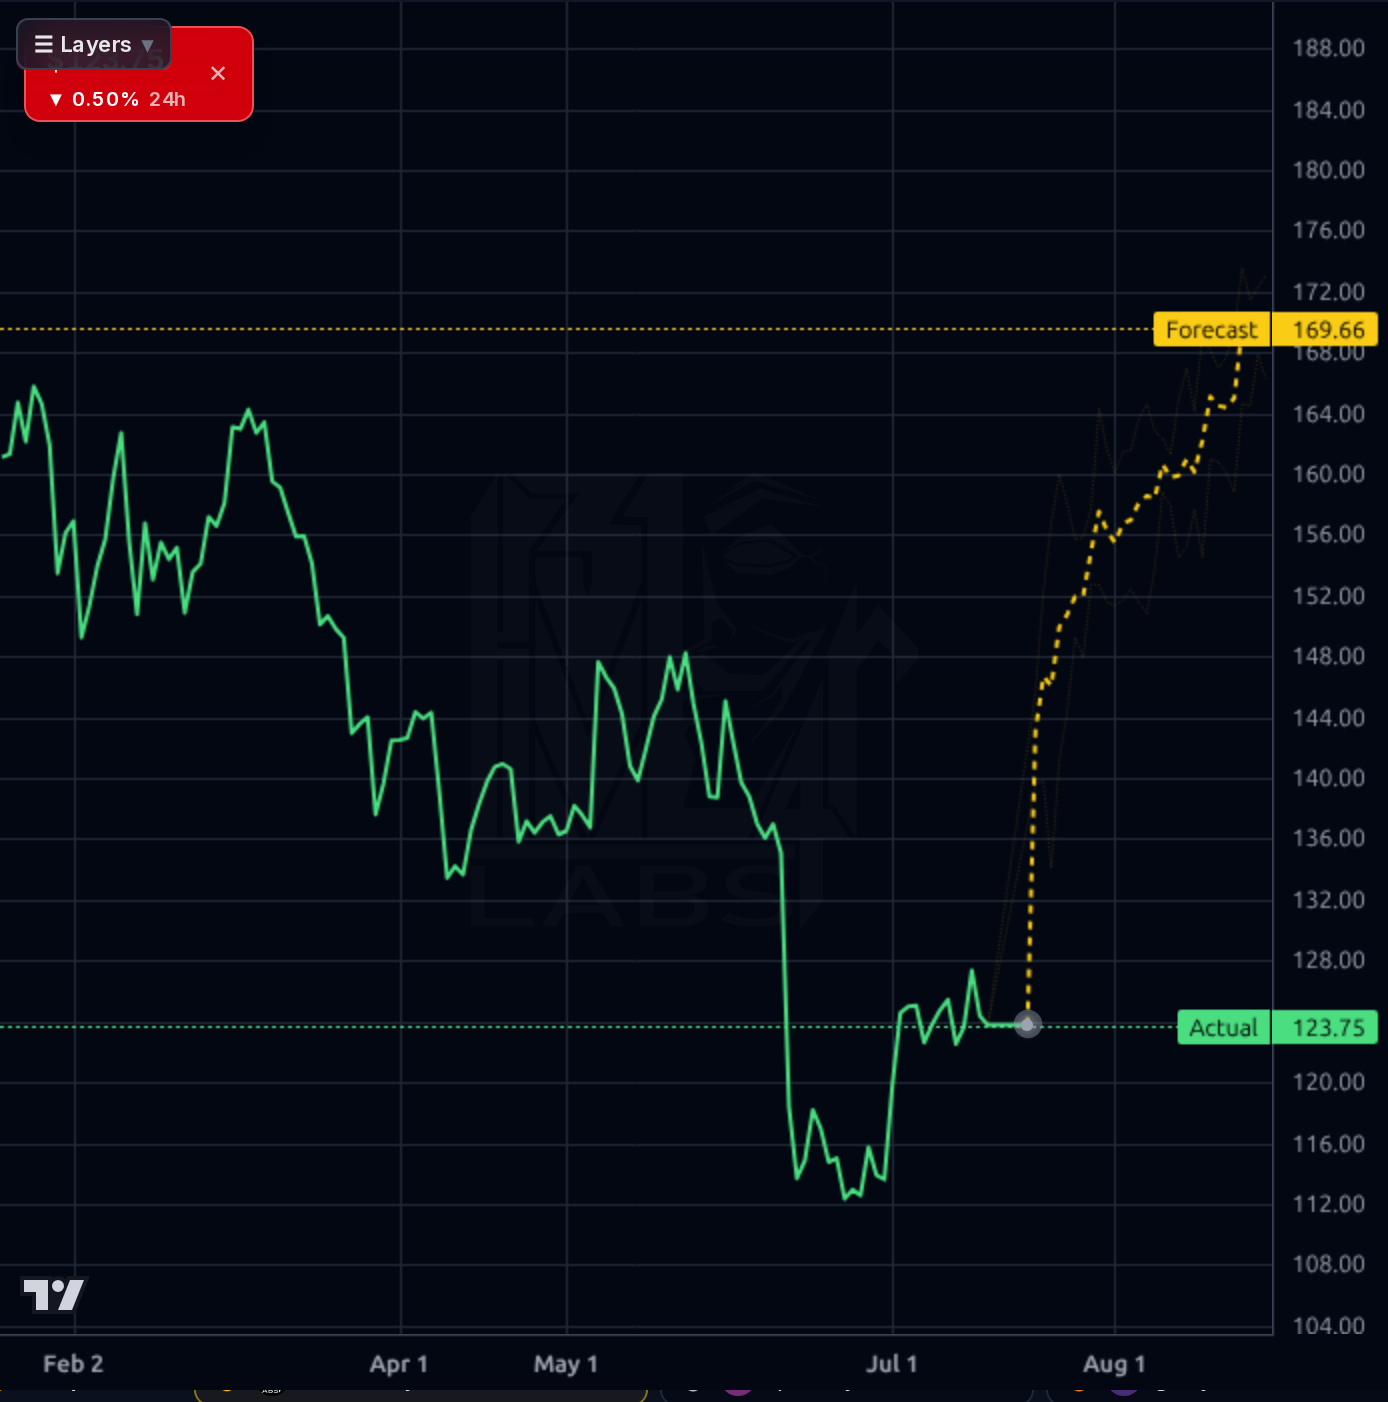
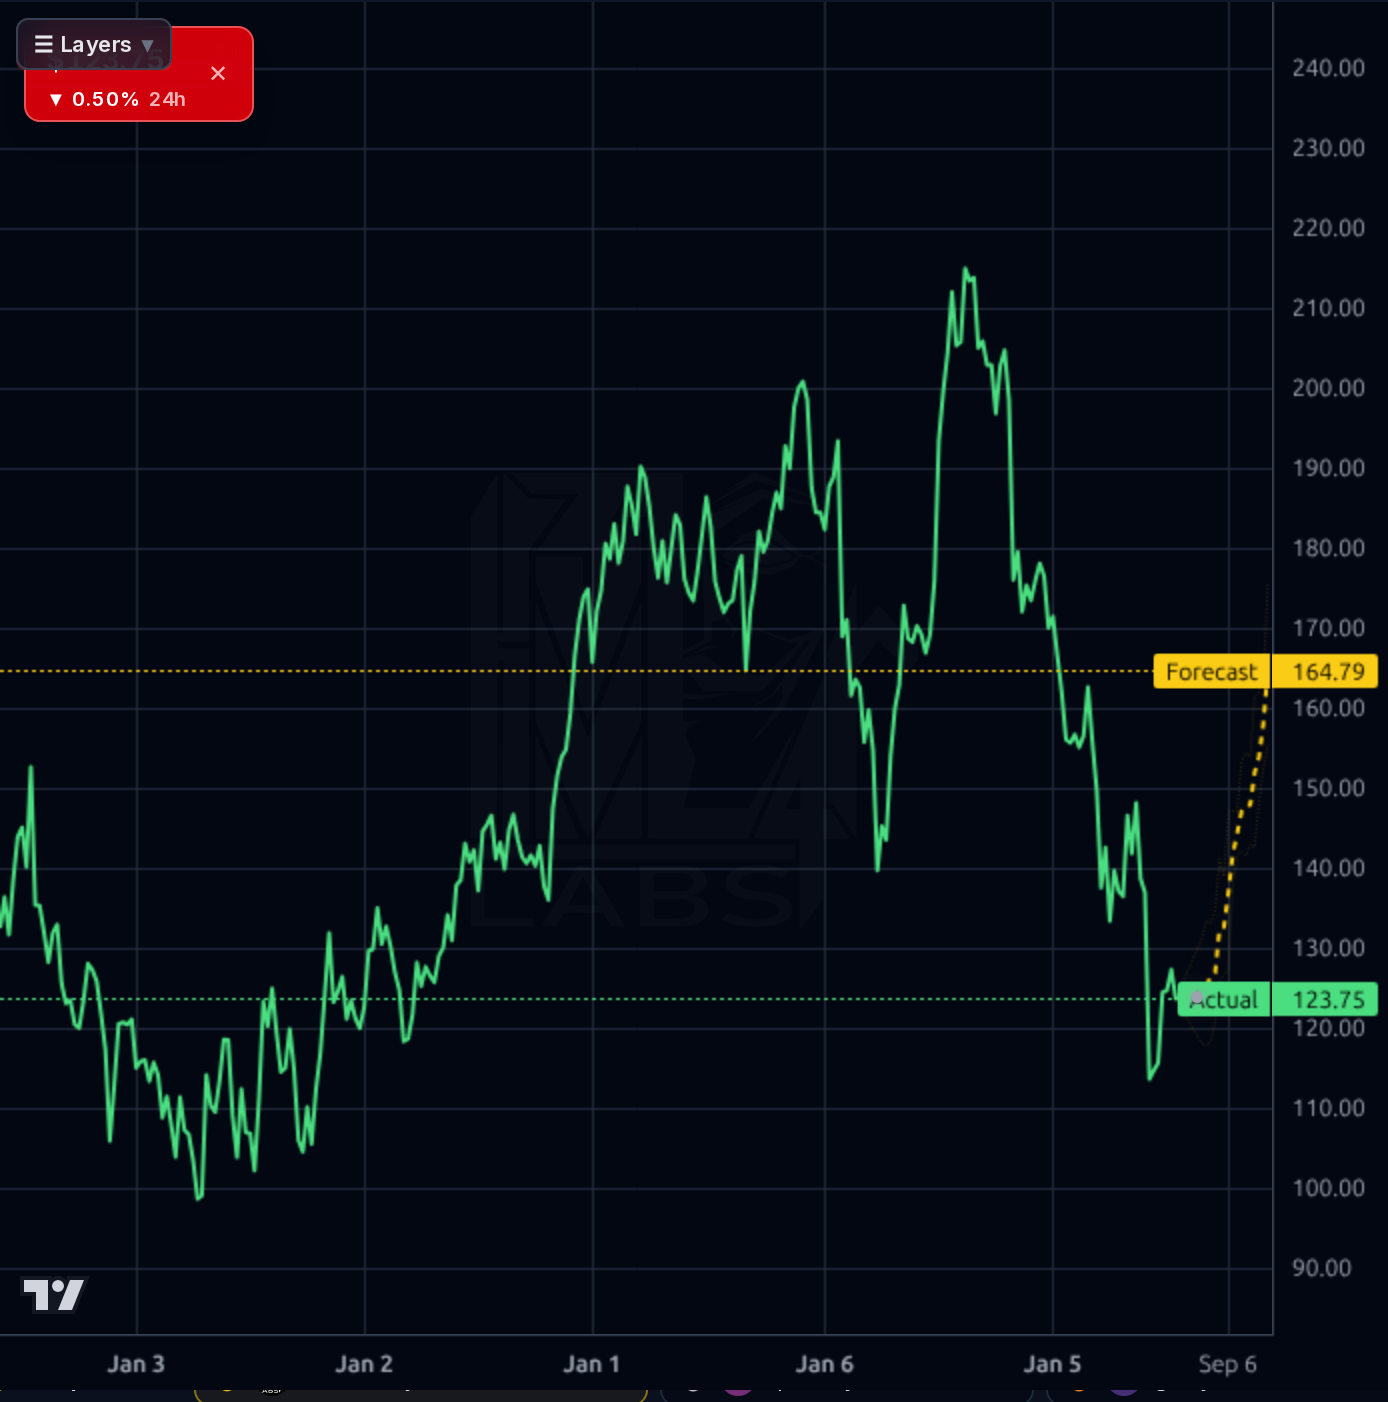
The multi-timeframe picture is that of a wounded but stabilizing name. The weekly chart shows a classic distribution top from ~$215 down to a $114 low, with price now recovering to $124.83 — still 43.2% off the 52-week high of $219.69. The daily chart confirms a lower-high downtrend since April, with $140-$145 as repeatedly-failed overhead supply and $112-$118 as the working demand zone. The 1h chart shows constructive consolidation between $122-$128 with a modest recovery back to the 20-day SMA (+3.6%), but price sits -20.8% below the 200-day SMA and -4.3% below the 50-day — the intermediate downtrend is intact. RSI at 50.8 is textbook neutral; ATR of 4.38 signals roughly 3.5% daily range into the print. The model's forecast bands lean bullish across timeframes (1h implies $136-$138, 1d $169, 1wk $164), but the model's realized 1wk directional accuracy is only 50% versus a 100% naive baseline — this forecast is not tradable and I discount it heavily. Structurally: hold above $118, break above $132 opens a test of $140; failure of $118 puts $112 and then $108.50 in play.
The signal in the recent flow is Gartner's dual placement of PTC in the 2026 Magic Quadrant for PLM Software — Windchill as a Leader (highest on 'Ability to Execute') and Arena as a Visionary. This is a real moat/pricing-power reinforcement for the core PLM franchise and matters most for enterprise renewal cohorts. The second signal is the ALM/Codebeamer partner webinar highlighting software-defined product tailwinds and regulatory-driven demand — this is the growth vector that must be quantified on July 29. Third-party pieces flagging PTC as a candidate compounder are noise but confirm the '3 Big Reasons to Love PTC' sentiment tilt at the -26.7% six-month drawdown. Broader tape context is mixed: SPY in late markup / distribution with breadth deteriorating (49.7% >200dMA) and a risk-off composite tilt — this argues for tighter risk management on any long into a binary event. Retail sentiment is 100% bullish on a tiny sample (n=18), which I treat as a mild contrarian yellow flag but not decisive.
- Windchill named a Leader in Gartner 2026 Magic Quadrant for PLM Software with the highest 'Ability to Execute' — reinforces enterprise pricing power for the core franchise
- Codebeamer ALM tailwind from software-defined products and regulatory demand — the primary organic growth vector needing quantification on the July 29 print
- Arena named a Visionary in the Gartner MQ — expands the mid-market PLM/QMS TAM addressability
- AI integration via Creo AI Assistant and Onshape Labs as a potential re-rating catalyst if adoption metrics are disclosed
- PTC Orbit IIoT and ServiceMax service-lifecycle cross-sell into the installed base — requires concrete revenue attribution proof-points
- Continued FCF conversion (~$986M TTM) providing capital for opportunistic buybacks at the current -43% drawdown from highs
- Binary July 29 earnings print — an ARR/guide miss would likely re-test $112-$118 support immediately
- Forward PEG of 2.08 against consensus EPS-next-5Y of only 6.99% — the growth math needs to accelerate or the multiple compresses further
- M&A-flattered growth: 27.8% Y/Y sales growth reflects ServiceMax/Codebeamer contributions; organic deceleration would be exposed on any clean disclosure
- Industrial CapEx softness under a risk-off regime with deteriorating breadth directly threatens enterprise PLM budget allocations
- The $140-$145 resistance band has repeatedly failed — evidence of persistent supply and multiple-compression pressure
- Institutional ownership at 102% with insider transactions -1.10% suggests fully-owned, low-fresh-capital setup — limits upside surprise mechanics
- Model forecast unreliability: 1wk directional accuracy 50% vs 100% naive baseline — do not lean on quantitative bull cases from the forecast band
Get AI analysis on any stock
This is one of hundreds of Kronos AI reports — scored fundamentals & technicals, bull/base/bear price targets, a multi-horizon plan, and continuously-updated forecasts across the market. Create a free account to explore them all.
Create your free account →Already a member? Sign in · Join our Discord