PWR — AI Stock Forecast & Price Targets
Published 8/27/2026 · A free sample of K3vl4r’s AI-powered analysis.
Kronos price forecasts, scored fundamentals & technicals, and a multi-horizon plan.
View the live PWR price forecast →
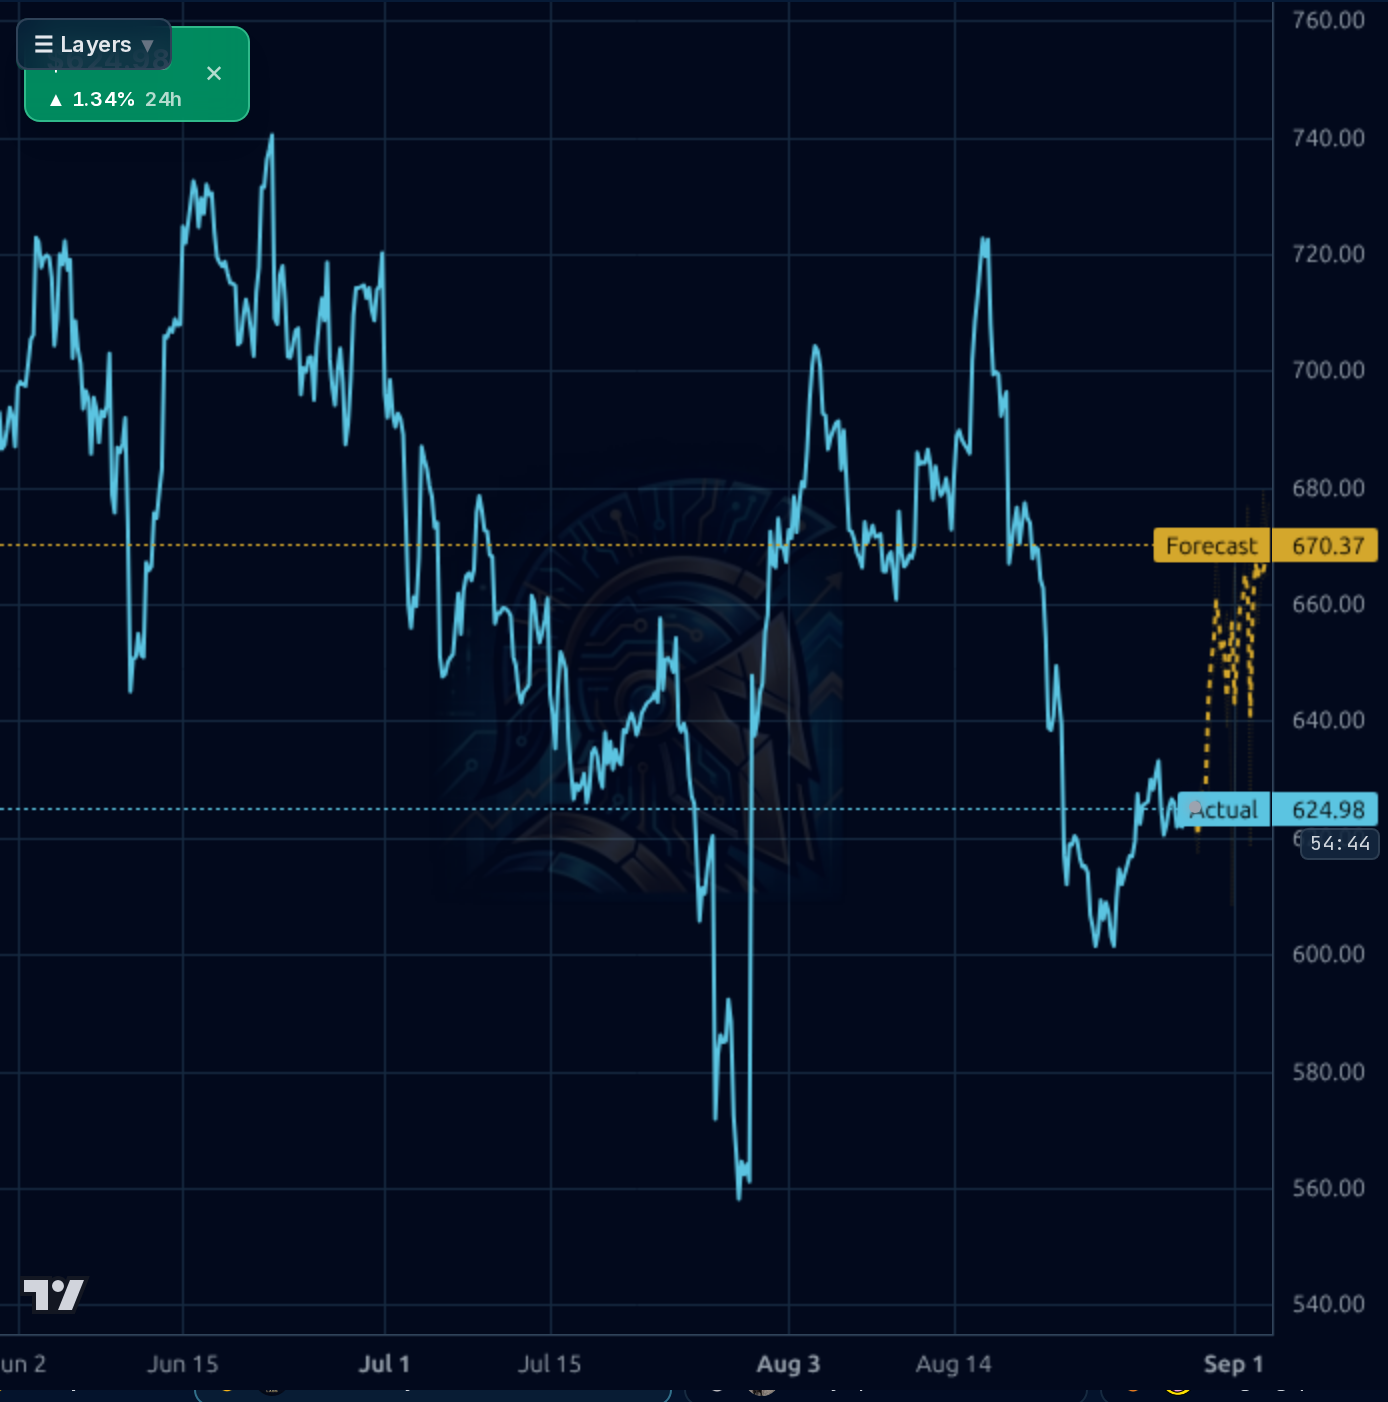
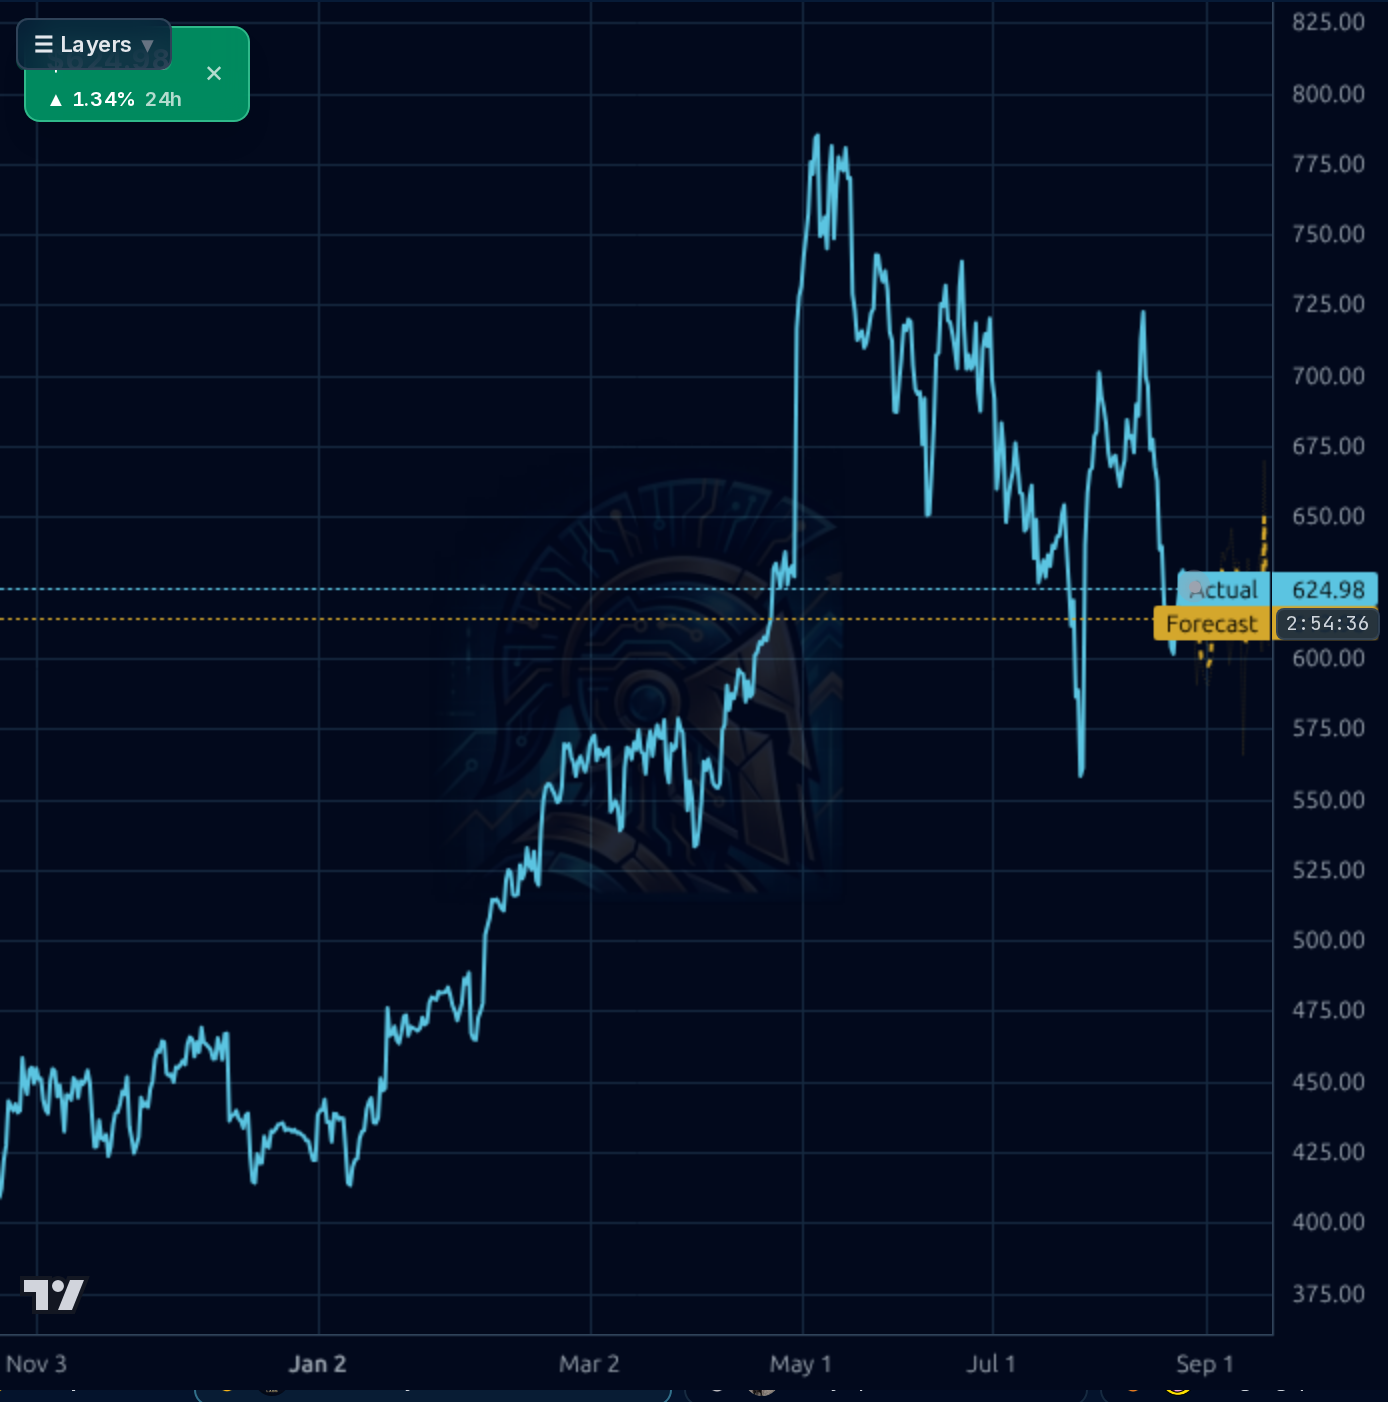
PWR sits at the intersection of AI datacenter power buildout and grid modernization, with Q2 revenue accelerating +41% Y/Y and a record backlog, but the stock is digesting a ~21% pullback from $788 highs on valuation compression (71x trailing, 32x fwd). Near-term technicals are weak (below 20/50 SMA, RSI 42, forecast band biased lower to ~$509-670), yet the medium-term secular thesis is intact and the pullback improves risk/reward for accumulators with patience.
1-4 weeks: Neutral-to-cautious. Stock is below SMA20/50 with a bearish short-horizon forecast and just posted a -6.1% week and -14.8% quarter. Do not chase; wait for either (a) reclaim and hold of $660 with volume, which flips the short-term structure, or (b) a retest of $600 support that holds. Initial partial entries at $600-610 make sense for accumulators. Invalidation: decisive weekly close below $560 (July low) would signal the pullback is turning into a broader top and warrants stepping aside until $500-520 support tests.
1-6 months: Constructive. Backlog visibility, guidance raise, and accelerating revenue growth support a rerating back toward the $720-750 range as the market digests Q3 (Oct 29 earnings is the next major catalyst, ~62 days out). Expected return range from ~$622: +5% to +25% base case, contingent on Q3 delivering another beat and management reinforcing the AI/grid narrative. Change my mind: Q3 revenue growth decelerating below ~25% Y/Y, gross margin compression, or backlog contraction — any of those would invalidate the reacceleration thesis and warrant trimming.
1-3 years: Structurally bullish. PWR is a picks-and-shovels play on two of the largest capex cycles of the decade — AI datacenter power provisioning and US grid modernization/reconductoring. With $53B+ backlog, ~70k employees (a scarce skilled-labor moat), and consensus 5Y EPS growth of ~29%, the compounding runway is real. Terminal multiple should compress from today's 32x fwd toward the mid-20s as growth normalizes, but earnings power growth (fwd EPS $19.64 vs trailing $8.76) should more than offset. Biggest structural risk: a policy/rate shift that slows utility capex, or a debt-financed acquisition that impairs the balance sheet further — the D/E is already elevated and leaves less room for error than the compounding track record suggests.
Revenue growth is re-accelerating: Q2 2026 revenue of $9.56B was +41% Y/Y with sales Q/Q at +41.1%, and sales growth estimates were revised up from 21.1% to 26.3% — a material positive shift. Trailing twelve-month revenue is $32.9B with a record $53.4B backlog cited in coverage, giving multi-year visibility. Margins are thin but improving sequentially: Q2 gross margin 16.2% vs 14.1% in Q1, operating margin 7.2% vs 4.2%, and net margin 4.7% vs 2.8%; EPS Q/Q +94.9% shows operating leverage kicking in. Cash flow quality is strong — Q2 OCF of $1.10B and FCF of $864M, TTM FCF ~$1.96B, comfortably funding capex (~$231M/qtr) and the modest 0.07% dividend. Balance sheet is the soft spot: $6.6B total debt vs $506M cash, D/E 0.69 (68 on Yahoo's scaled metric), and the Aug 6 8-K flagged additional debt issuance/maturities that bear watching. ROE 15.3% and ROIC 8.6% are respectable but not elite given the 9.7x P/B. The story is executing, but leverage and thin margins mean the premium multiple is doing a lot of work.
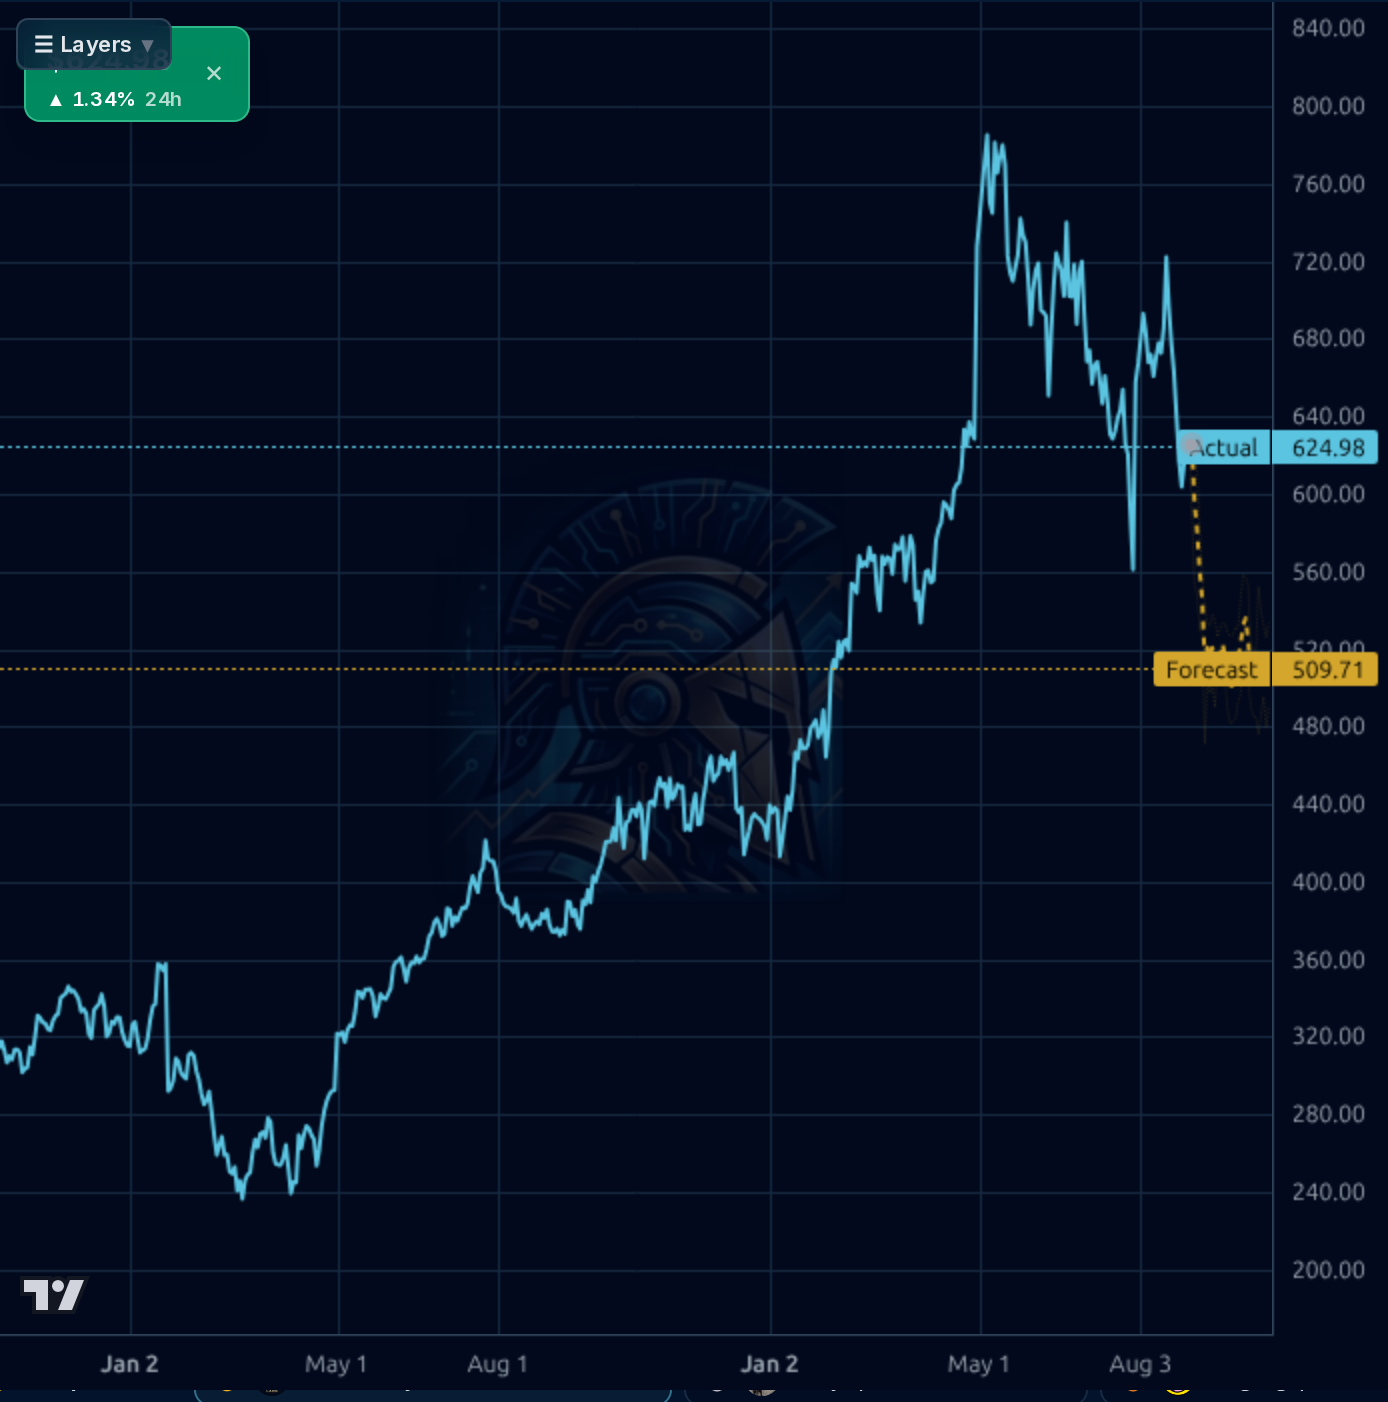
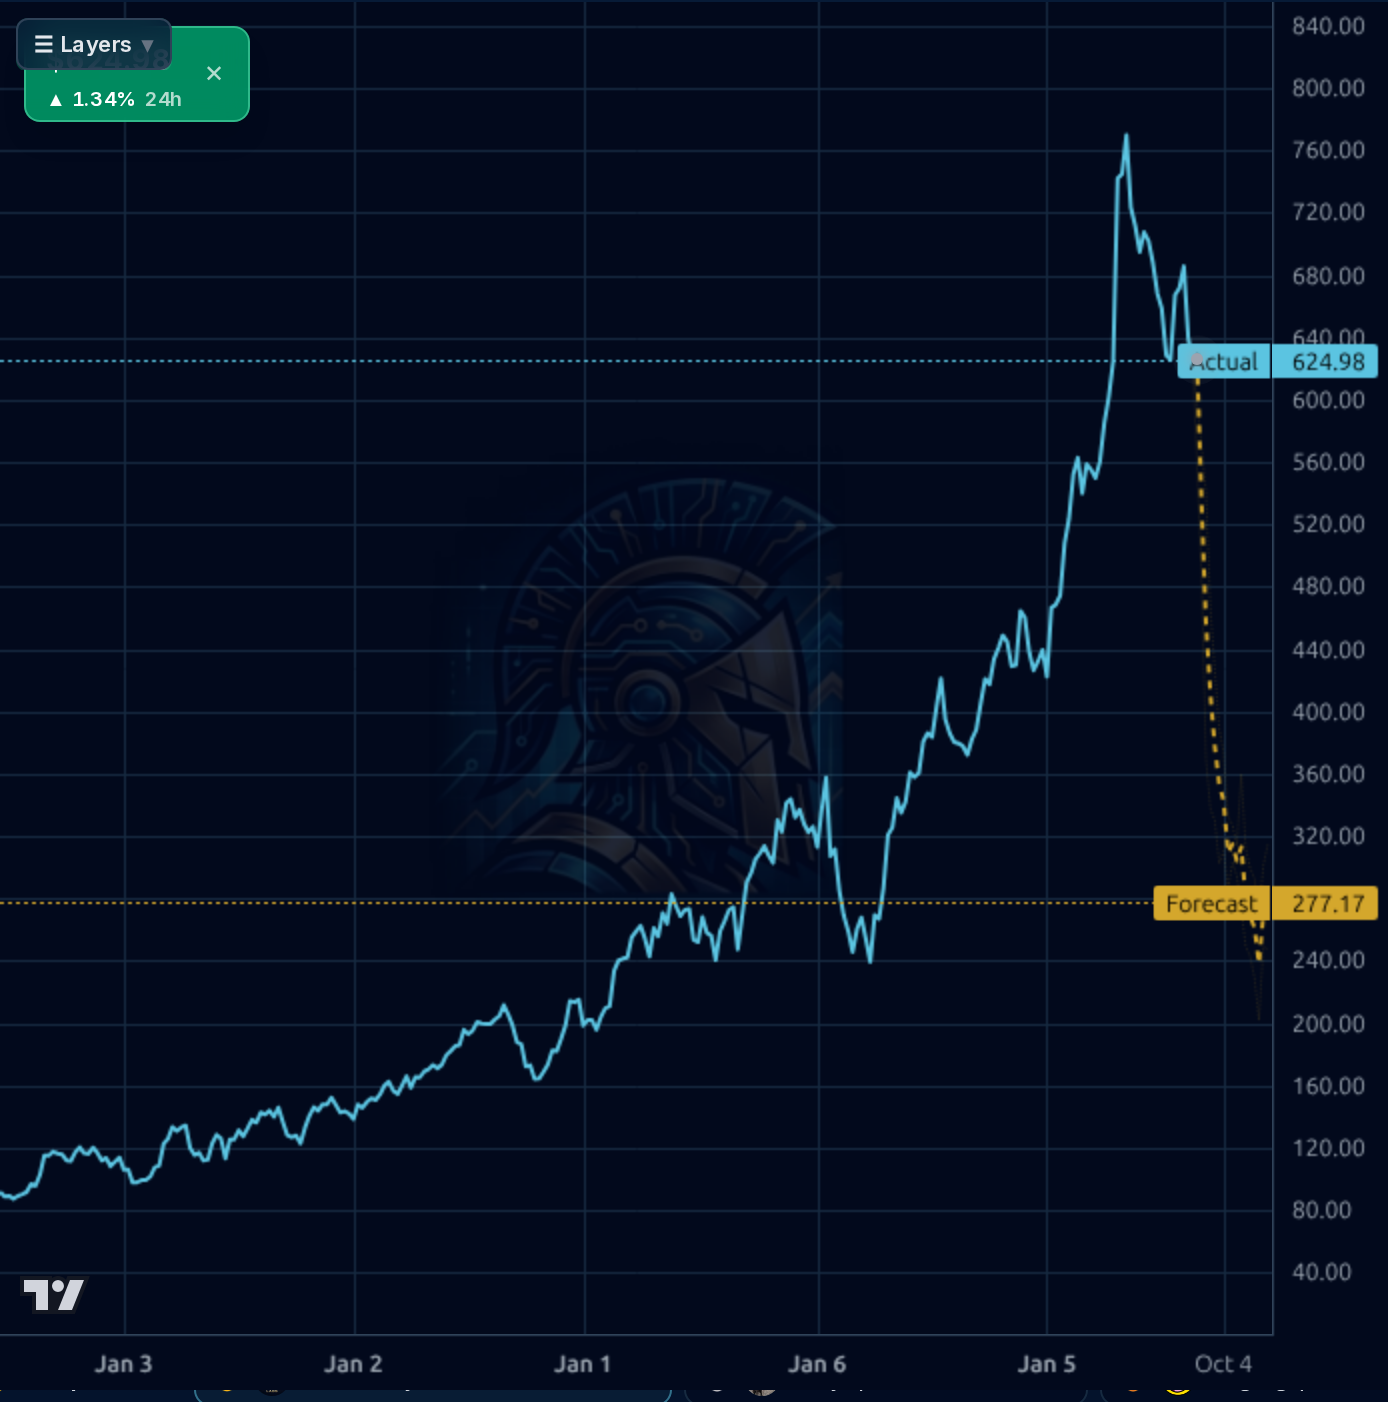
Multi-timeframe picture is mixed-to-cautious. On the 1h and 4h charts, PWR broke down from the ~$720 August peak to a ~$600 low, then bounced to $624; price sits below SMA20 (-6.4%) and SMA50 (-6.4%) but still above SMA200 (+6.7%) — a classic pullback-to-uptrend structure. Weekly and daily charts show the primary uptrend fully intact (Perf YTD +47%, Perf Year +63%, Perf 3Y +203%), but the daily forecast band is aggressively bearish, projecting $509 over the near term, and the weekly forecast points to $277 — the model's own bullish_prob is 0.00 on both, though its directional accuracy at those horizons only matches the naive baseline, so discount the magnitude. RSI 42 is neutral/mildly oversold, ATR $28 implies ~4.5% daily range. Key support: $600 (recent low) then $560-575 (July low zone); resistance: $660-680 (broken shelf) then $720-740 (August highs). The setup favors a base-build rather than an immediate V-recovery.
Signal: Q2 2026 delivered 41% revenue growth, a record $53.4B backlog, and management raised 2026 guidance — this is the core bull update and is corroborated by the L1 bullish sales-estimate revision. Multiple sources (SeekingAlpha, Zacks, ChartMill, JPMorgan strategist commentary) frame PWR as a prime beneficiary of AI datacenter power demand and grid modernization outside the Mag 7, and 10-year total return of ~2,292% underscores the durability of the compounding story. Analyst posture is bullish (Recom 1.52, target $800 vs $622 spot = ~29% upside). Noise: general market/tech headlines (Twitch, BOJ, Pokémon, KuCoin) are irrelevant to PWR. The Aug 6 debt 8-K is worth flagging — additional issuance in a stock already carrying $6.6B debt is a marginal negative but appears to be refinancing/laddering rather than distress.
- Record $53.4B backlog cited in Q2 coverage provides multi-year revenue visibility into AI datacenter and grid modernization projects
- Q2 2026 revenue +41% Y/Y with operating margin expansion from 4.2% to 7.2% Q/Q — evidence of operating leverage as backlog converts
- Management raised 2026 guidance alongside Q2 print, per SeekingAlpha coverage
- Sales growth estimate revised upward from 21.1% to 26.3% (L1 bullish fundamental-change signal)
- JPMorgan strategist highlighting AI rally broadening beyond Mag 7 into infrastructure names with strong order backlogs — directly names this cohort
- Consensus 5Y EPS growth of 28.85% and fwd EPS of $19.64 vs trailing $8.76 implies ~2x earnings power over the guidance horizon
- Valuation stretched: trailing P/E 71, fwd P/E 32, P/B 9.7 — leaves limited cushion if growth decelerates
- Balance sheet leverage: $6.6B debt vs $506M cash, D/E 0.69; Aug 6 8-K disclosed additional debt issuance
- Thin margins: gross margin only 15.5% TTM, net margin 4.0% — small execution slippage compresses earnings meaningfully
- Technical breakdown risk: below SMA20/50, -21% off 52-wk high; a break of $600 opens $560 and potentially $520
- Model's own daily/weekly forecast bands are sharply bearish (targets $509 and $277) — while accuracy is only baseline-level, the signal warrants respect
- Cyclical risk: engineering & construction is sensitive to utility capex cycles and interest rates; a Fed pivot toward tightening or utility CapEx pause would hit multiple and estimates simultaneously
- Crowded trade: institutional ownership 92.5%, sentiment 100% bullish among retail — limited marginal buyers if narrative cracks
Get AI analysis on any stock
This is one of hundreds of Kronos AI reports — scored fundamentals & technicals, bull/base/bear price targets, a multi-horizon plan, and continuously-updated forecasts across the market. Create a free account to explore them all.
Create your free account →Already a member? Sign in · Join our Discord