QFIN — AI Stock Forecast & Price Targets
Published 8/7/2026 · A free sample of K3vl4r’s AI-powered analysis.
Kronos price forecasts, scored fundamentals & technicals, and a multi-horizon plan.
View the live QFIN price forecast →
QFIN trades at 2.4x P/E, 0.45x book, with an ~11.8% dividend yield and clean balance sheet — a textbook China-ADR discount name where the fundamental value case is strong but the tape is bleeding (-61% YoY, -32% YTD). With earnings on 8/13 as a binary catalyst just 6 days out, and prior bullish targets on this name having repeatedly failed to print, the right posture is patient accumulation into weakness rather than chasing the Kronos-implied bounce.
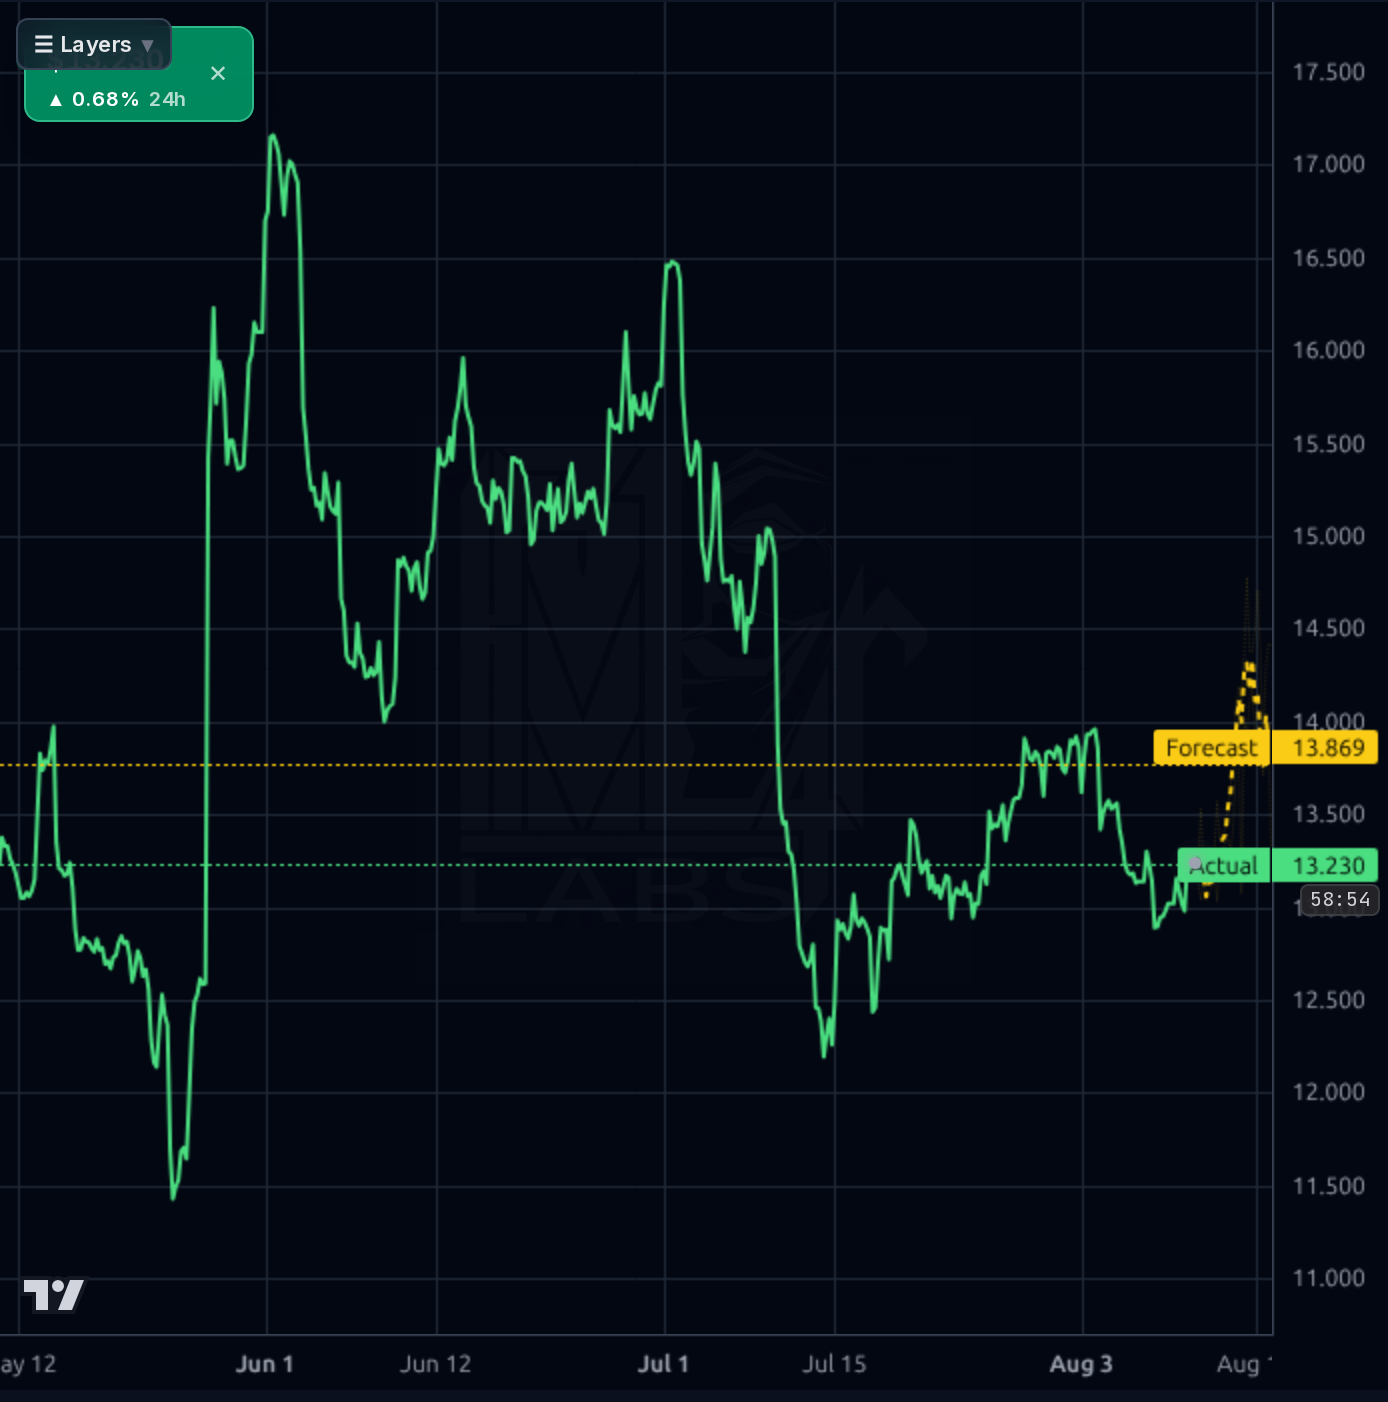
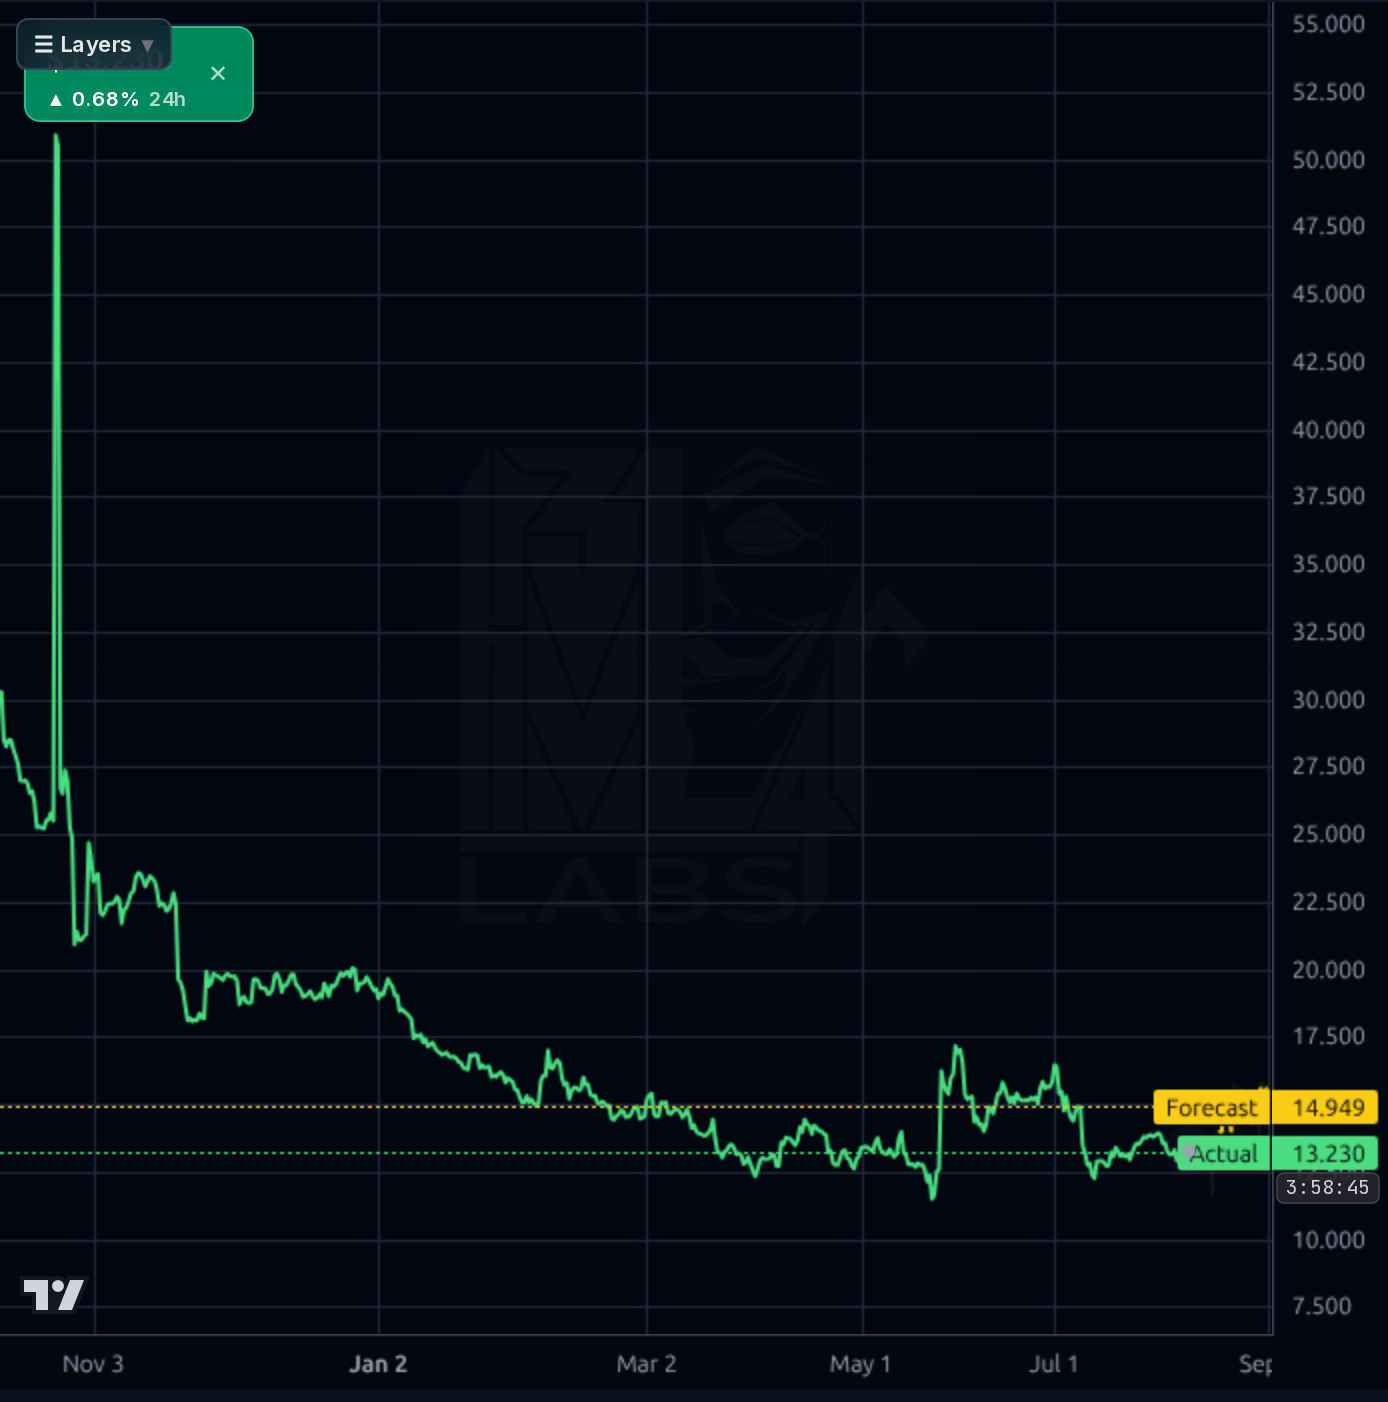
Do not initiate a swing position into the 8/13 print — it is a binary event with likely IV crush and gap risk in either direction. If already long, size down or hedge. Tactical range: support $12.20–12.50 (recent low), then $11.30 (52w low, hard invalidation); resistance $13.87, then $14.90. A pre-earnings bounce toward $14 is plausible given oversold-ish RSI and the near-term forecast, but not worth the risk/reward this close to the print. Earnings stance: NEUTRAL into the event; wait for the reaction.
1-6 month base case is a range-bound $12–17 recovery attempt if the print shows stabilization in loan volume and preserves the dividend, with upside skewed to the multiple re-rating rather than earnings growth. Catalysts: 8/13 print (guidance and buyback/dividend commentary matter most), any Chinese regulatory clarity, and continued institutional accumulation (Inst Own 55% though Inst Trans -9.8% is a caution). What changes my mind: another sequential revenue decline >10% or a dividend cut would invalidate the value thesis and open $10 handles.
1-3 year terminal thesis: if QFIN can stabilize revenue around ¥12–14B annualized while defending 25%+ net margins, a re-rating from 2.4x to even 5–6x earnings on ~¥4/sh EPS supports $20–24. The structural drivers are China consumer credit penetration, the capital-light platform mix shift, and AI-driven underwriting scale. Biggest structural risk is not competition — it's political: Chinese fintech remains one policy statement away from a fresh revaluation event, and the ADR wrapper adds delisting tail risk. This is a value/income position, not a growth compounder — size accordingly.
The fundamentals are a study in contradictions. Trailing P/E of 2.28, P/B of 0.45, EV/Sales 0.19, and an enterprise value of just $488M against $1.59B market cap tell you the market is pricing in structural impairment. Yet TTM operating cash flow is ¥10.4B, FCF ¥9.9B, gross margin 80.1%, operating margin 27.5%, ROE 21.2%, and debt/equity is a modest 0.12 with cash/share of $12.45 — nearly the entire market cap is in cash. The problem is trajectory: quarterly revenue has stepped down from ¥4.33B (Q2'25) → ¥4.35B → ¥3.41B → ¥3.01B (Q1'26), and net income from ¥1.73B → ¥1.44B → ¥1.02B → ¥0.88B. Sales Q/Q -12.4%, EPS Q/Q -40.3%. So you own a cash-rich, high-margin business whose top and bottom line are visibly contracting under Chinese fintech regulatory tightening. The 11.8% dividend (24.8% payout ratio) is well-covered by FCF and provides real income support, but the erosion in earnings power is the reason multiples stay compressed.
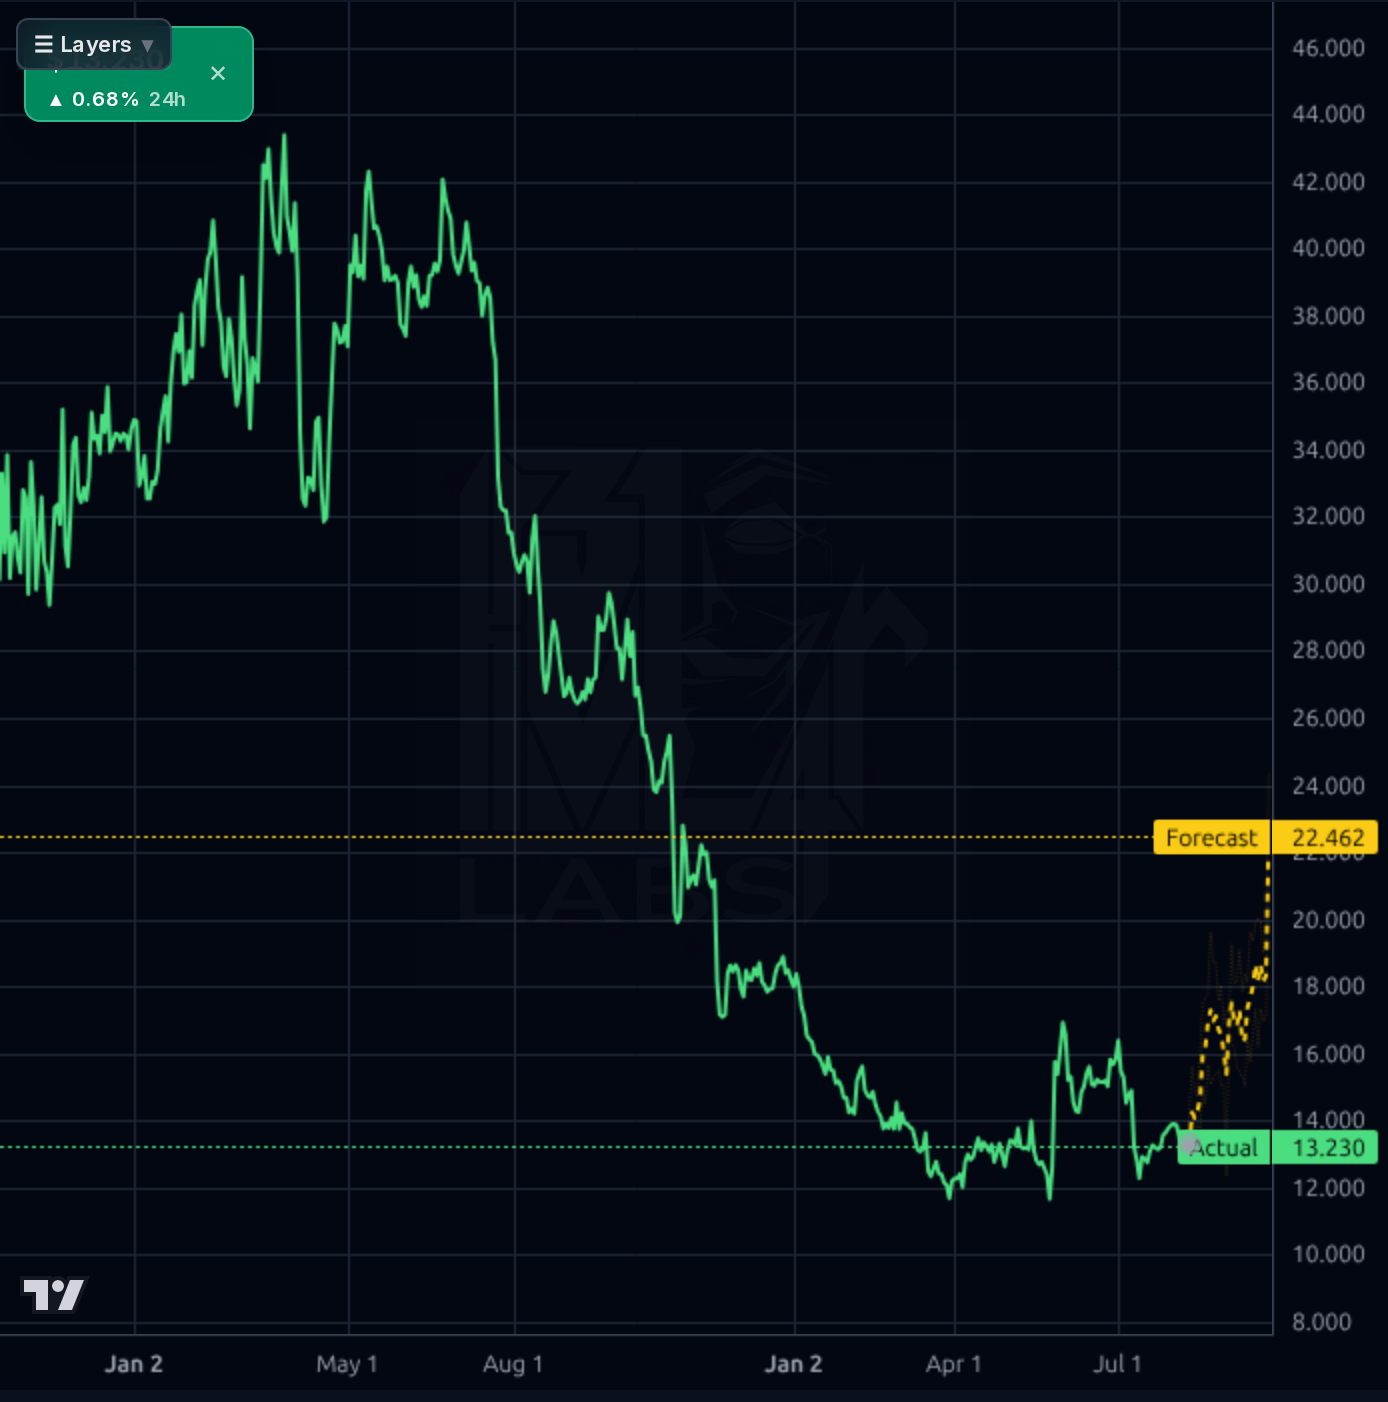
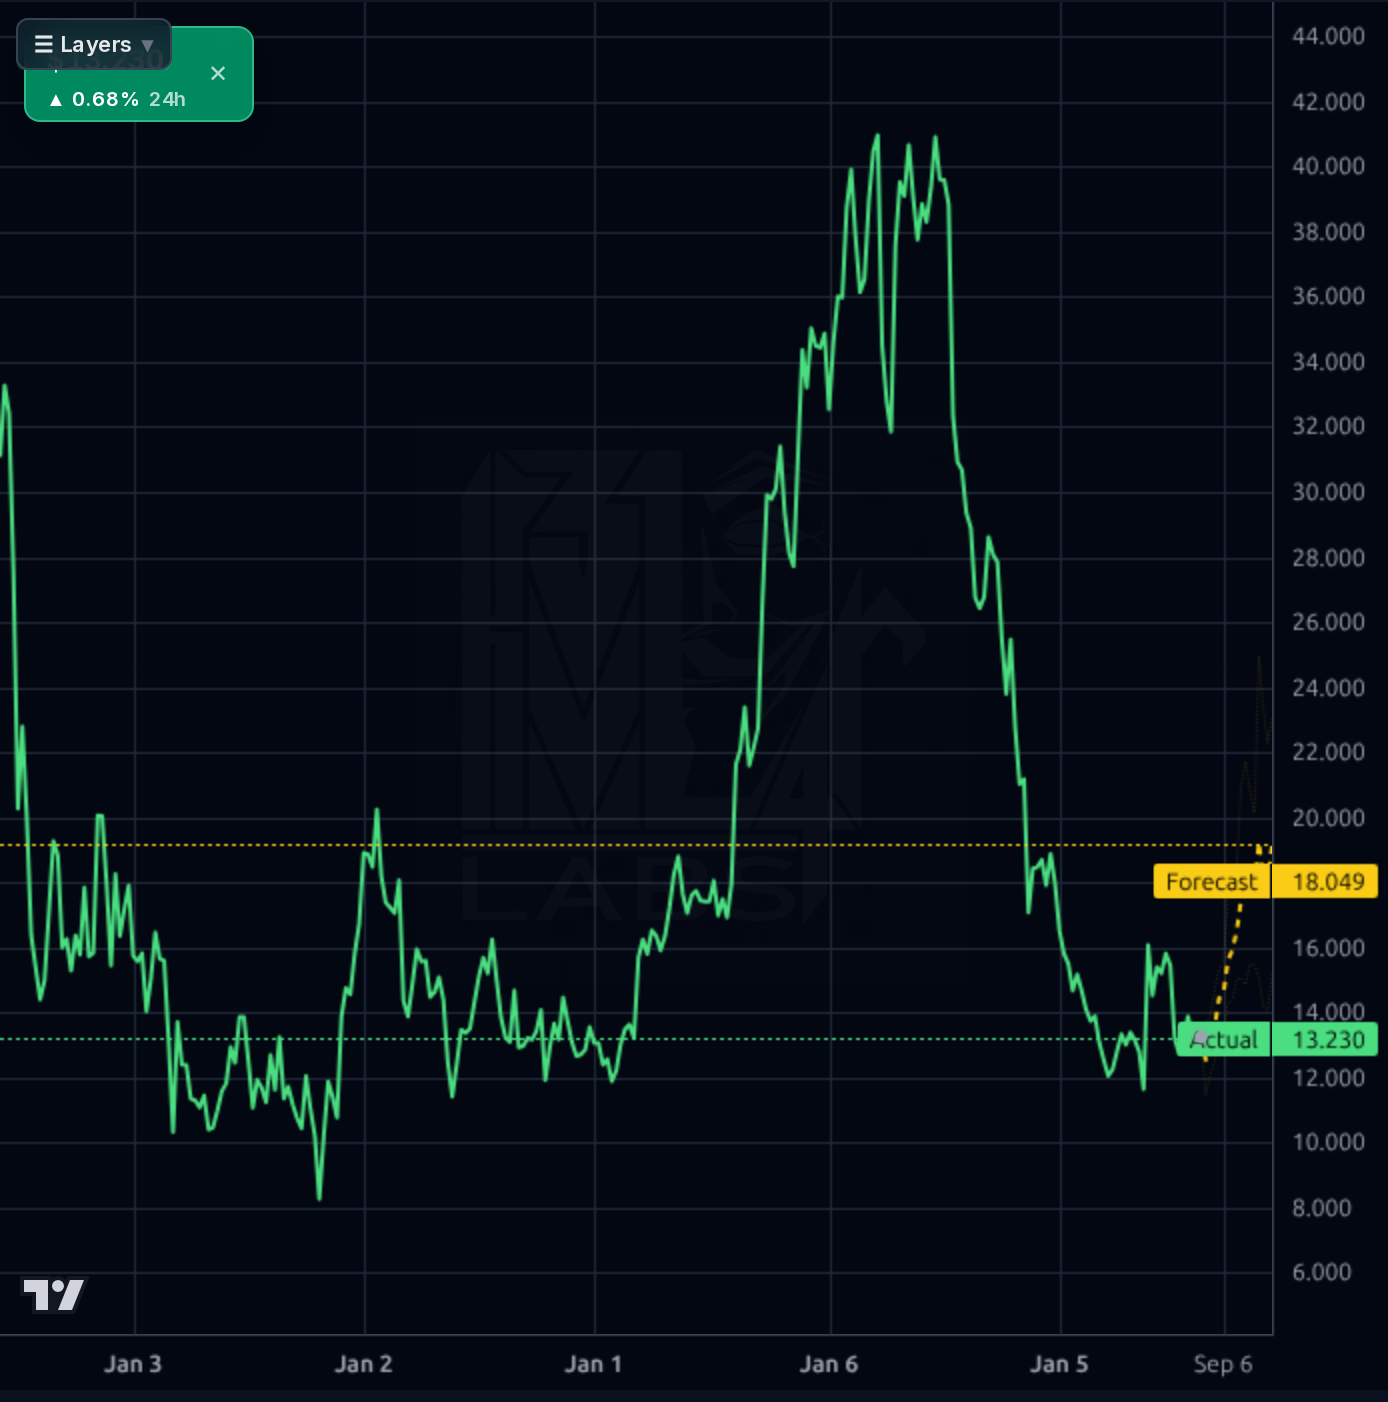
Across timeframes the trend is clearly negative. The weekly shows a full round-trip from ~$8 lows to a $41 peak and back to $13 — price has retraced ~70% of the entire bull leg. The daily confirms a broken structure: after the post-Q1'25 rally to ~$17, price rolled over and is grinding along the $12–14 support shelf, sitting 19.6% below the 200-day SMA and 10.1% below the 50-day. RSI 39.5 is weak but not yet oversold. The 1h/4h charts show consolidation just above the $12.20–12.50 low from July, with $13.87 (recent swing high, and also the forecast level on 1h) as immediate resistance and $14.90–15.40 as the next meaningful supply zone. The Kronos forecast band diverges by timeframe: 1h and 4h suggest a modest pop to $13.87–$14.95, while the 1d model implies a rally to $22.46 — that daily figure is inconsistent with realized accuracy on longer horizons (MAPE rises to 30%+ beyond a week) and with the calibration that prior bull targets on this name have systematically overshot. Weight the near-term band; discount the aggressive 1d/1wk upside.
Signal: The 6/2 Simply Wall St piece frames the story correctly — Q1 net income +104% YoY (reflecting 2025 comps, not the sequential deceleration shown in the last four quarters), tighter credit standards, regulatory tightening across the industry. The 6/17 earnings call recap explicitly cites 'strategic shifts in user mix and risk management amid a challenging retail credit market,' which is the polite way of saying growth is being sacrificed for asset quality. The 6/5 dividend screen inclusion supports the income thesis. Noise: the ADR up/down day roundups add nothing name-specific, and social sentiment (100% bullish among tagged messages, with promotional WhatsApp/Telegram spam) is a mild contrarian yellow flag. The dominant near-term news item is not in the archive but in the calendar: earnings 8/13 AMC.
- Earnings 8/13 AMC is a binary near-term risk — the last four quarters show sequential revenue and EPS deceleration; another miss likely breaks $12 support
- Chinese fintech regulatory overhang — 'challenging retail credit market' language from management is code for policy-driven tightening
- China ADR / VIE structural risk including possible delisting or holdco enforcement actions
- EPS Q/Q -40% and Sales Q/Q -12% show the deceleration is real, not just optics — value trap risk if trends continue
- Institutional transactions -9.8% suggests smart money is trimming despite the cheap multiple
- Dividend, while well-covered today, is not sacred if earnings continue to compress
- High retail social bullishness (100% of tagged) with promotional spam patterns is a mild contrarian flag
Get AI analysis on any stock
This is one of hundreds of Kronos AI reports — scored fundamentals & technicals, bull/base/bear price targets, a multi-horizon plan, and continuously-updated forecasts across the market. Create a free account to explore them all.
Create your free account →Already a member? Sign in · Join our Discord