QNST — AI Stock Forecast & Price Targets
Published 8/28/2026 · A free sample of K3vl4r’s AI-powered analysis.
Kronos price forecasts, scored fundamentals & technicals, and a multi-horizon plan.
View the live QNST price forecast →
QNST just delivered a blowout Q4 (revenue +42.7% YoY, EPS beat, guide above consensus) that rerated the stock from ~$16 to ~$19, but the move is now maturing with insiders (CFO + director) unloading ~$1.6M in the past two weeks and the AI forecast pointing lower across every horizon. Fundamentals are the best they've looked in years — record revenue, strong FCF, Zacks upgrade to Strong Buy, analyst target $22.40 — but at 10x forward EPS with 2.6% operating margins and 8.2% short float, this is a HOLD with a tactical trim bias into strength.
Range-trade $17–$22. With RSI reset to 53 and the stock -13.95% off the 52W high, aggressive shorts are unattractive here, but the insider cluster and forecast model's bearish tilt argue against chasing. Existing holders: hold through the digestion, trim 20–30% only if $22.29 breaks and fails. New money: wait for either a decisive weekly close over $22.29 (breakout add) or a pullback to $16.50–17.00 (post-gap support test). Invalidation on the bull setup: daily close below $16.50 opens $15 gap-fill risk.
1–6 months: base case is that momentum in auto-insurance carrier demand and HomeBuddy persist into the Nov 5 print, driving another test of $22 and potentially $24–25. The Zacks upgrade and 22.40 street target support this. Expected return range: -15% to +25% from $19.18, skewed slightly positive given the Strong Buy consensus and 0.48 PEG. What would change my mind: any softening in Q1 (Sep) guide cadence, an escalation in insider selling by the CEO, or a break of the $16.50 support that invalidates the post-earnings structure.
1–3 years: QNST is a leveraged play on digital ad spend in insurance and home services — cyclically-sensitive but with real operating leverage. If they hold ~15–20% revenue growth and expand operating margins from 3.2% toward the 6–8% range they've hit historically, EPS could double to $3+ and support a $30–40 stock. Structural risk: performance marketing is commoditizing and Google/Meta/Amazon own the top of the funnel; QNST must continually prove it can source cheaper leads than clients could themselves. AI is a double-edged sword — helps their efficiency but also enables carrier direct-to-consumer bypass.
The Q4 print materially changes the picture from the prior dossier: revenue accelerated to $373.9M (+42.7% YoY) and TTM sales reached $1.29B (+18.3% YoY), with EPS Q/Q +499.8% and EPS Y/Y TTM +1634%. The guide of ~$375M for next quarter was 4.5% above consensus, validating the auto-insurance and HomeBuddy home-services momentum management called out. FCF is genuinely strong: $125.9M TTM, with Q3 FCF of $33.8M alone, and the balance sheet is clean — $102M cash, $75.6M debt, D/E of 0.24 (the prior 25x figure in the dossier appears to have been a misread; actual leverage is modest). ROE 28.6%, ROIC 20.4%, and P/FCF 8.6x are attractive. The blemishes remain real: gross margin only 11.3% and operating margin 3.2%, so this is a low-margin lead-gen business that has to scale volume to earn its keep, and net income of $50M in Dec-25 quarter appears tax/one-time inflated. Capital allocation is neutral — no dividend, no visible buyback acceleration.
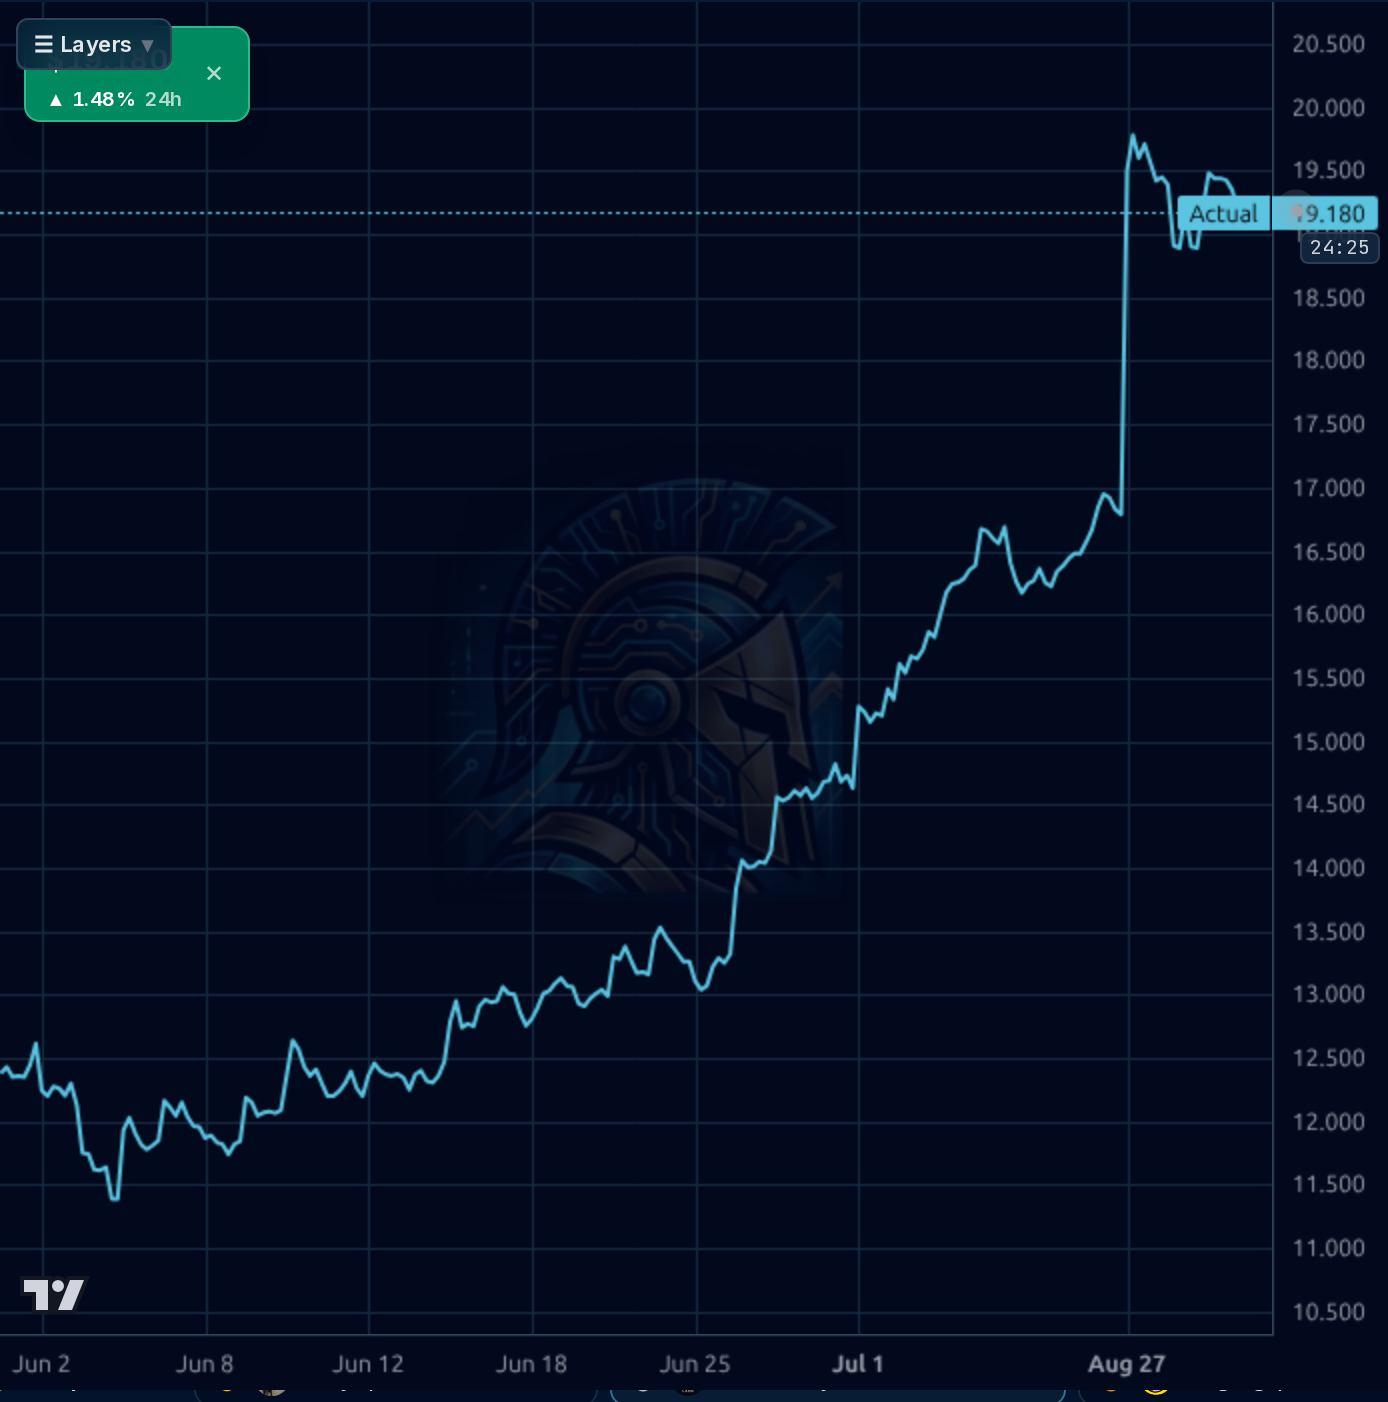
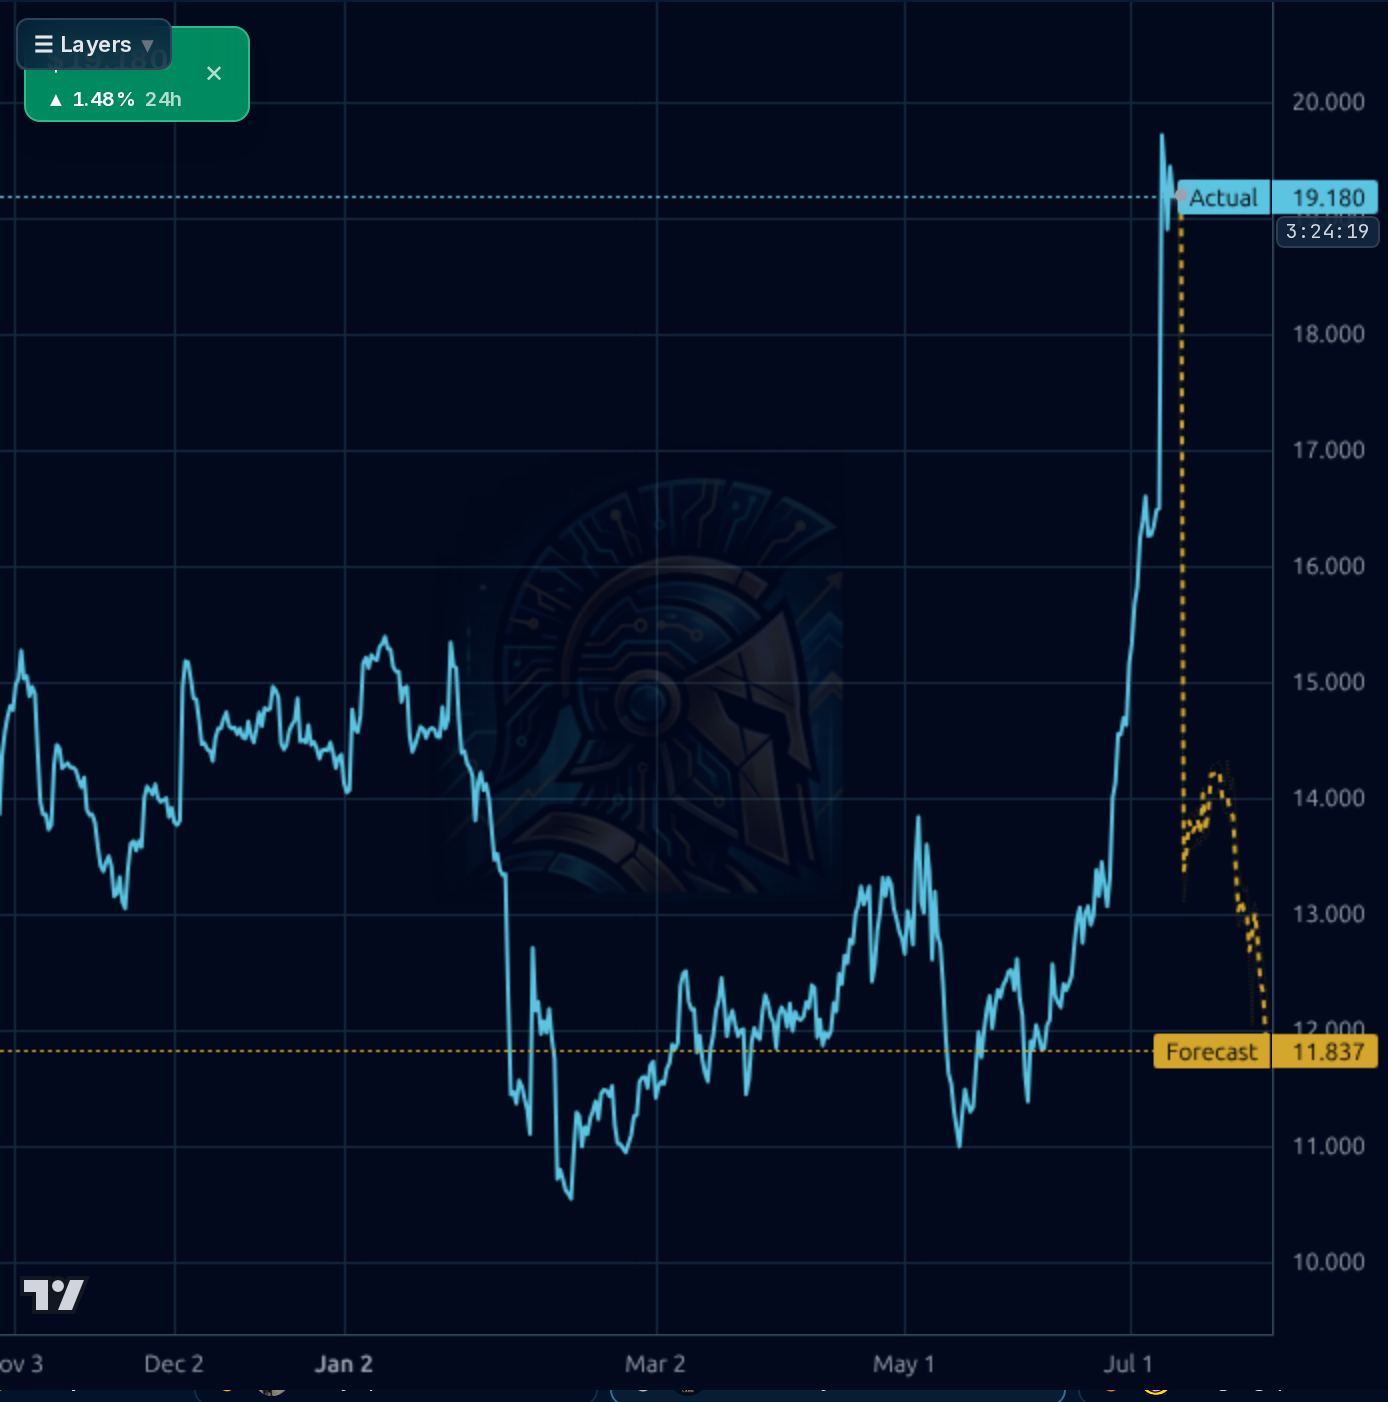
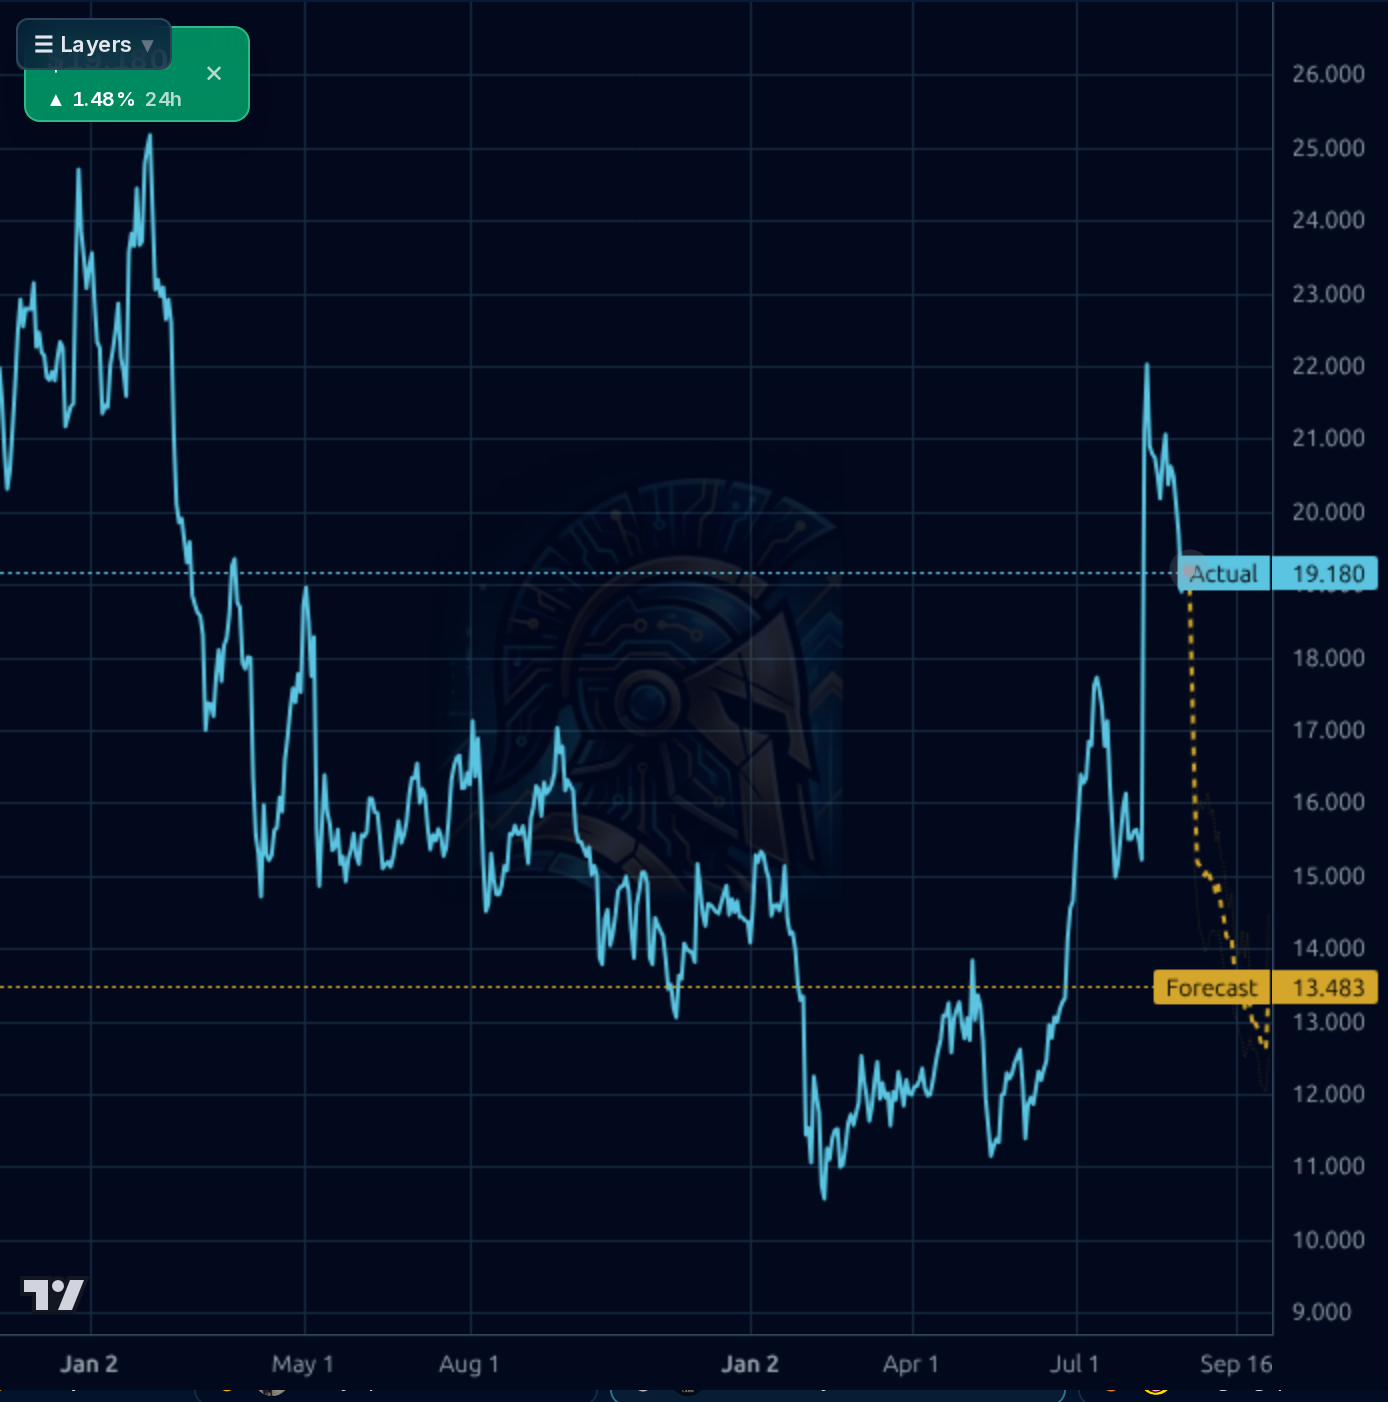
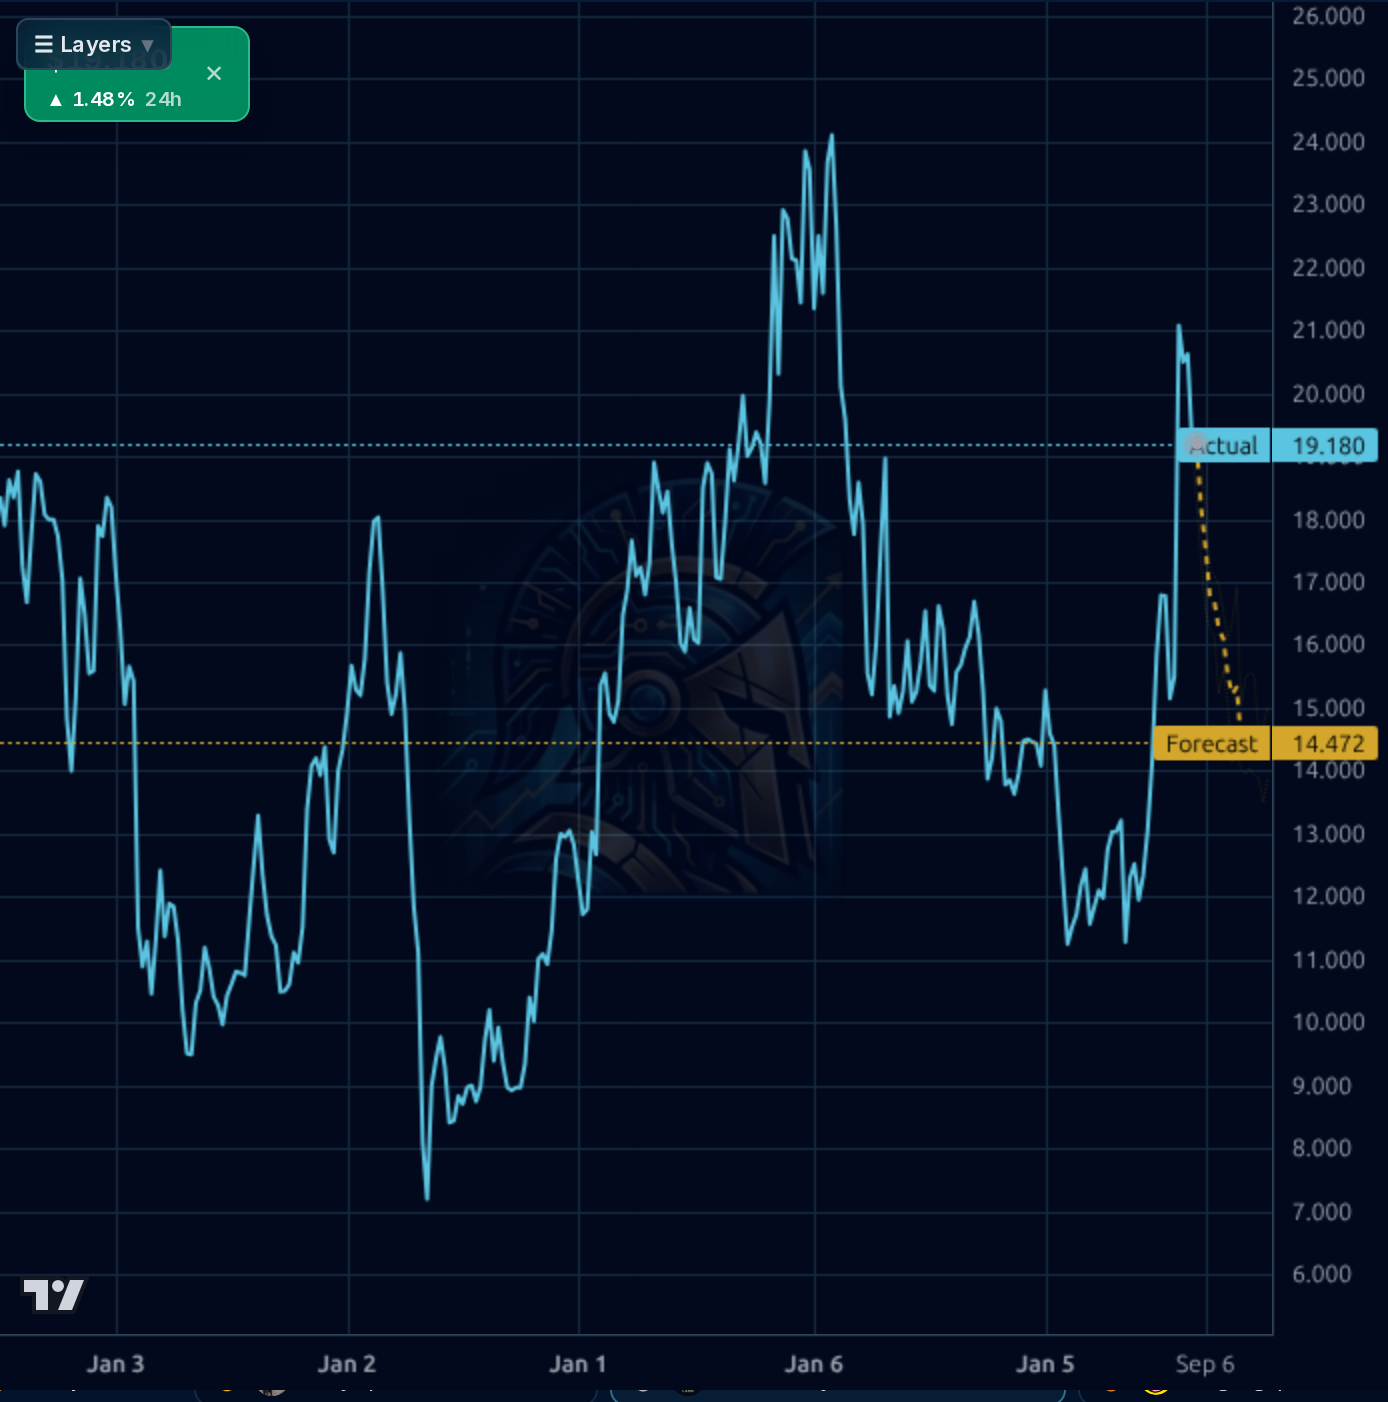
Across the 1h/4h charts price parabolically gapped from ~$16.70 to a high near $19.90 on the Aug 10 earnings beat, then rolled to $19.18 with the 1wk chart showing a -6.98% weekly pullback off the $22.29 52-week high. Trend structure is intact — price sits 37.1% above the 200-SMA and 11.9% above the 50-SMA — but is now -1.5% under the 20-SMA, a classic post-spike digestion. RSI 52.85 has fully unwound the overbought condition without breaking trend. On the daily/weekly, $22 is the immediate resistance (double top area) and $16.50–17.00 is the first meaningful support (pre-gap consolidation), with $15 the trend-defining level. The AI forecast is uniformly bearish (1d bull_prob 0.00, 1wk 0.00; forecasts of $11.84 / $13.48 / $14.47 on 4h/1d/1wk) — but the model's directional accuracy at longer horizons (h15–h20) is 0–17% vs 80–100% naive baseline, meaning the extended bearish targets are unreliable in this regime and should be heavily discounted. The credible technical read: consolidation between $17–$22 is the base case.
Signal: (1) Aug 10 Q4 results — revenue $373.9M vs $359.3M est, adj EPS $0.50 vs $0.44, guide above consensus, stock +36% on the day; (2) Aug 20 Zacks upgrade to Rank #1 Strong Buy on rising estimates; (3) analyst target lifted twice, $19 → $21.20 → $22.40 (+18% cumulative), Recom score 1.00 (unanimous strong buy on the covered set); (4) sell-side highlights 'exceptionally strong carrier demand and economics in auto insurance' plus HomeBuddy contribution. Counter-signal: a cluster of insider selling — CFO Wong ($528k on Aug 7, $239k on Aug 18) and Director Ahmed (four sales totaling ~$824k Aug 11–17) — is meaningful given it's clustered right into the post-earnings spike; not a thesis-breaker, but it caps near-term upside conviction. The L1 bearish EPS-estimate revision for next year (-9.2pp) is worth watching but was overwhelmed by the print.
- Auto insurance carrier demand cycle — management flagged 'exceptionally strong carrier demand and economics' driving Q4 revenue acceleration to +42.7% YoY
- HomeBuddy acquisition scaling in Home Services segment, called out as a Q4 driver
- Next-quarter guide of ~$375M (above $359M consensus) implies growth persists into FY27 Q1
- Financial Services segment expansion with growing client relationships per management call
- Sell-side EPS growth of 17.6% next year and 21.2% over next 5Y at PEG 0.48 = growth-at-a-reasonable-price setup
- Insider selling cluster: CFO and a director dumped ~$1.6M in the two weeks post-earnings — most conviction-lowering signal in the tape
- Low gross margin (11.3%) and operating margin (3.2%) mean small volume slippage flows through as large earnings misses
- Performance marketing is cyclical and carrier ad-spend can reverse quickly if insurance loss ratios spike
- 8.2% short float with 5.2 short ratio — indicates skepticism but also potential squeeze fuel; two-way risk
- L1 bearish revision to next-year EPS estimates (-9.2pp) suggests analyst optimism may already be topping
- Stock has run +53% in the last quarter and +63% in six months — mean-reversion risk elevated per the forecast model, even if its extended targets are unreliable
Get AI analysis on any stock
This is one of hundreds of Kronos AI reports — scored fundamentals & technicals, bull/base/bear price targets, a multi-horizon plan, and continuously-updated forecasts across the market. Create a free account to explore them all.
Create your free account →Already a member? Sign in · Join our Discord