RCL — AI Stock Forecast & Price Targets
Published 9/4/2026 · A free sample of K3vl4r’s AI-powered analysis.
Kronos price forecasts, scored fundamentals & technicals, and a multi-horizon plan.
View the live RCL price forecast →
RCL is a fundamentally strong cruise operator (27% op margins, 45% ROE, forward P/E ~13x, PEG 0.92) trapped in a full-stack technical breakdown — RSI 25.8, -9% below 20-day, -11% below 50-day, -7.7% below 200-day SMA, down 27% from the 52-week high. The setup is oversold with real catalysts on the horizon (Oct 27 earnings, H2'26 capex peak, 2027 FCF inflection), but calibration says prior base targets have run ~15-16% optimistic and the tape has systematically dominated fundamentals on this name — this is a staged ACCUMULATE, not a chase.
1-4 week view: initiate a small starter position (25-33% of intended size) in the $260-268 zone with the stock at $265 and RSI 25.8 — oversold enough that a bounce toward the 20-day SMA (~$292) is plausible, but the tape has dominated fundamentals on this name so do not chase. Add on either (a) a reclaim of $280 with a green daily candle on volume, or (b) a flush to $245-250 that holds. Hard invalidation: sustained close below $232 (52-week low). Expect chop into the Sep 17 ex-div (~$1.50 mechanical step-down) and rising vol into the Oct 27 print. Do not go full-size before earnings — that has been a consistent lesson on this name.
1-6 month view: the setup is asymmetric IF (a) Oct 27 earnings do not extend booking softness into 2027 wave season, and (b) Q3'26 capex confirms Q2's $2.7B was the peak. If both print, a re-rate toward the 20-day/50-day cluster and then $300-305 is reasonable — that's a ~15% upside from here. If the earnings print reveals demand deterioration or another capex overshoot, downside to $232 (52w low) then $210-215 is the risk. Expected return range on base case: +10 to +18%; on bear case: -12 to -18%. What would change my mind bearish: another management commentary flag on 2027 bookings, or a debt raise that does not accompany capex peak commentary. What would change my mind bullish: insider buying cluster, or a clear beat-and-raise on Oct 27.
1-3 year view: the terminal thesis is that RCL's premium fleet mix (Icon-class, Celebrity, Silversea) sustains 25%+ operating margins, the 2027-28 FCF inflection funds absolute deleveraging (not just refinancing), and the equity re-rates toward a mid-teens forward multiple on normalized $22-24 EPS. That's a $280-360 fair-value zone on 2028 numbers. The biggest structural risk is not competitive — Carnival and NCLH are similarly positioned — it's the balance sheet: $23.5B of debt with a 0.21 current ratio means a real demand shock forces either dilution or distressed refinancing. This is a quality operator with a fragile capital structure; sizing must reflect that.
The operating story remains genuinely strong: Q2'26 revenue of $4.83B (+15% YoY implied), operating margin 27.1%, net margin 23.3%, and TTM ROE of 45%. Gross margins are holding near 47-50% and operating income is compounding sequentially ($934M → $1,162M → $1,308M over the last three quarters). Where the fundamentals show real strain is the balance sheet and cash conversion: $23.5B total debt vs only $875M cash, debt/equity 2.24x, current ratio 0.21, working capital -$9.2B, and TTM free cash flow of -$1.5B driven by a $2.7B Q2 capex print that likely marks the cycle peak. The Aug 20 8-K disclosed a $1.24B new loan explicitly used to refinance existing debt — this extends the maturity wall but does not reduce absolute leverage, and this tape has consistently faded such actions. Capital allocation is mixed: the reinstated $1.50/qtr dividend (22% payout, ex-date Sep 17) is a credible confidence signal, but insider activity shows a $4M CEO sale on Jul 29 with no offsetting buys. Valuation is attractive on forward numbers (fwd P/E 13.1x, PEG 0.92, EV/EBITDA 13.7x), but only if 2027 FCF inflection actually prints.
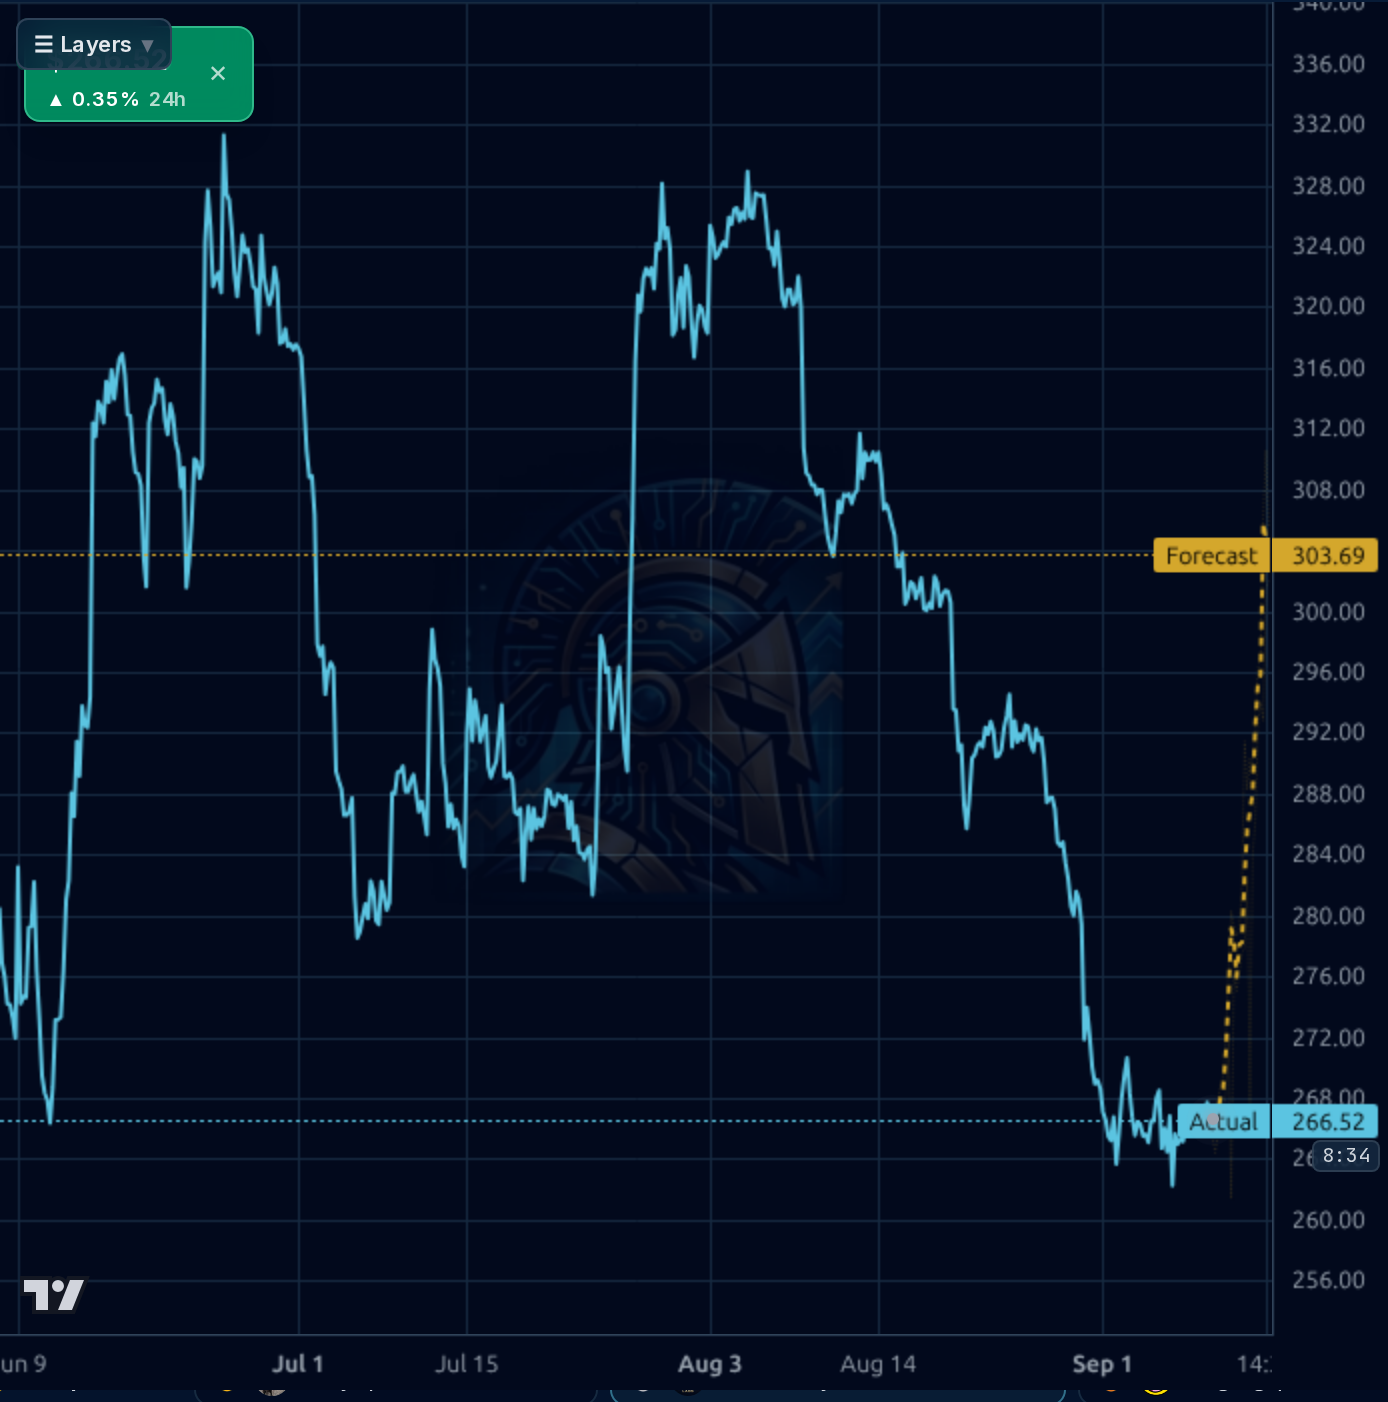
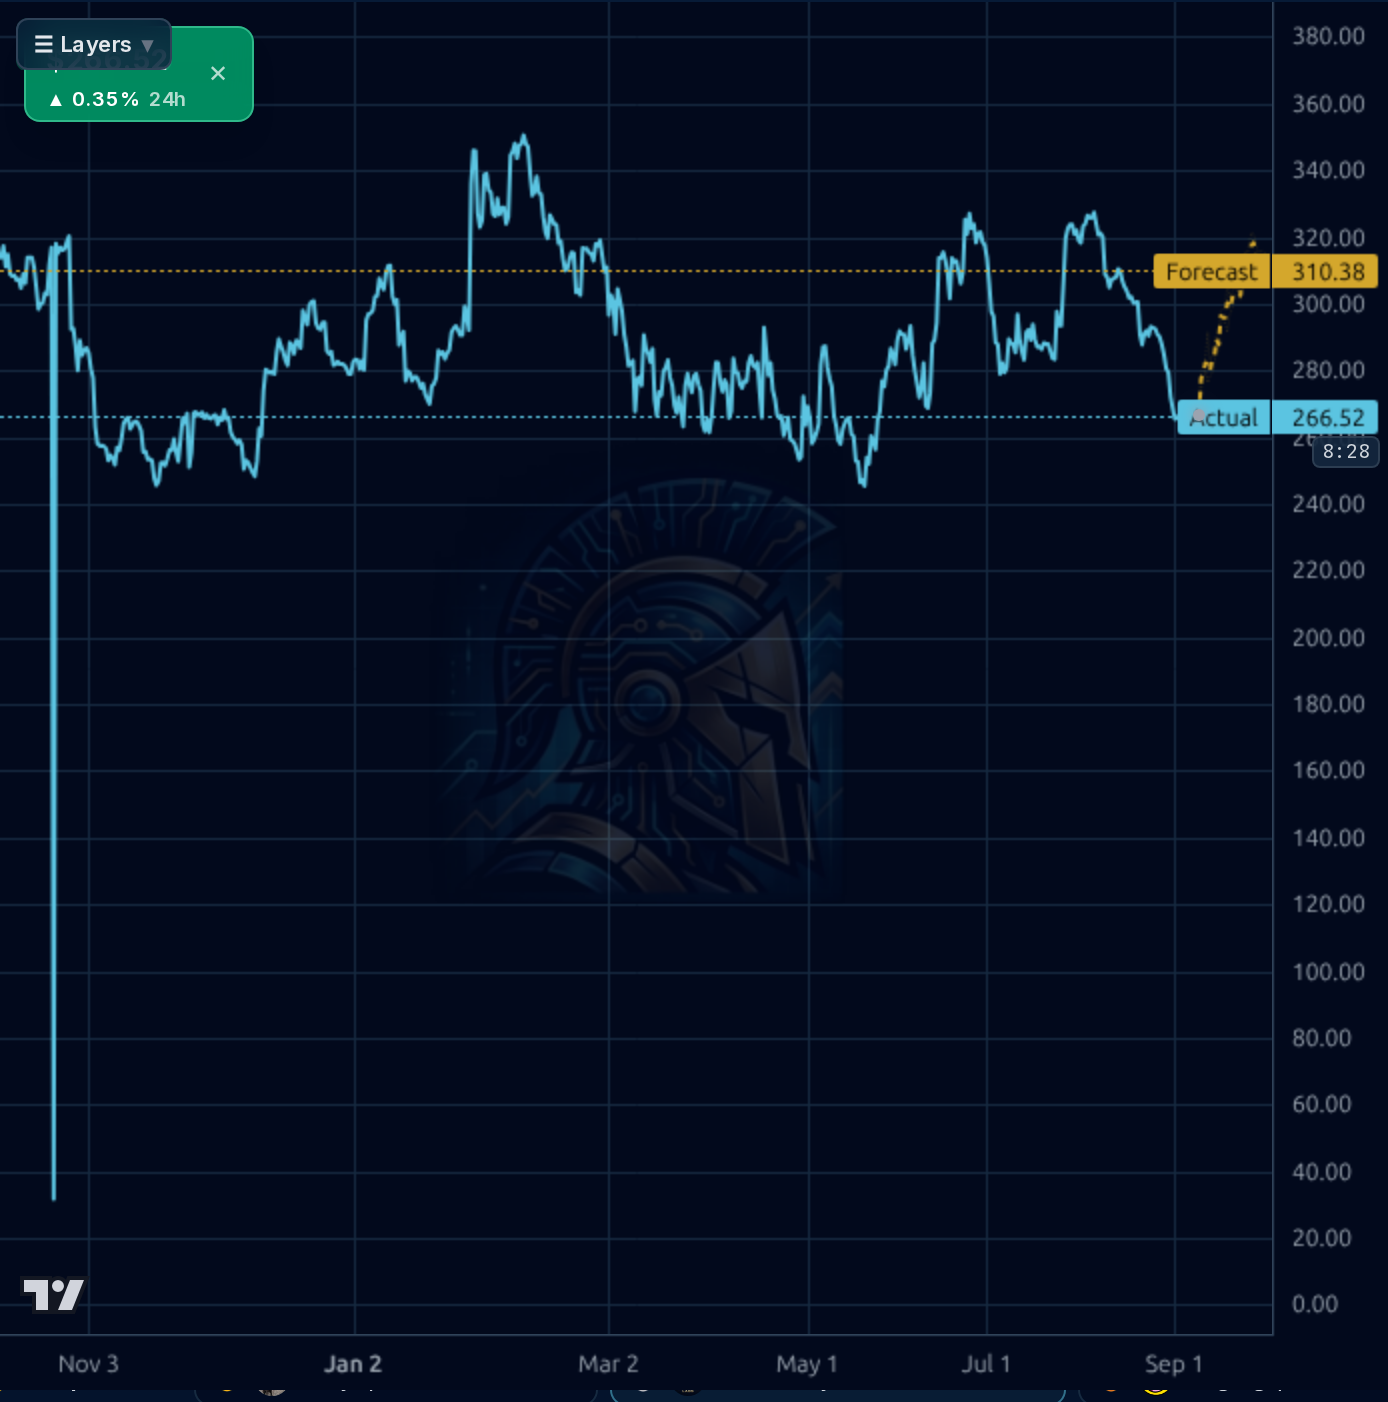
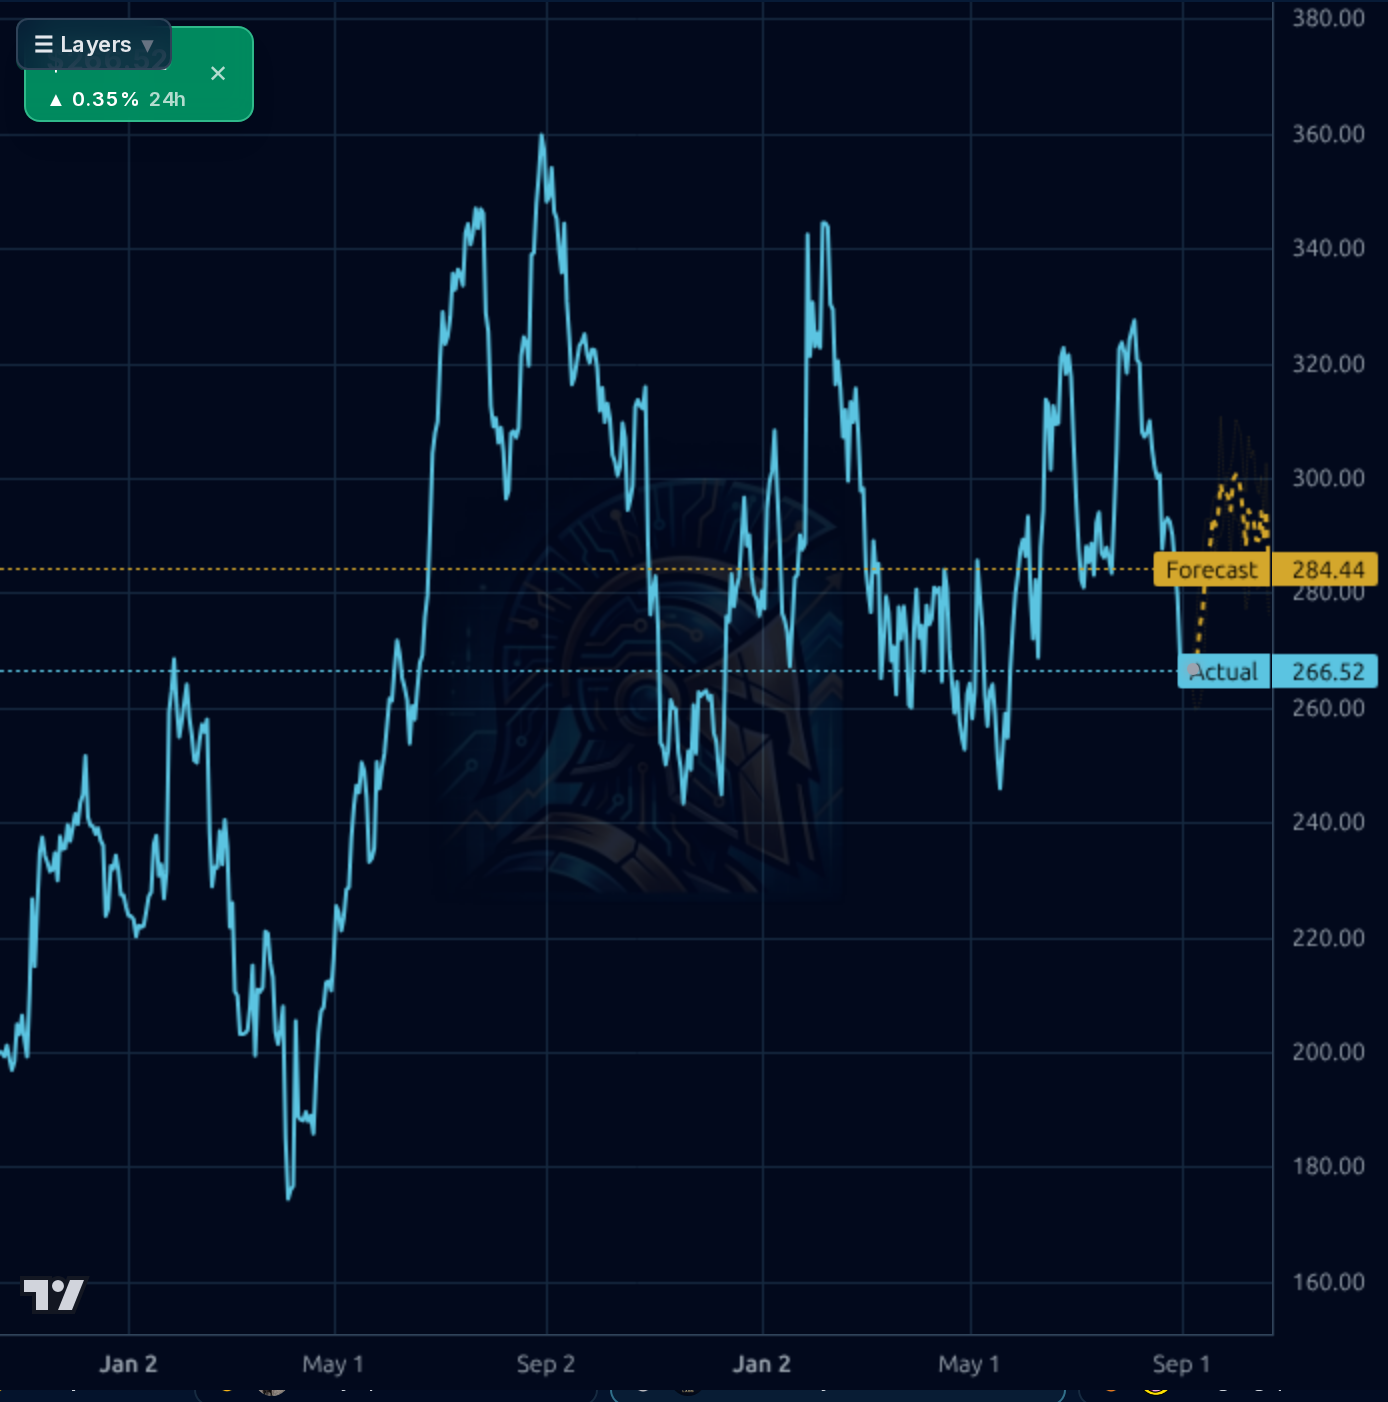
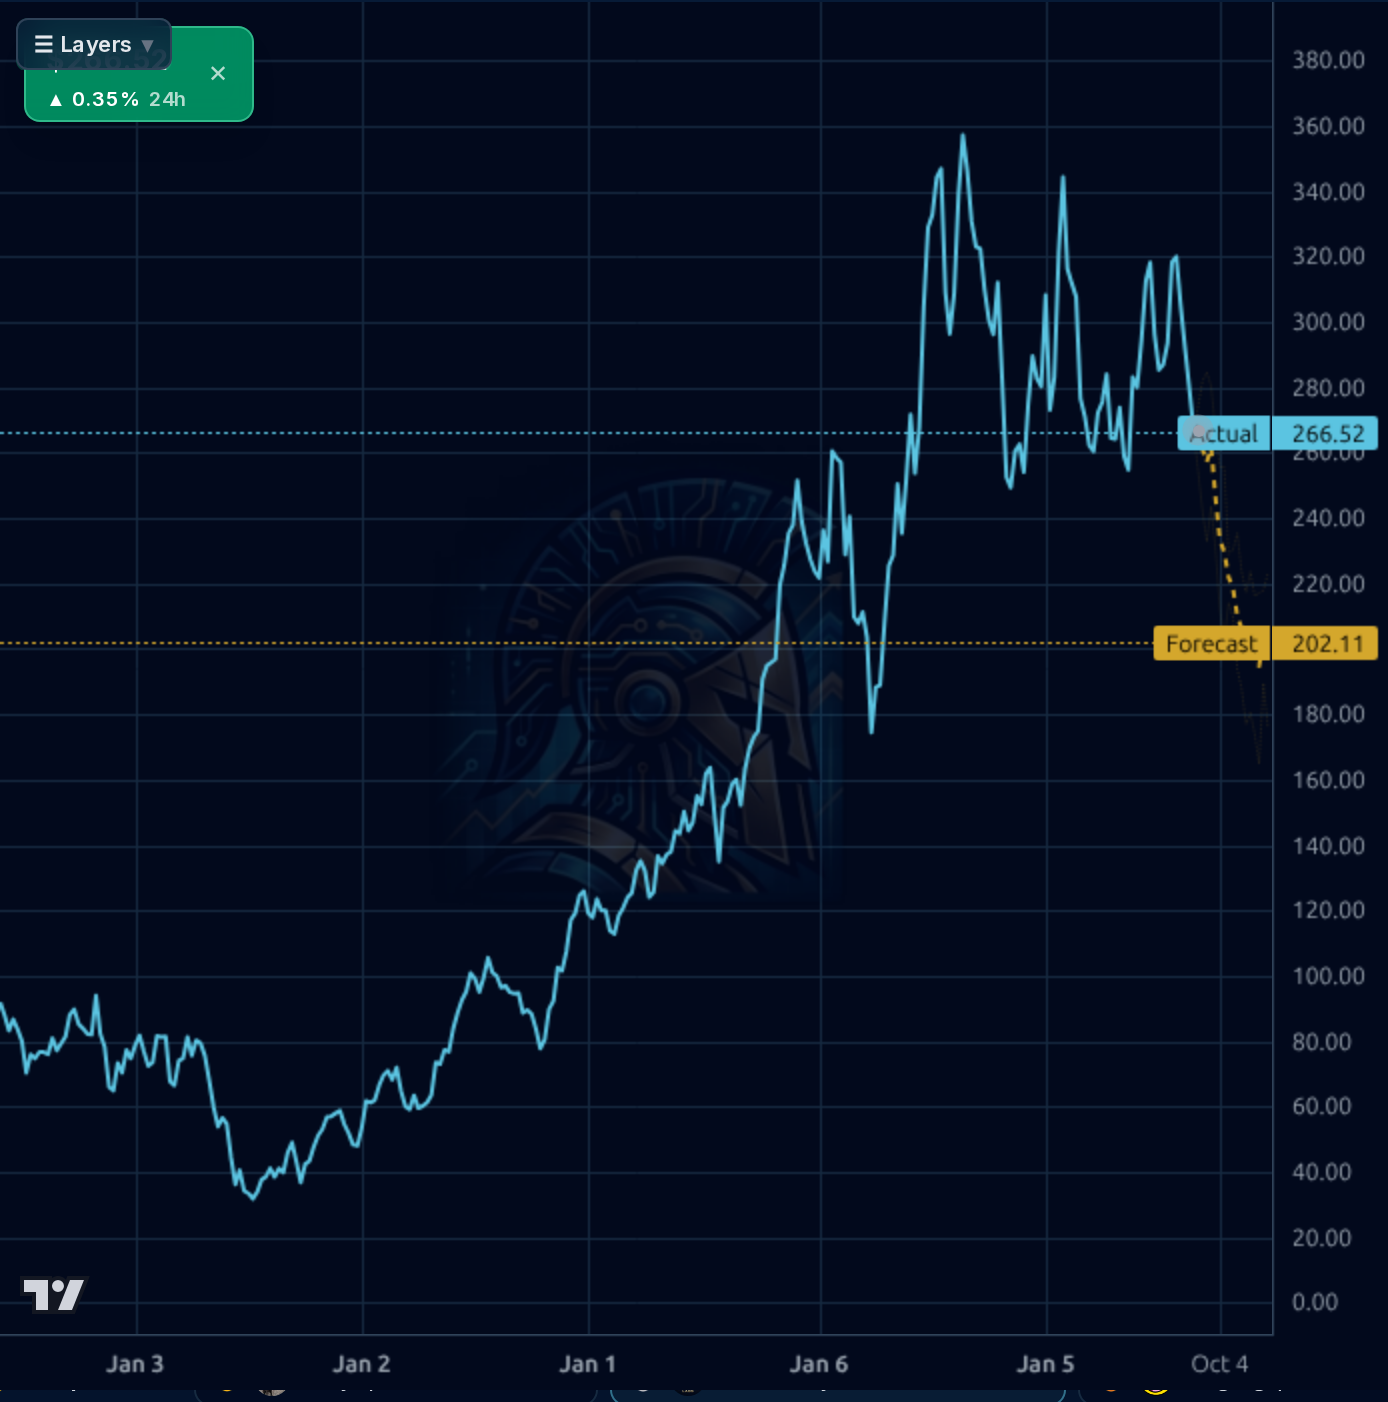
The chart is in a decisive downtrend across every timeframe I can see. On the 1h, price collapsed from ~$328 in early August to $266 with no meaningful bounce and the forecast band projects a snap-back to $303 that is not supported by the tape. On the 4h, the multi-month range (~$260-$320) has been tested at the lower bound and the forecast to $310 looks like a mean-reversion hope, not a signal. On the daily, RCL just broke a two-year uptrend structure — price is well below the ascending channel and RSI is 25.8 (oversold but not a reversal by itself on this name per prior lessons). The weekly is more constructive over a multi-year lens but is now rolling from $362 highs with a forecast band that skews DOWN to $202 — that is the only forecast panel not painting a v-bottom, and it deserves weight given the daily model's poor calibration (1d directional accuracy 76% vs 95% naive; 1wk 50% vs 100% naive — both beaten by the naive baseline, so discount the yellow bands aggressively). Immediate support is $260, then $245, then the 52w low $232.10. Resistance stack: 20-day near $292, 50-day near $298, then $305-310. First real technical evidence of a trend change requires reclaim of $280 on volume; failure of $260 opens $245 quickly.
[Correction: 8 recent article(s) were provided — see the news.] The most important primary-source items are the two August 8-K filings: a $1.24B loan on Aug 20 to refinance existing debt, and an earlier Aug 7 debt issuance for the same purpose. These are maturity extensions, not deleveraging — they buy time but historically get faded on this name. Secondary coverage is mixed: a Yahoo/StockStory piece frames RCL as a Wall Street favorite for long-term investors, and the Aug 27 tikr piece notes RCL raised profit guidance while trimming revenue targets on booking softness — that revenue-side softness is the market's actual concern and the reason the stock is where it is despite the profit beat. The Sep 1 dividend declaration ($1.50, ex-date Sep 17) is a modest positive. Broader market news is risk-off (defensive leadership, breadth deteriorating), which is a headwind for a high-beta (1.78) discretionary name with heavy leverage. Nothing in the news flow refutes the July booking softness flag; the Oct 27 earnings print is the real test.
- H2'26 capex peak rollover — Q2'26 capex of $2.7B likely marks the high-water mark, setting up material FCF inflection in 2027
- Premium/luxury per-passenger yield growth via Icon-class and Silversea remains ahead of pre-pandemic baseline per operating margin expansion to 27%
- Reinstated $1.50 quarterly dividend (22% payout ratio) with 2.26% yield — management's credibility signal on forward FCF durability
- Oct 27 Q3 earnings — key test of whether July booking softness has extended or refuted into 2027 wave season bookings
- Aug 20 refinancing of $1.24B extends maturity wall, buying runway for FCF-funded absolute deleveraging in 2027-28
- Extreme leverage: $23.5B debt vs $875M cash, current ratio 0.21, working capital -$9.2B — zero buffer for a demand shock, real dilution risk in a recession
- Full-stack technical breakdown: price below 20/50/200-day SMAs simultaneously, multi-year uptrend broken on the daily — oversold alone has not been a reversal on this name
- July booking softness flag unresolved; management trimmed revenue guidance while raising profit guidance — the market is voting on the revenue side
- Risk-off macro backdrop (defensive leadership, breadth deteriorating) is a direct headwind for a 1.78-beta discretionary consumer name
- Refinancing activity extends maturities but does not reduce absolute debt — the tape has systematically faded this pattern on RCL
- CEO $4M open-market sale on Jul 29 with no offsetting insider buys; watch for cluster confirmation
- Forecast models are beaten by naive baseline on both 1d and 1wk horizons for this name — the yellow bands showing v-bottoms should be discounted heavily
Get AI analysis on any stock
This is one of hundreds of Kronos AI reports — scored fundamentals & technicals, bull/base/bear price targets, a multi-horizon plan, and continuously-updated forecasts across the market. Create a free account to explore them all.
Create your free account →Already a member? Sign in · Join our Discord