RYAN — AI Stock Forecast & Price Targets
Published 8/10/2026 · A free sample of K3vl4r’s AI-powered analysis.
Kronos price forecasts, scored fundamentals & technicals, and a multi-horizon plan.
View the live RYAN price forecast →
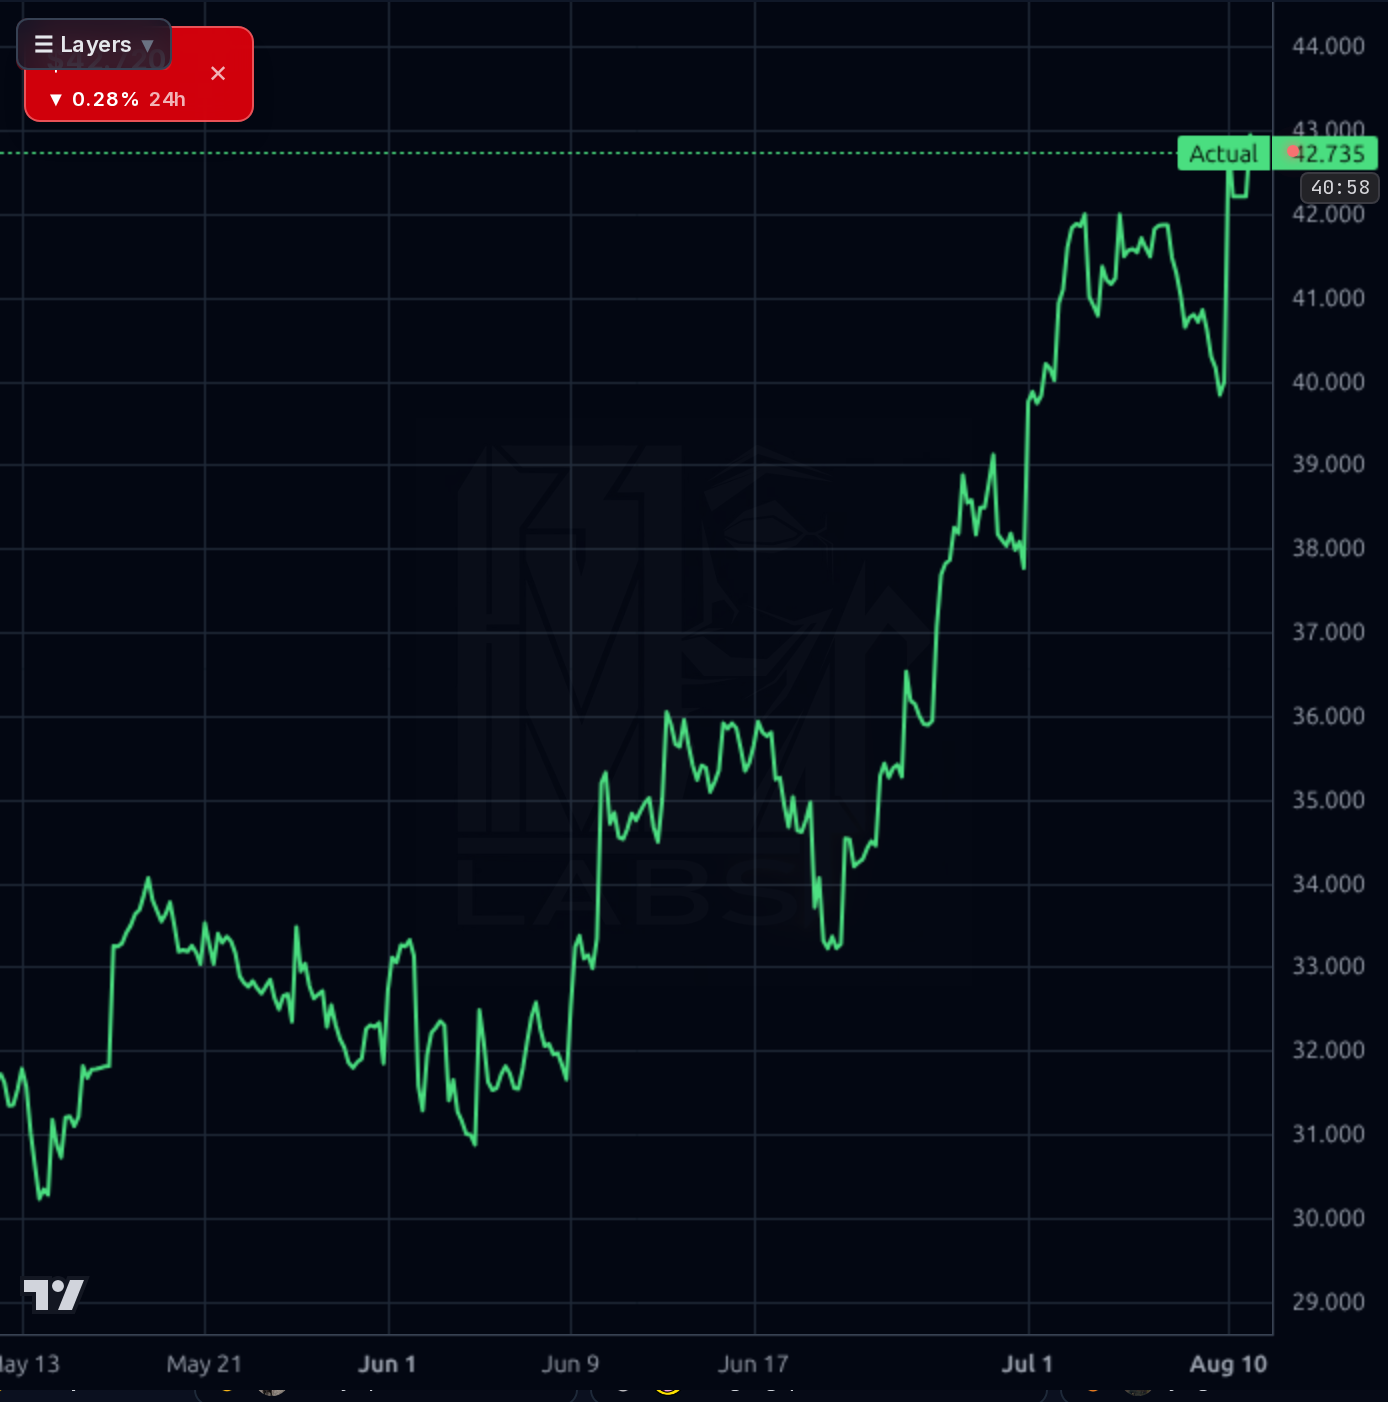
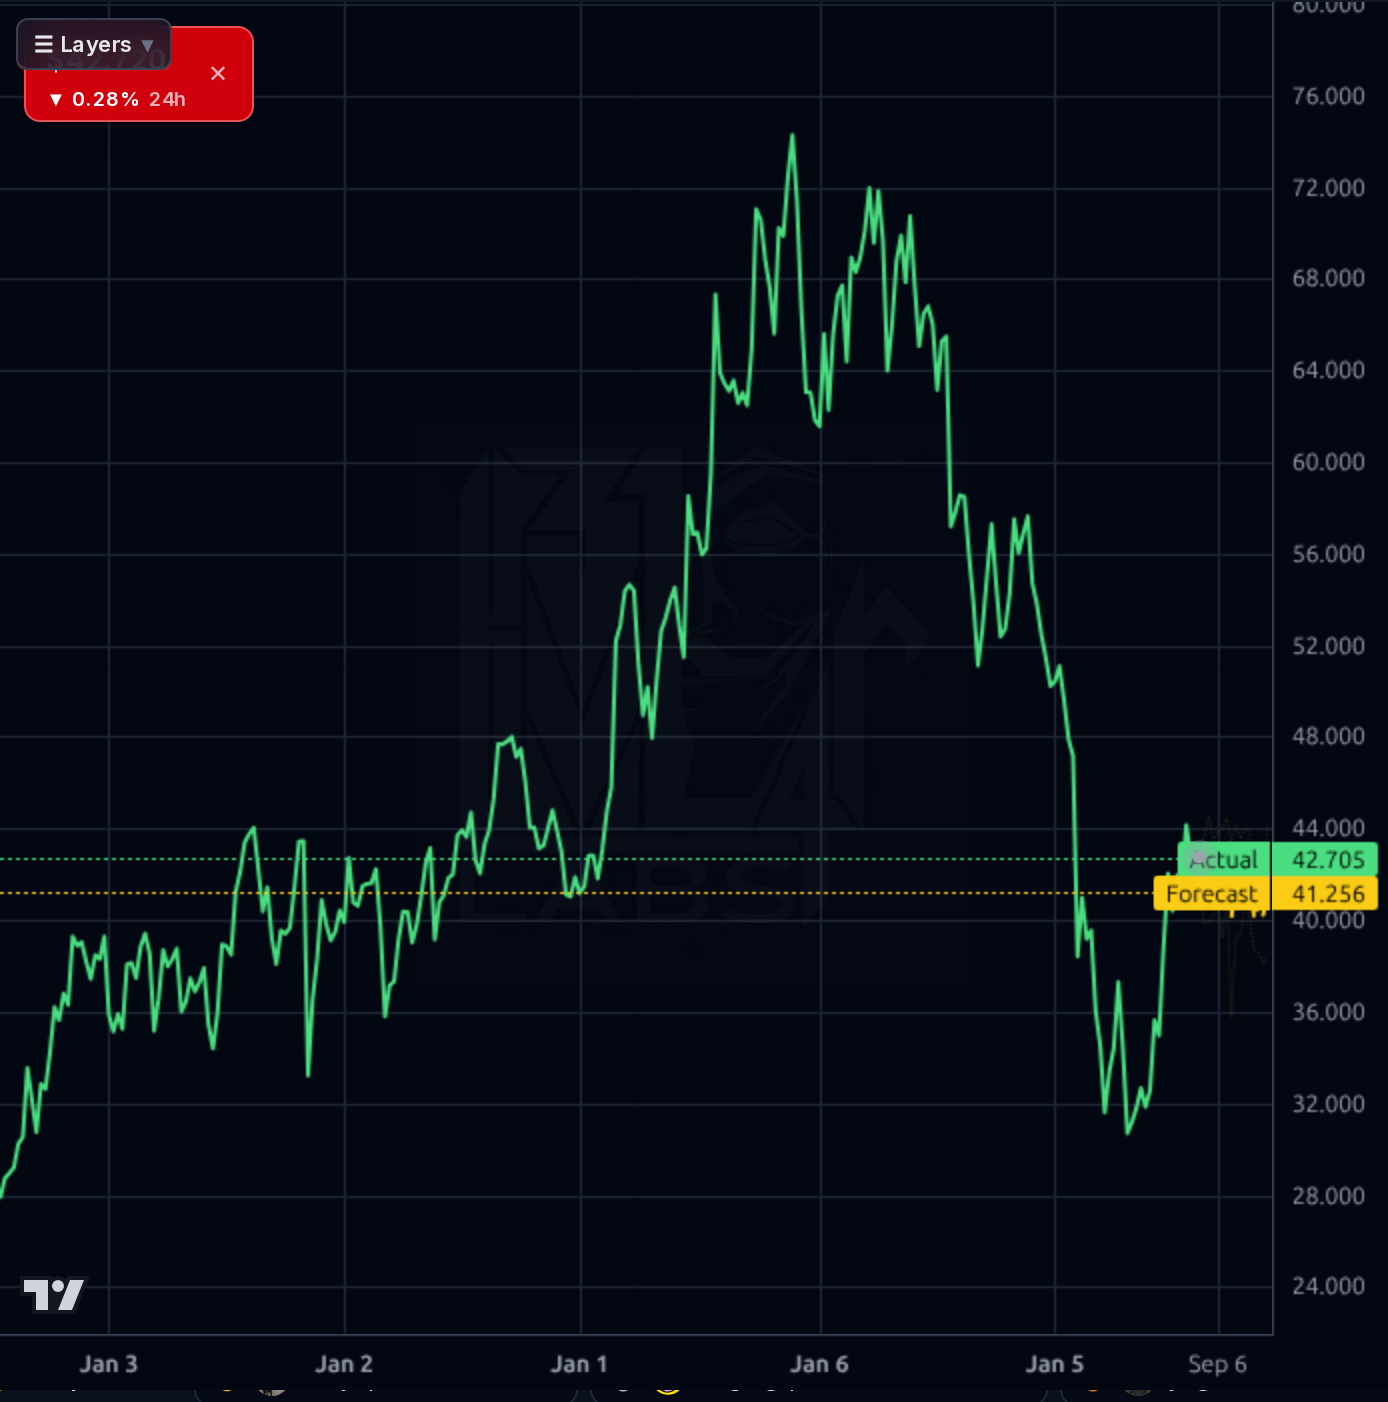
RYAN's near-term case hinges on Q2 momentum and analyst optimism, but stretched valuation (P/E 63x) and high leverage (D/E 7.5x) create significant downside risk. The chart shows a volatile trend with recent consolidation below $44, while forecast bands suggest limited upside without material catalysts.
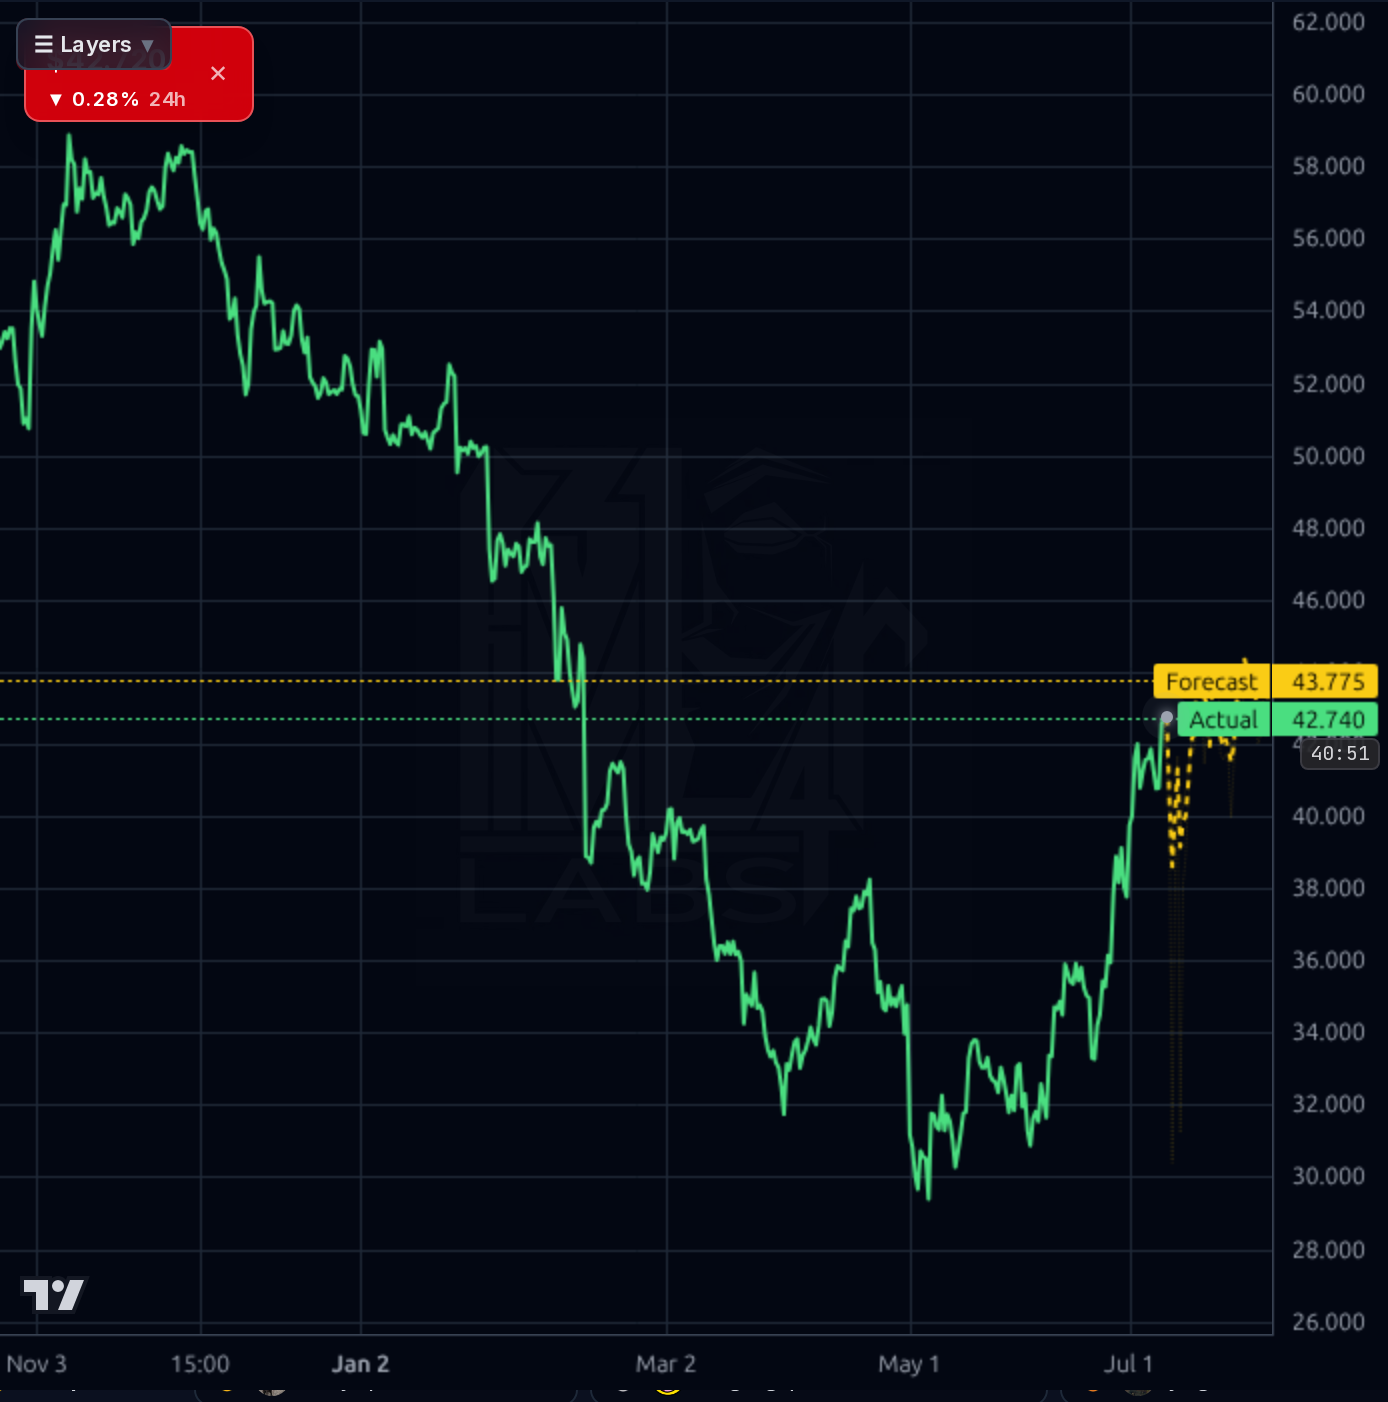
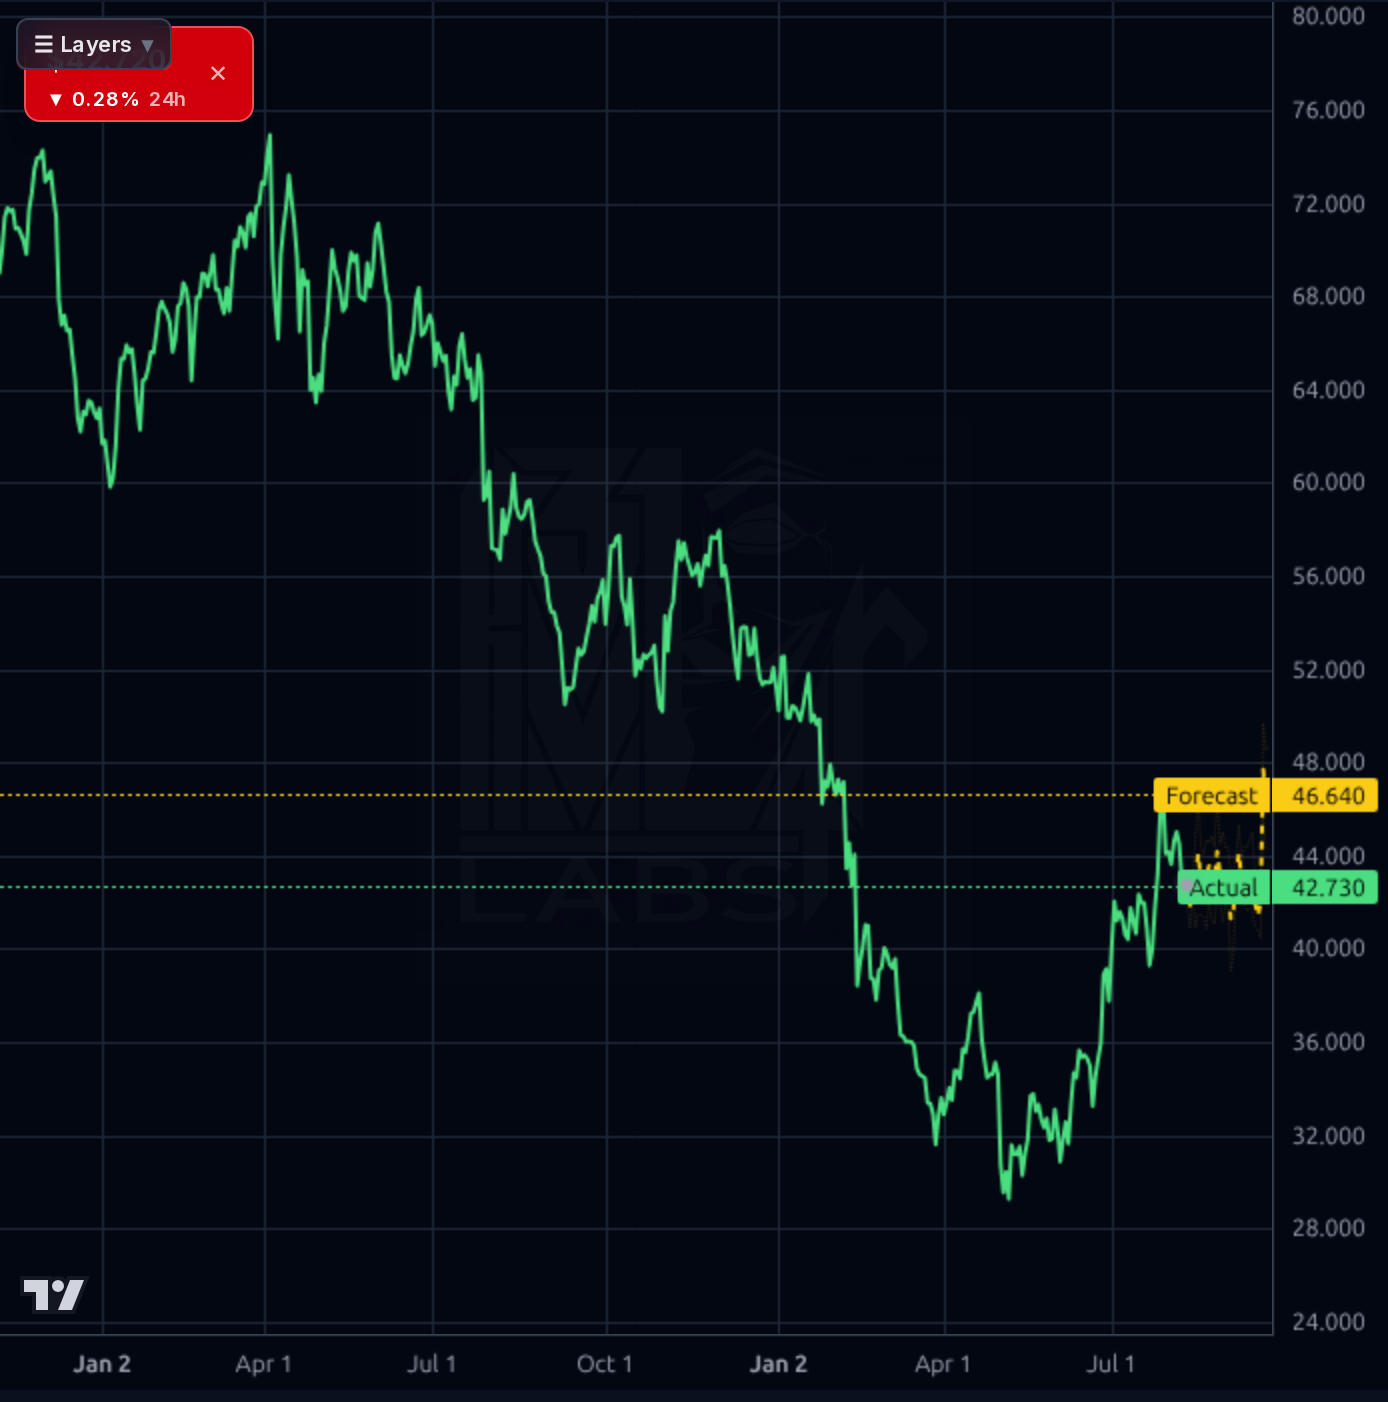
Hold near-term; watch for break above $44 to confirm bullish momentum. Invalidation at $40 support if price fails to hold the current forecast band ($42.73-$46.64). Sizing: 1-2% allocation with tight stop-loss below $40.
Accumulate on dips; Q3 earnings and debt refinancing progress are key catalysts. Target range $45-$50 based on analyst consensus (current target $49.44), but risk of multiple compression if growth slows. Change of mind: if short interest drops below 12% or FCF growth accelerates beyond $2.41.
Terminal thesis hinges on sustainable margin expansion and debt reduction; long-term value at $50+ requires consistent EPS growth to $3.00+. Structural risk is high due to leverage (D/E 7.5x) and valuation compression if interest rates rise. The stock remains below its 52-week high, suggesting unresolved headwinds.
Revenue grew 6.69% QoQ to $917M, with strong FCF of $276M in Q2. Operating margins held at 20.48%, but trailing P/E is elevated at 63x versus forward P/E of 17.8x. High debt-to-equity (7.5x) and a dividend payout ratio above GAAP earnings ($0.50 vs $0.68 EPS) create sustainability risks. Institutional ownership remains strong (90.88%), but short interest is elevated at 15.68% of float, indicating potential for volatility spikes on news.
The chart shows a volatile uptrend with recent consolidation below $44. Key support at $40 and resistance at $44-$47 are visible; the price has traded within forecast bands (42.73-46.64) but remains below 52-week highs ($61.05). The model's directional accuracy is low for short-term horizons (1d: 44% vs naive baseline), suggesting limited near-term upside without catalysts. Current price at $42.84 is within the forecast band, indicating technical neutrality.
Recent news highlights Q2 earnings strength and analyst target increases (UBS to $55, Citigroup to $53.5), but JP Morgan's Underweight rating and high short interest create counterbalance. The 1d chart shows price action aligning with forecast bands, suggesting limited momentum without new catalysts. The ex-dividend date (Aug 11) is minor but may cause a small price dip.
Get AI analysis on any stock
This is one of hundreds of Kronos AI reports — scored fundamentals & technicals, bull/base/bear price targets, a multi-horizon plan, and continuously-updated forecasts across the market. Create a free account to explore them all.
Create your free account →Already a member? Sign in · Join our Discord