SBS — AI Stock Forecast & Price Targets
Published 9/15/2026 · A free sample of K3vl4r’s AI-powered analysis.
Kronos price forecasts, scored fundamentals & technicals, and a multi-horizon plan.
View the live SBS price forecast →
SBS is a high-quality Brazilian regulated water utility trading at 12x P/E with strong operating margins (31%) and an analyst consensus of 1.00 (strong buy), but the near-term picture is muddied by negative free cash flow (-R$6.3B TTM), rising leverage (D/E 1.14), and a hot short-term rally (+13.9% MoM) that has pushed price back toward the mid-range of its 52-week band. The 1d model forecasts modest weakness and the 4h/1d Kronos forecasts skew mildly bearish, but the multi-year uptrend and improving analyst posture keep the mid-term risk/reward tilted positive.
Neutral-to-constructive over 1-4 weeks. Price is mid-range after a strong bounce; the 1d Kronos is bearish but its short-term track record is poor. Do nothing above $5.30 without a confirmed breakout of $5.45. Preferred setup: add on a pullback to $5.00-$5.05 with a stop below $4.85 (loss of the recent higher-low structure invalidates the bounce). If price breaks $5.45 on volume, that opens a run to $5.70-$5.97. Position sizing: modest starter (25-40% of intended full size) — the recent 14% one-month rally means chase risk is elevated.
Constructive 1-6 month view. Analyst consensus target $5.97 implies ~14% upside, and next earnings on Nov 5 is the key catalyst — a positive FCF inflection or clearer capex peak commentary would re-rate the multiple. Expected total return range: -8% to +18%. Base case is drift to $5.70-$5.90 as institutional accumulation continues and macro backdrop stabilizes. Change my mind if: (1) leverage jumps further above D/E 1.2, (2) EPS misses again and the trend of -24% Q/Q EPS extends, (3) BRL weakens materially versus USD, hitting the ADR. Central bank rate policy in Brazil is the swing macro variable.
1-3 year thesis is positive: SBS is executing a generational infrastructure build-out (universal-access program) that, once past the capex peak, should deliver a step-function improvement in FCF and support both dividend growth (5Y dividend growth 55%) and multiple expansion. Long-run drivers: regulatory rate base growth, urbanization, sewage coverage expansion, and Brazilian real economic normalization. Terminal thesis: a stabilized ~15%+ ROE utility trading at 14-16x earnings with rising payout — implying a $7-9 range in a base bull case within 2-3 years. Biggest structural risk: regulatory or political intervention on tariffs (this is a São Paulo state asset), plus balance-sheet distress if capex overruns coincide with a Brazilian rate shock.
Revenue growth is real — TTM sales +9.4% Y/Y and Q/Q sales +27.7%, with the last four quarters showing consistent scaling (R$9.4B → R$11.3B → R$10.0B → R$10.2B). Margins are enviable for a utility: gross 35.7%, operating 31.5%, net 19.7%, ROE 18.75%, ROIC 8.56%. However, the profitability story is deteriorating at the margin — EPS Q/Q -24%, EPS Y/Y TTM -22.8%, and the EPS surprise was -29%, likely reflecting higher financing and depreciation costs from the post-privatization capex ramp. The balance sheet is stretched: total debt R$51.7B vs equity R$45.2B (D/E 1.14), and debt has climbed materially from R$34.9B in Sep-25 to R$51.7B in Jun-26 (+48% in nine months). Free cash flow is deeply negative (-R$6.3B TTM) driven by capex of ~R$3.5-5.1B per quarter — this is the classic 'universal-access program' investment cycle, with a R$40B contracted backlog per the Q2 call. Cash of R$4.2B and a current ratio of 1.47 provide adequate but not lavish liquidity. Payout is a modest 20%, preserving flexibility. Bottom line: operational engine is intact and growing, but capital intensity and leverage are the swing factors on equity value.
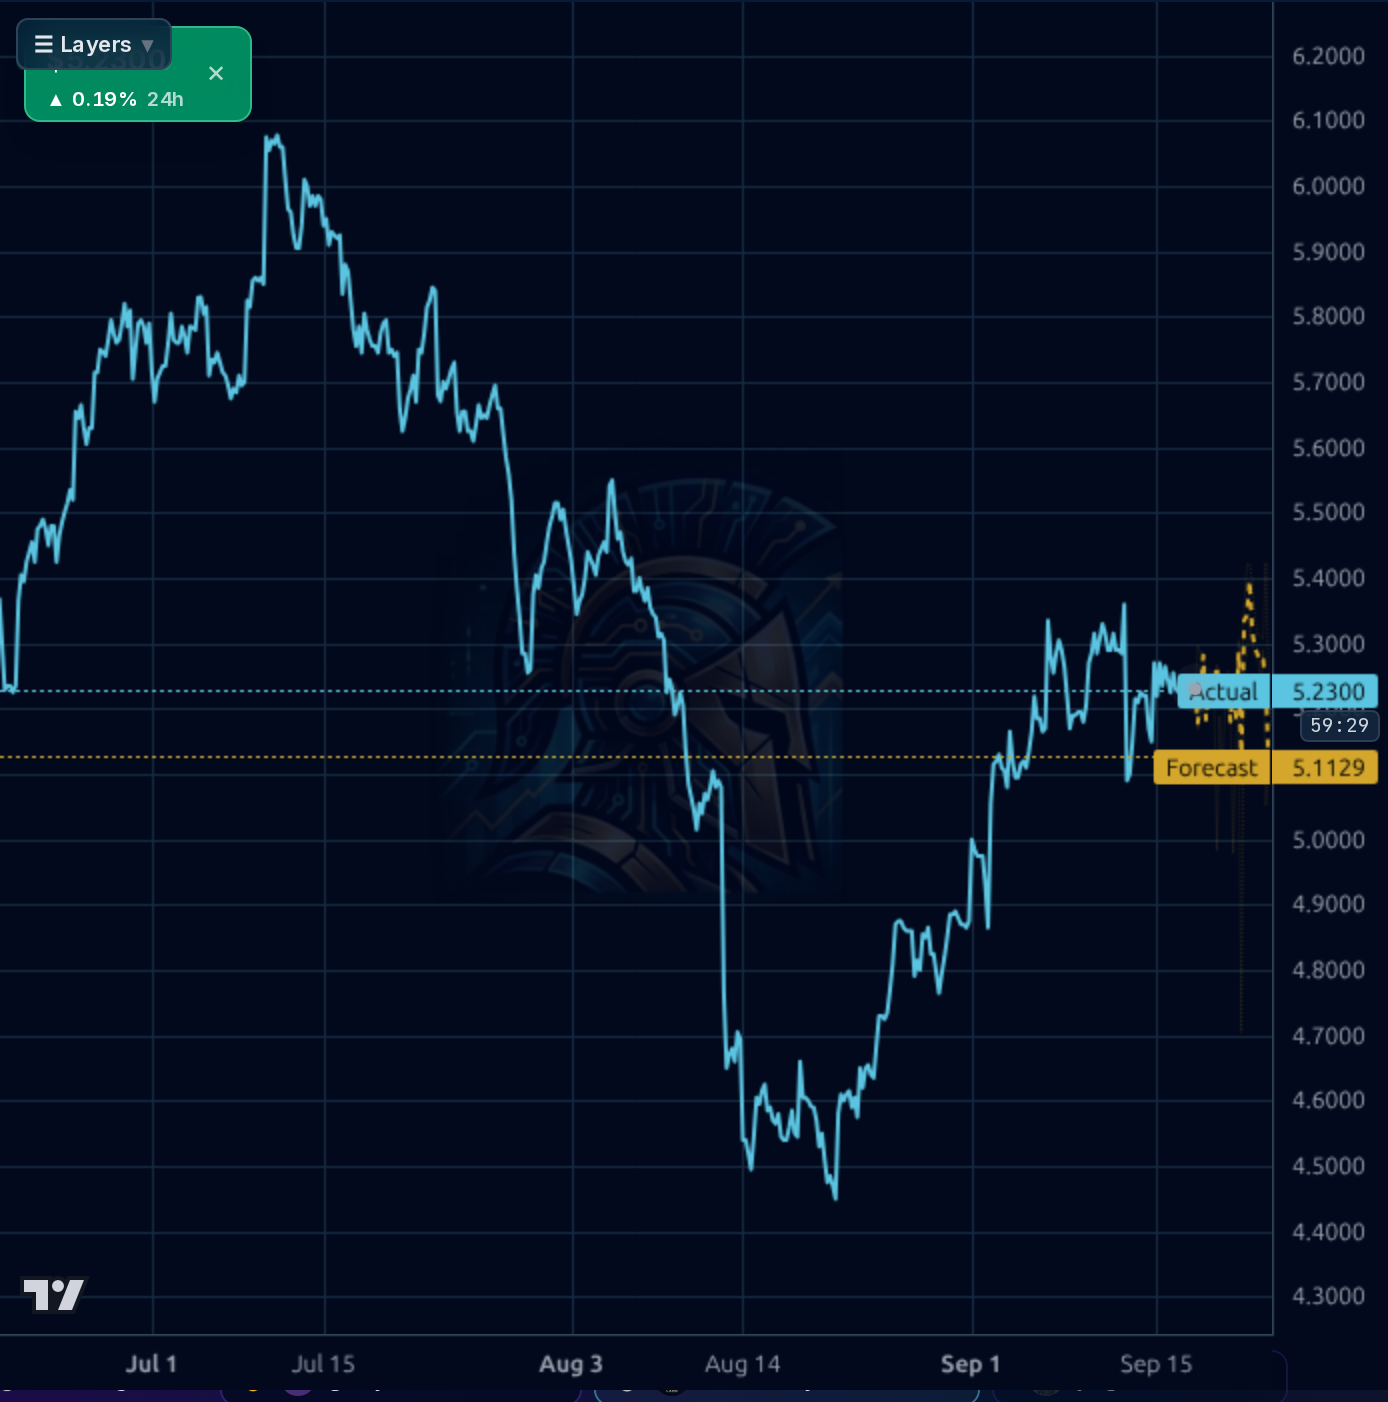
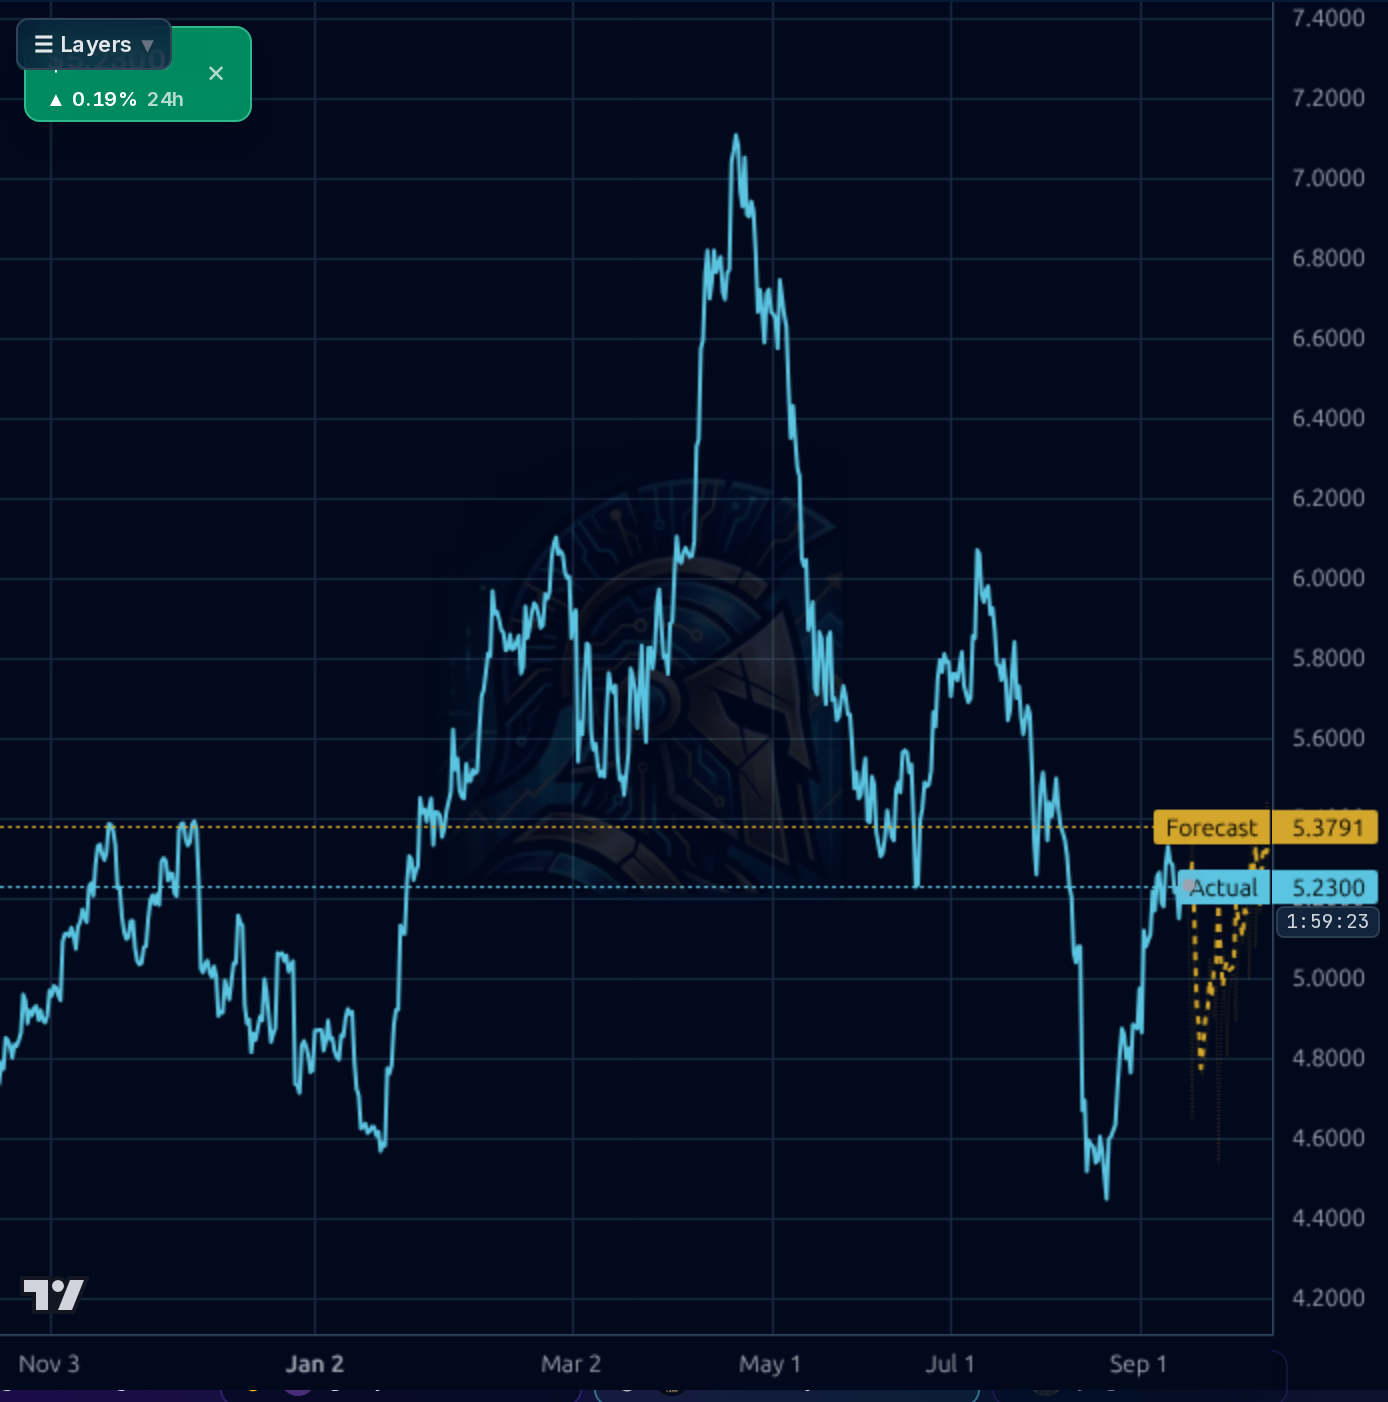
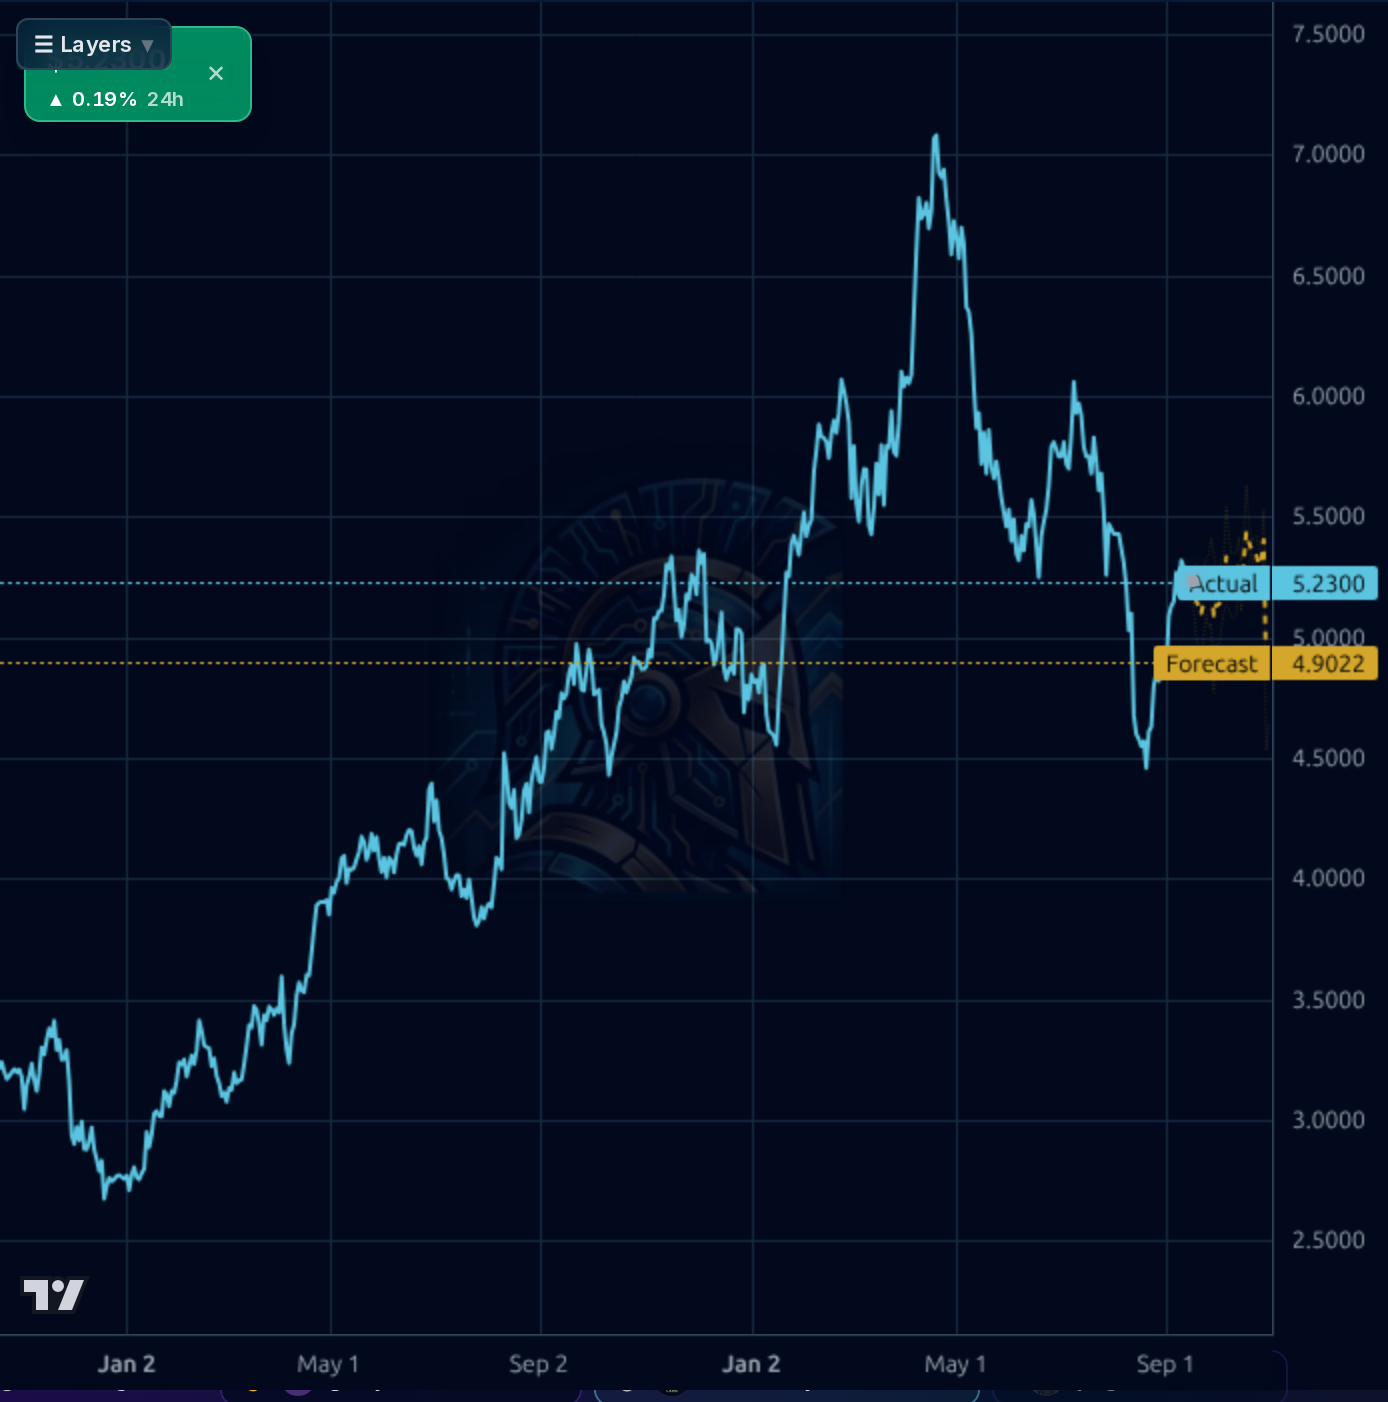
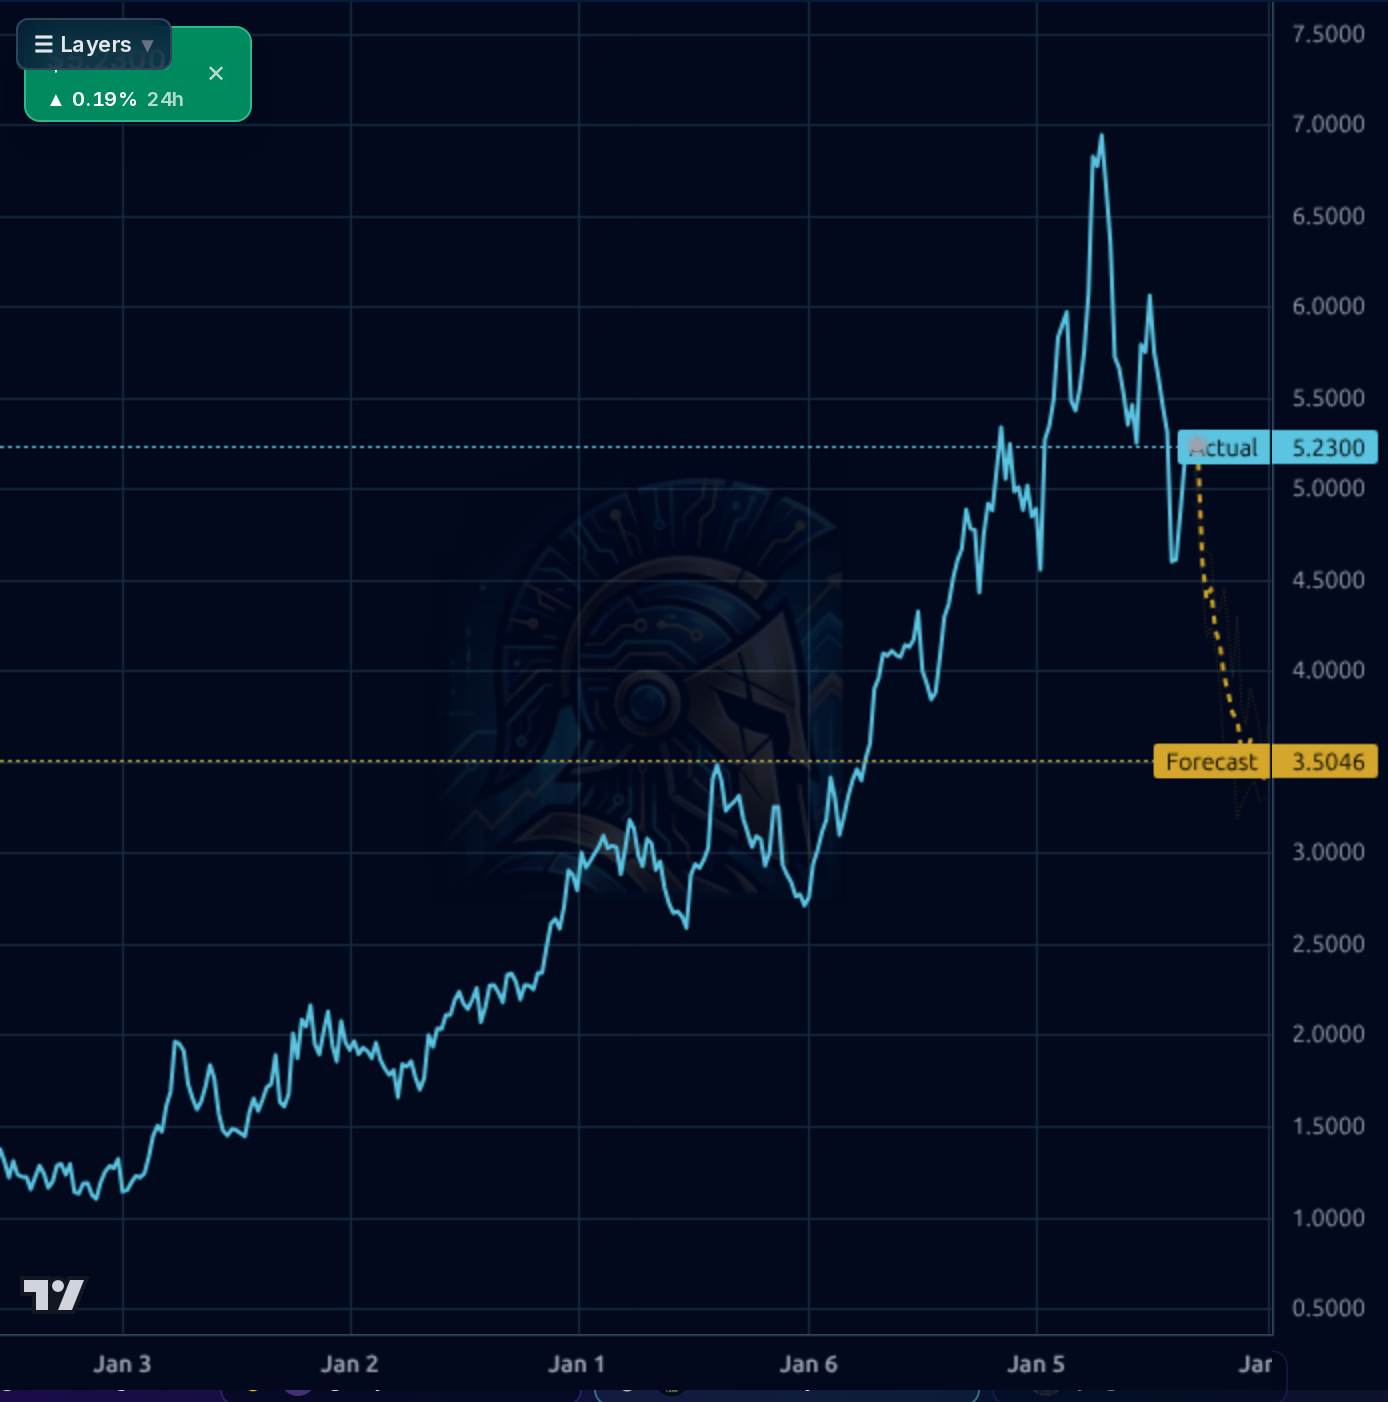
Across timeframes the picture is mixed. The 1wk chart shows a powerful multi-year uptrend from ~$1.20 to a $7.16 peak, followed by a corrective drop to $4.43 and a bounce back to $5.23 — the long-term trend is intact but momentum has decisively rolled over from the highs. The 1d chart shows price recovering off the $4.43 low, now sitting between the 50DMA (basically flat, -0.6%) and 200DMA (-5.5%), while the 20DMA is +6.1% below price — a short-term momentum recovery inside a broader consolidation. The 4h forecast points to a modest bounce toward $5.38 (Kronos base), while the 1h model shows churn around $5.11-5.23. The 1d Kronos forecast is notably bearish at $4.90 (below current), and the 1wk Kronos is aggressively bearish at $3.50 — but the model's own realized 1wk accuracy is 17% vs 83% naive baseline, so that weekly bear call must be heavily discounted. Key levels: support $5.00 (recent breakout retest), then $4.80, then the $4.43 low; resistance $5.45 (prior consolidation top), then $5.70, then $6.00. RSI 56.7 is neutral-constructive. Short float is negligible (0.49%) — no squeeze fuel.
Signal: Q2 2026 (reported Aug) showed 9.4% revenue growth with higher costs and heavy investment, and management reiterated the R$40B contracted investment backlog tied to universal-access rollout — this validates the growth story but confirms the near-term FCF drag. Analyst rating was upgraded to 1.00 (strong buy) on Aug 24 and consensus target sits at $5.97 (+14% from spot), even though the target was cut from $6.88 to $5.97 in late August (a modest reset, not a downgrade). Institutional ownership jumped from 2.3% to 11.2% over ~45 days — a materially bullish positioning signal. Short interest ballooned 66% in July to 24M shares (still only 0.7% of float; days-to-cover 3.9) — worth noting but not decisive. Noise: generic Zacks value-comparison articles and the retail social chatter (which appears to be low-quality WhatsApp-group promotion, not organic conviction) should be ignored.
- R$40B contracted investment backlog for the universal-access program (per Q2 2026 call) — multi-year rate-base expansion driver
- Q2 2026 revenue +9.4% Y/Y and Q/Q sales +27.7% confirm demand and pricing tailwinds are compounding
- Institutional ownership jump from 2.3% to 11.2% over ~45 days signals professional accumulation and a potential floor-setting rotation
- Analyst consensus upgrade to 1.00 (strong buy) with $5.97 mean target — implies ~14% upside re-rating in the base case
- Post-2026 capex peak: normalization of FCF from -R$6.3B TTM toward positive territory would unlock dividend growth (currently only 20% payout)
- Negative free cash flow of -R$6.3B TTM with capex running R$3.5-5.1B per quarter — no near-term self-funding
- Total debt jumped from R$34.9B to R$51.7B in nine months (+48%); D/E 1.14 and rising in a still-elevated Brazilian rate environment
- EPS Q/Q -24% and EPS Y/Y TTM -22.8% show earnings compression despite revenue growth — margin/interest cost story worsening
- Regulatory/political risk on tariffs given São Paulo state ownership legacy and post-privatization tariff-setting scrutiny
- BRL/USD translation risk for ADR holders; Brazilian central bank rate policy directly impacts financing costs
- 1d Kronos forecast base is $4.90 (below spot) and 1wk model is deeply bearish — even if reliability is weak, points to potential short-term give-back
- Recent 14% one-month rally means the easy money from the $4.43 bounce is already made; chasing here has poor risk/reward
Get AI analysis on any stock
This is one of hundreds of Kronos AI reports — scored fundamentals & technicals, bull/base/bear price targets, a multi-horizon plan, and continuously-updated forecasts across the market. Create a free account to explore them all.
Create your free account →Already a member? Sign in · Join our Discord