
SUN— AI Stock Forecast & Price Targets
Published 7/6/2026 · A free sample of K3vl4r’s AI-powered analysis.
Kronos price forecasts, scored fundamentals & technicals, and a multi-horizon plan.
View the live SUN price forecast →
Sunoco LP (SUN) is a fuel distribution and midstream MLP trading near 52-week highs at $68.28 with a 5.49% distribution yield, strong Q1 2026 results (revenue +106% Y/Y, EPS +135% Y/Y post-NuStar acquisition), and a $75.86 average analyst target. However, the stock trades at a stretched 21.7x forward P/E with a 158% payout ratio, 1.85x debt/equity, and Kronos AI models forecast meaningful downside toward $54-66 over 1-3 months — a view supported by the fact that the model's naive baseline has beaten its directional calls badly in this regime. Net: a quality income vehicle with genuine M&A-driven growth, but priced for perfection into an August earnings print.
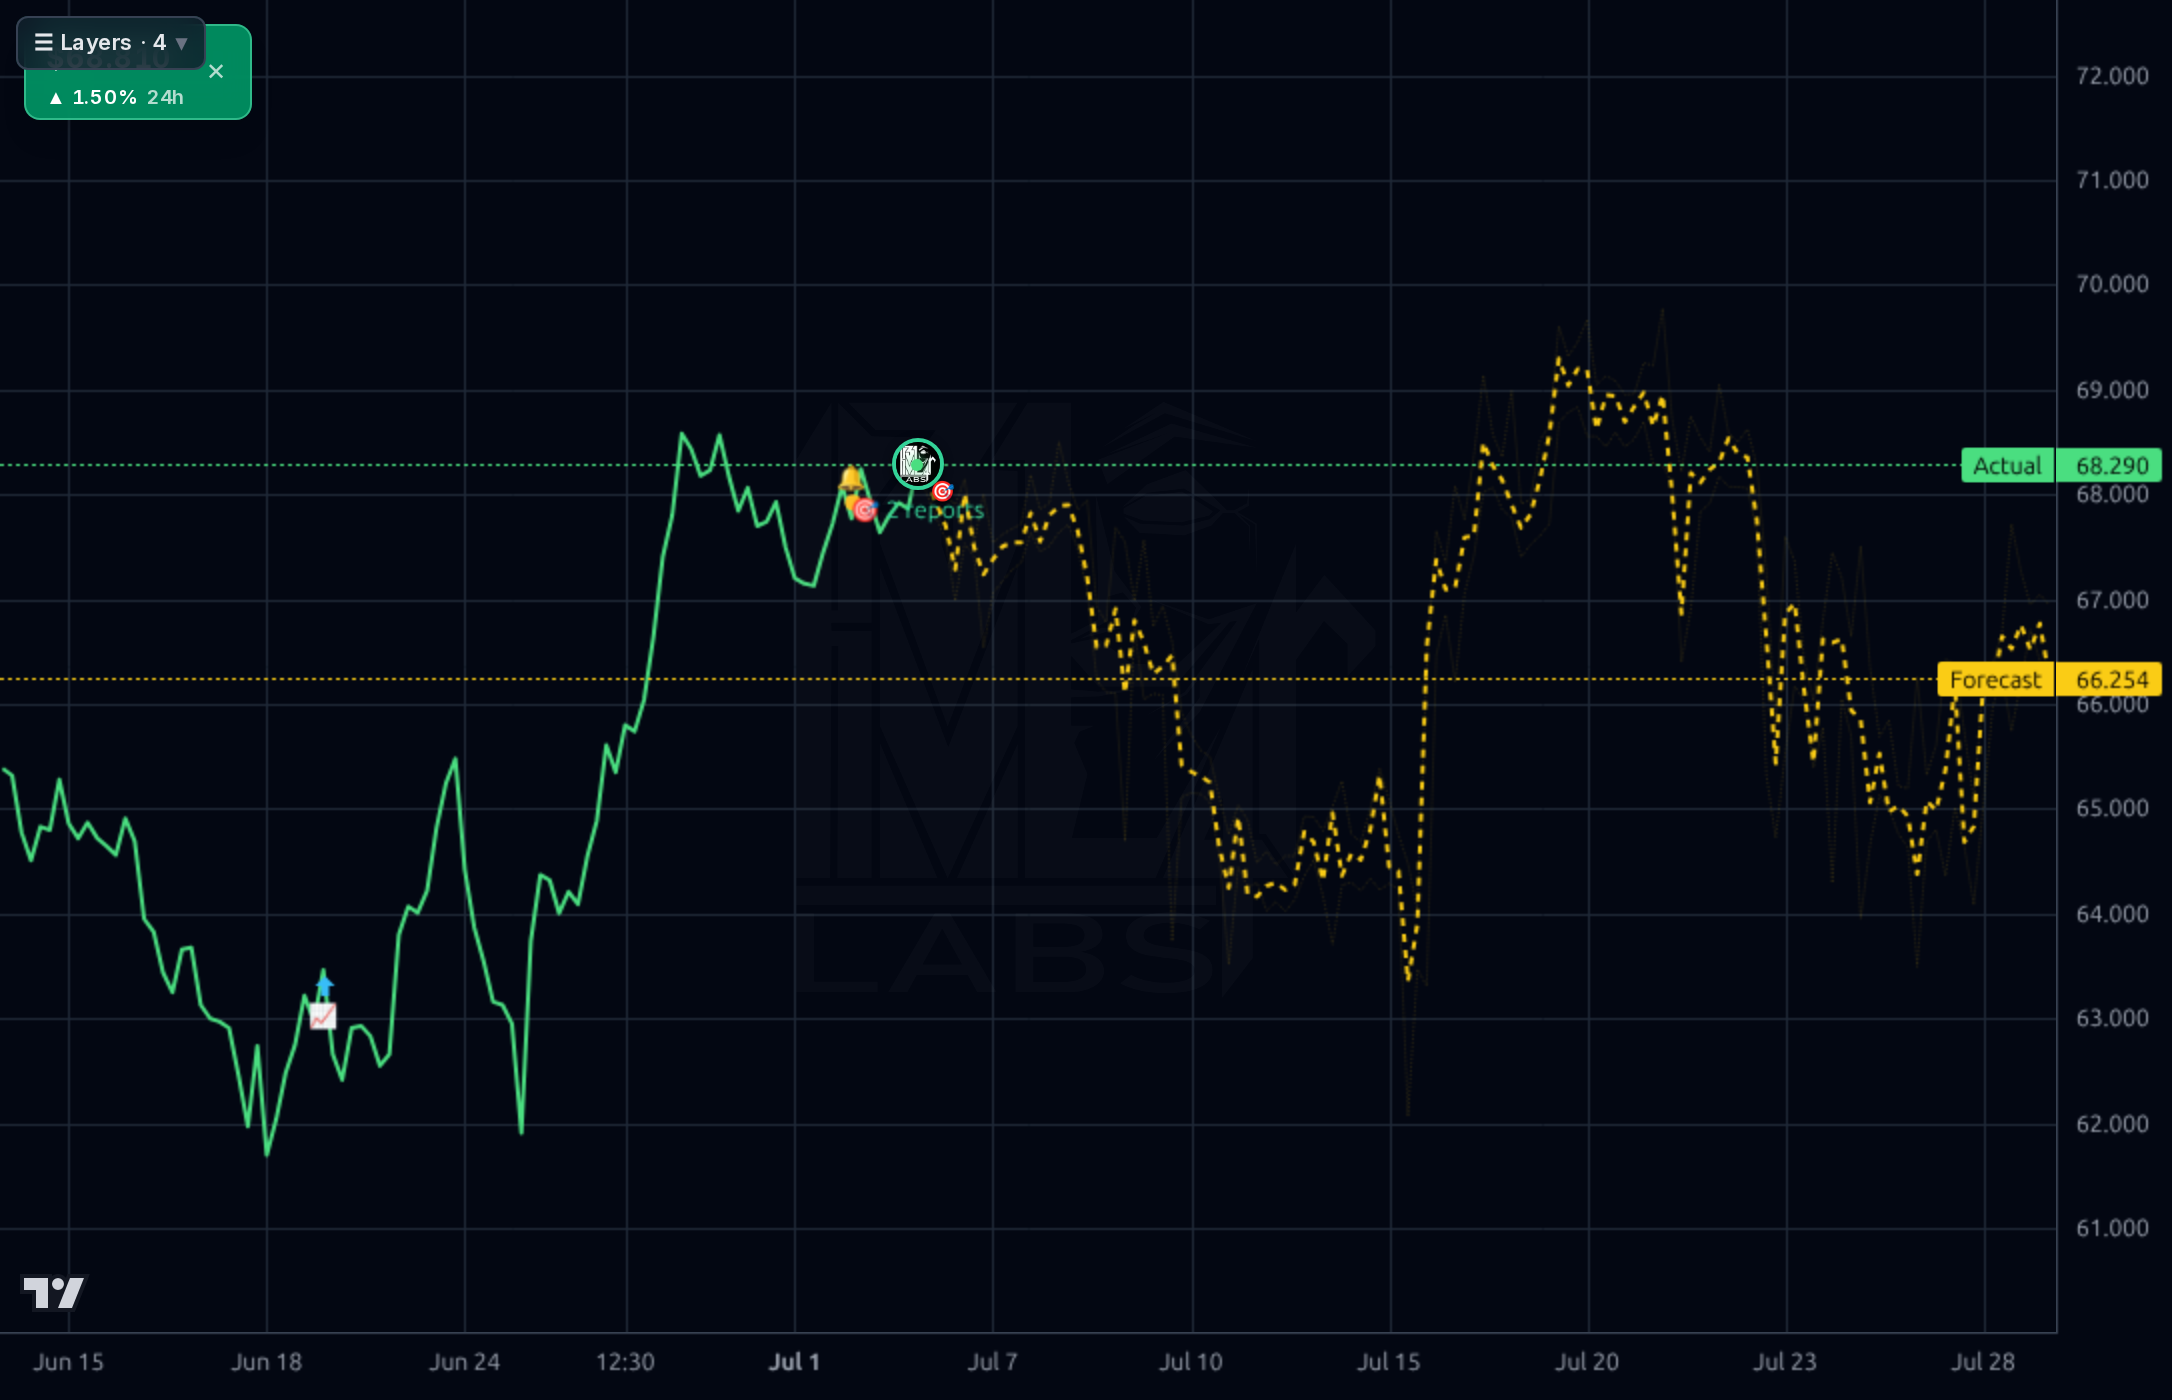
1-4 week view: HOLD or trim into strength. Stock is 6% below 52-week high with RSI 56.6 and RelVolume just 0.34 (low conviction on this leg). Earnings August 4 is a binary event — do NOT add ahead of it. If long, consider trimming 25-33% at $70-72 (52-week high resistance) and letting the rest ride into the print. Invalidation: a close below $65 breaks the June 26 breakout structure and would target $62 support. Kronos 1d forecast of $66 is essentially noise given 28% directional accuracy, but coincidentally aligns with a shallow pullback scenario that would be healthy.
1-6 month view: Constructive, target $72-78. Thesis: NuStar synergies continue to flow through, bolt-on M&A adds ~5% to EBITDA, distribution grows 5%+ providing a floor. Base case return: 5-12% price + 5.5% yield = 10-17% total. Catalysts: August 4 earnings (guidance update), bolt-on M&A announcements, any refinancing that lowers the ~$15.4B debt cost. What would change my mind: any softness in fuel volume trends, a distribution coverage miss (FCF vs distribution gap widens), or a Fed pivot to higher rates that pressures MLP valuations.
1-3 year view: A 5.5%-yielding, growing energy infrastructure MLP with a defensible fuel distribution moat and a newly integrated pipeline/terminals footprint post-NuStar. Terminal thesis: total return of 8-12% annualized (yield + modest distribution growth + minimal multiple expansion). Multi-year drivers: (1) US fuel distribution consolidation, (2) pipeline throughput growth from Permian/Gulf Coast, (3) terminals as EV-transition hedge (fuel + adjacent logistics). Biggest structural risk: the payout ratio is 158% and FCF ($115M TTM) is nowhere near distributions — if a downturn hits, distribution safety becomes questionable, and MLPs get punished violently when that happens. Also secular EV adoption is a slow-motion headwind for the fuel-distribution segment, though management is diversifying via midstream.
Sunoco's Q1 2026 revenue exploded to $10.69B (+106% Y/Y) with net income of $392M and EBITDA of $1.17B — a step-function change driven by the NuStar acquisition and Pipeline Systems/Terminals integration, visible in the balance sheet where total assets jumped from $14.4B in Q2 2025 to $30.3B in Q1 2026. TTM revenue of $30.7B, gross margin at 12.3%, operating margin 8.1%, and ROE of 15.4% are respectable for a fuel distributor/midstream hybrid. However, quality concerns are real: total debt of $15.4B against $718M cash gives a debt/equity of 1.85, the payout ratio is 158% (distributions funded partly by financing, typical for MLPs but still a flag), forward EPS is projected DOWN to $3.14 from a $3.92 trailing (implying integration/margin normalization), and free cash flow of just $115M TTM against $2.6B annualized distributions is a genuine coverage question. The PEG of 0.17 looks cheap only because trailing EPS growth was 256% (one-time acquisition effect); forward P/E of 21.7x is the more honest number. Capital allocation is aggressive — leveraging up for scale — which works in a stable-rate environment but not otherwise.
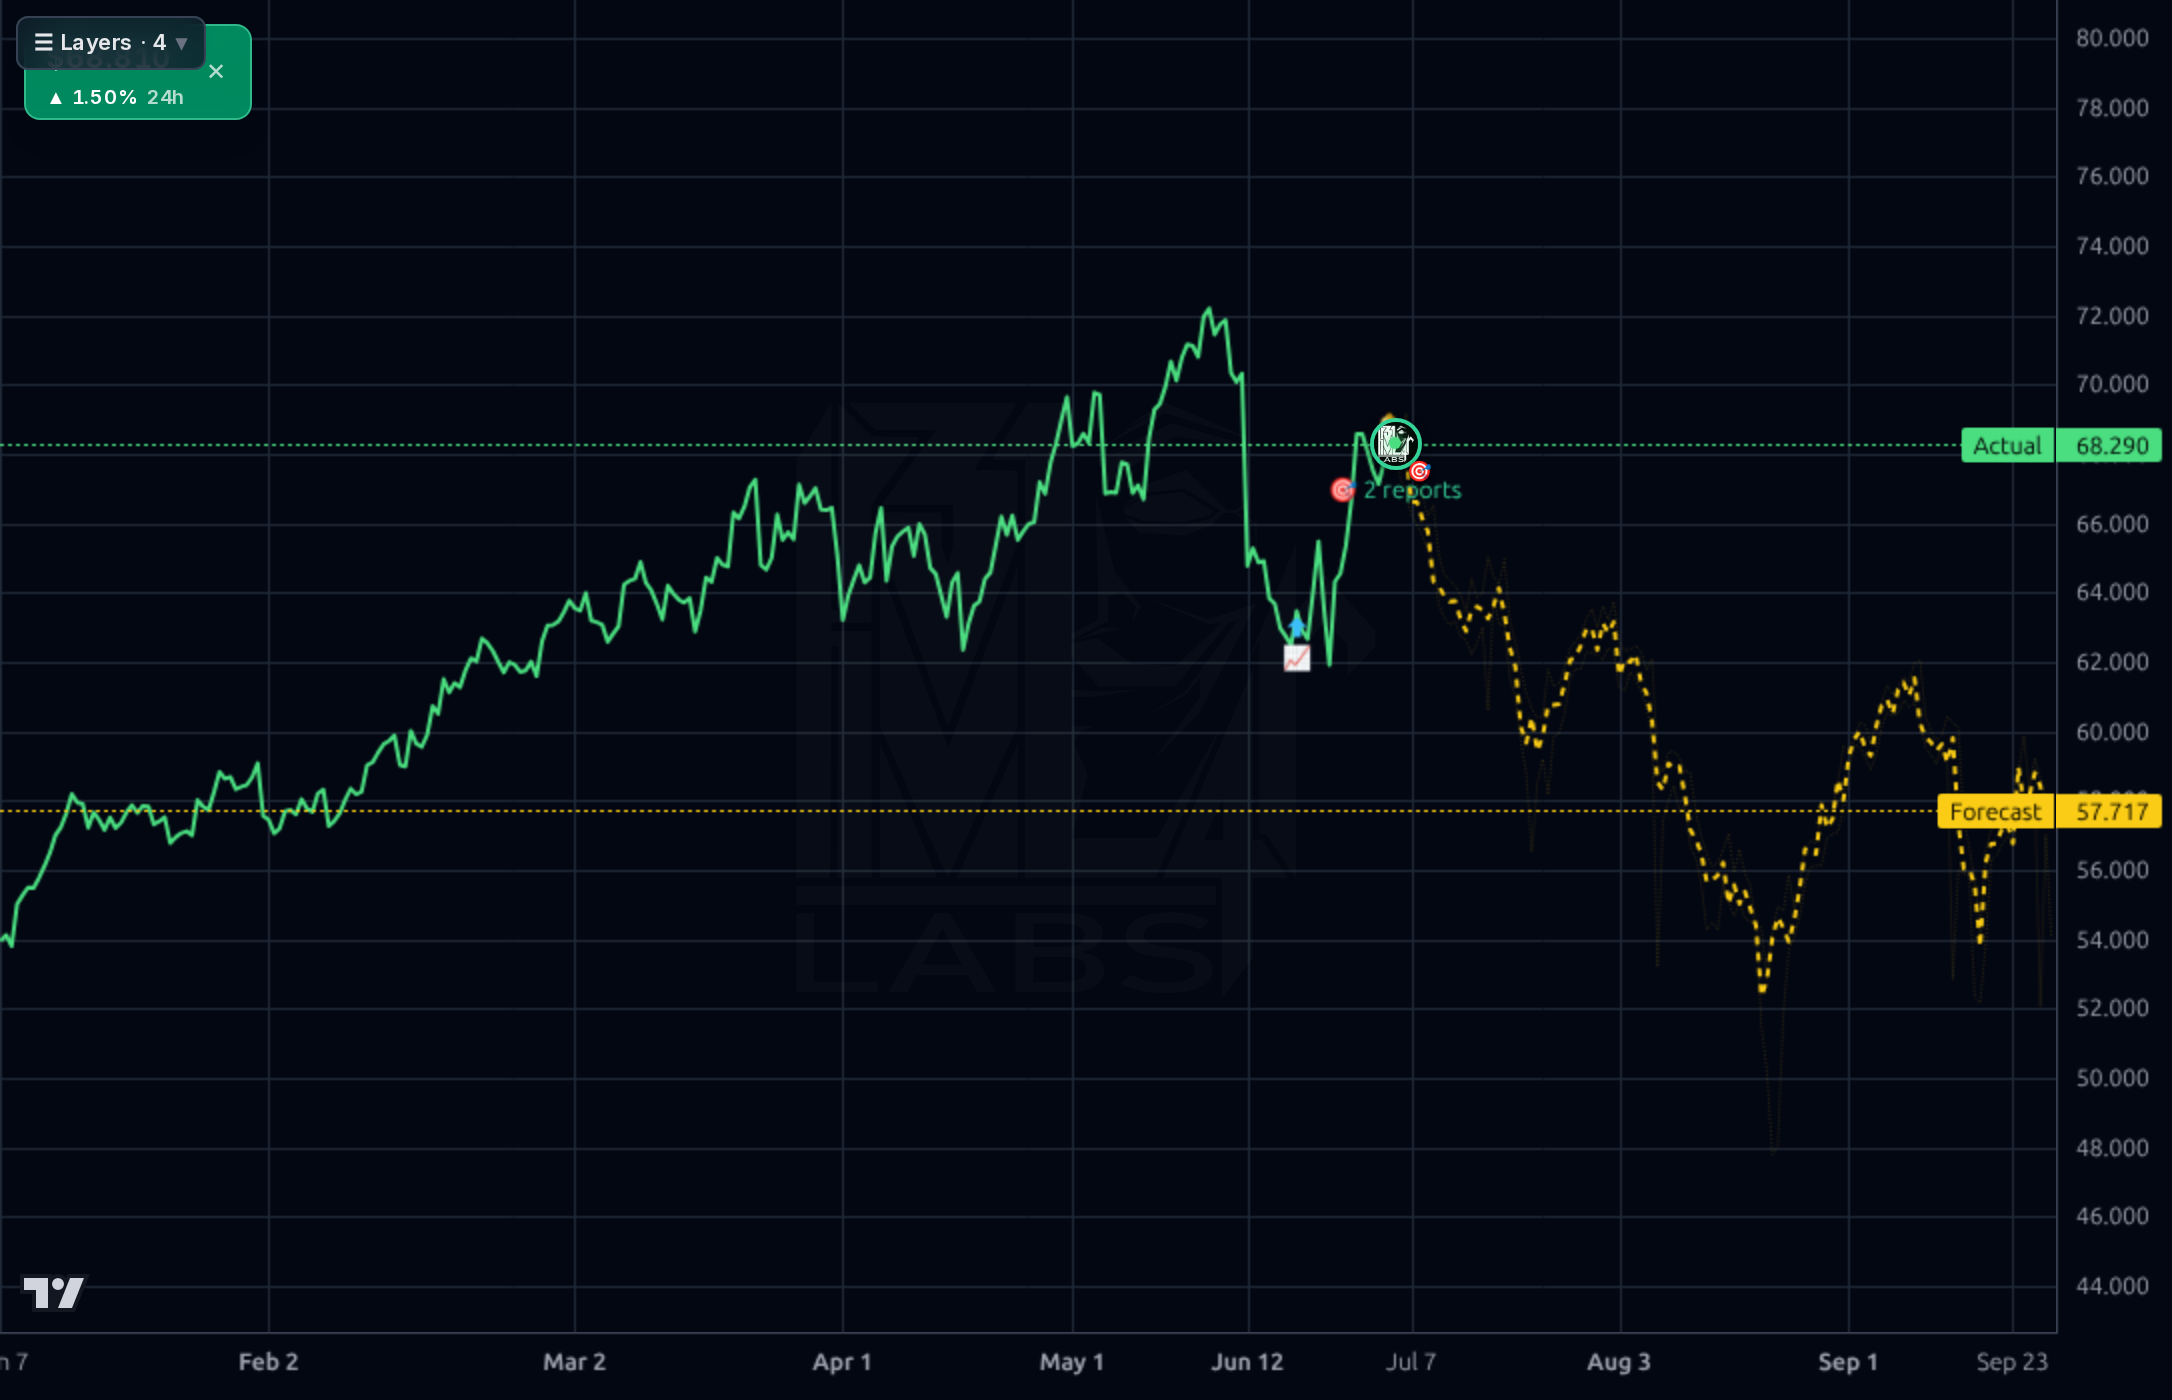
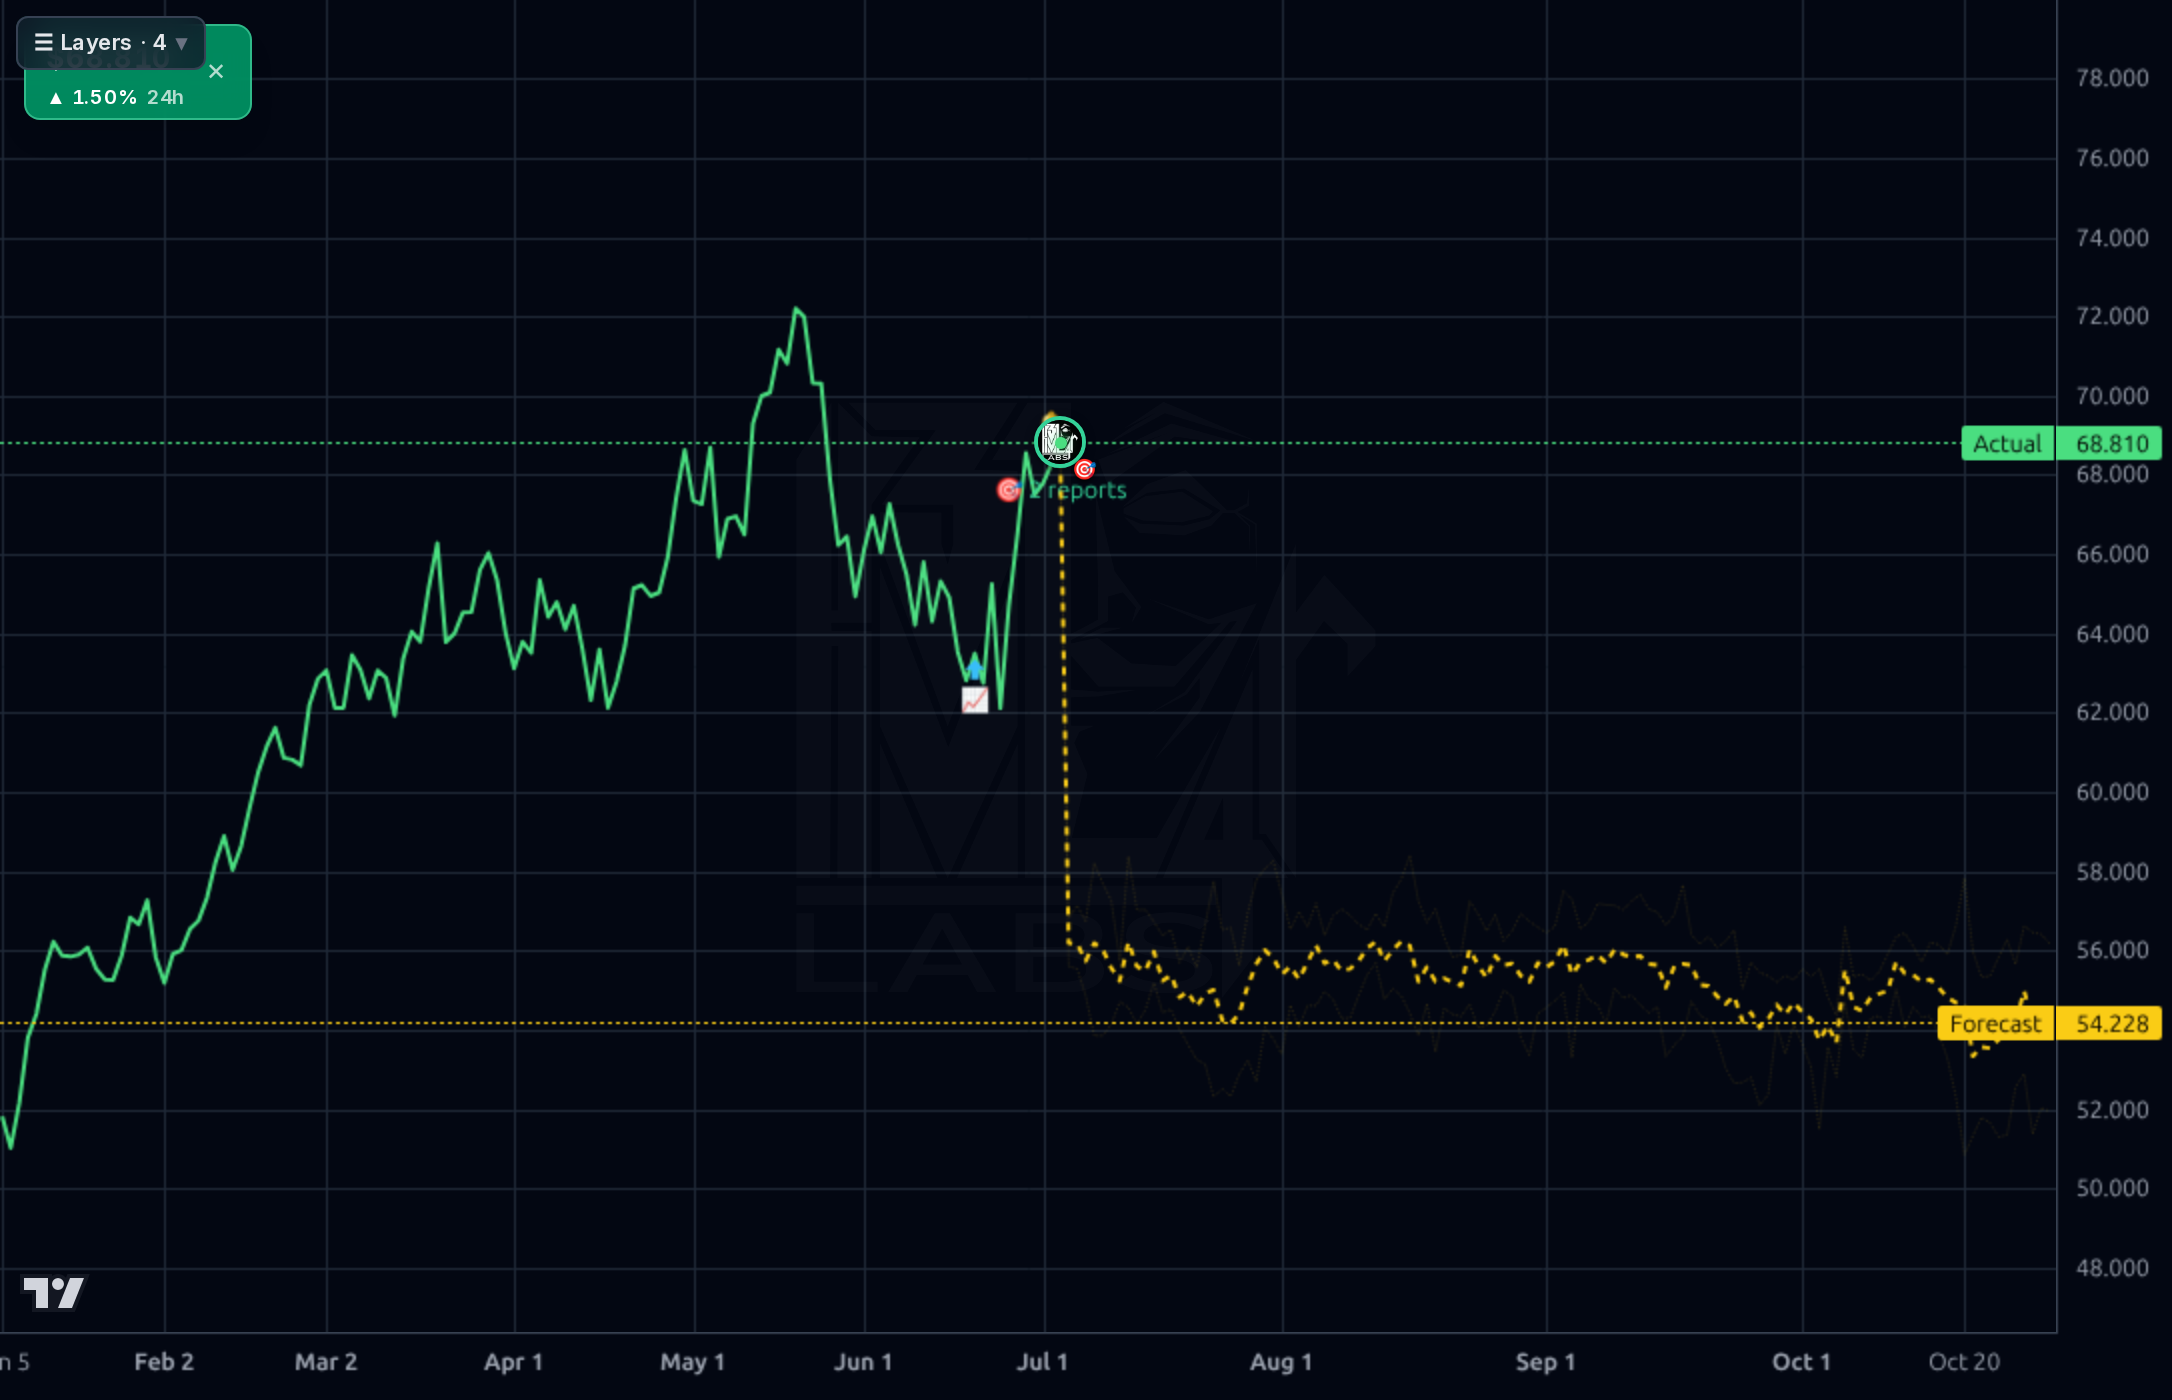
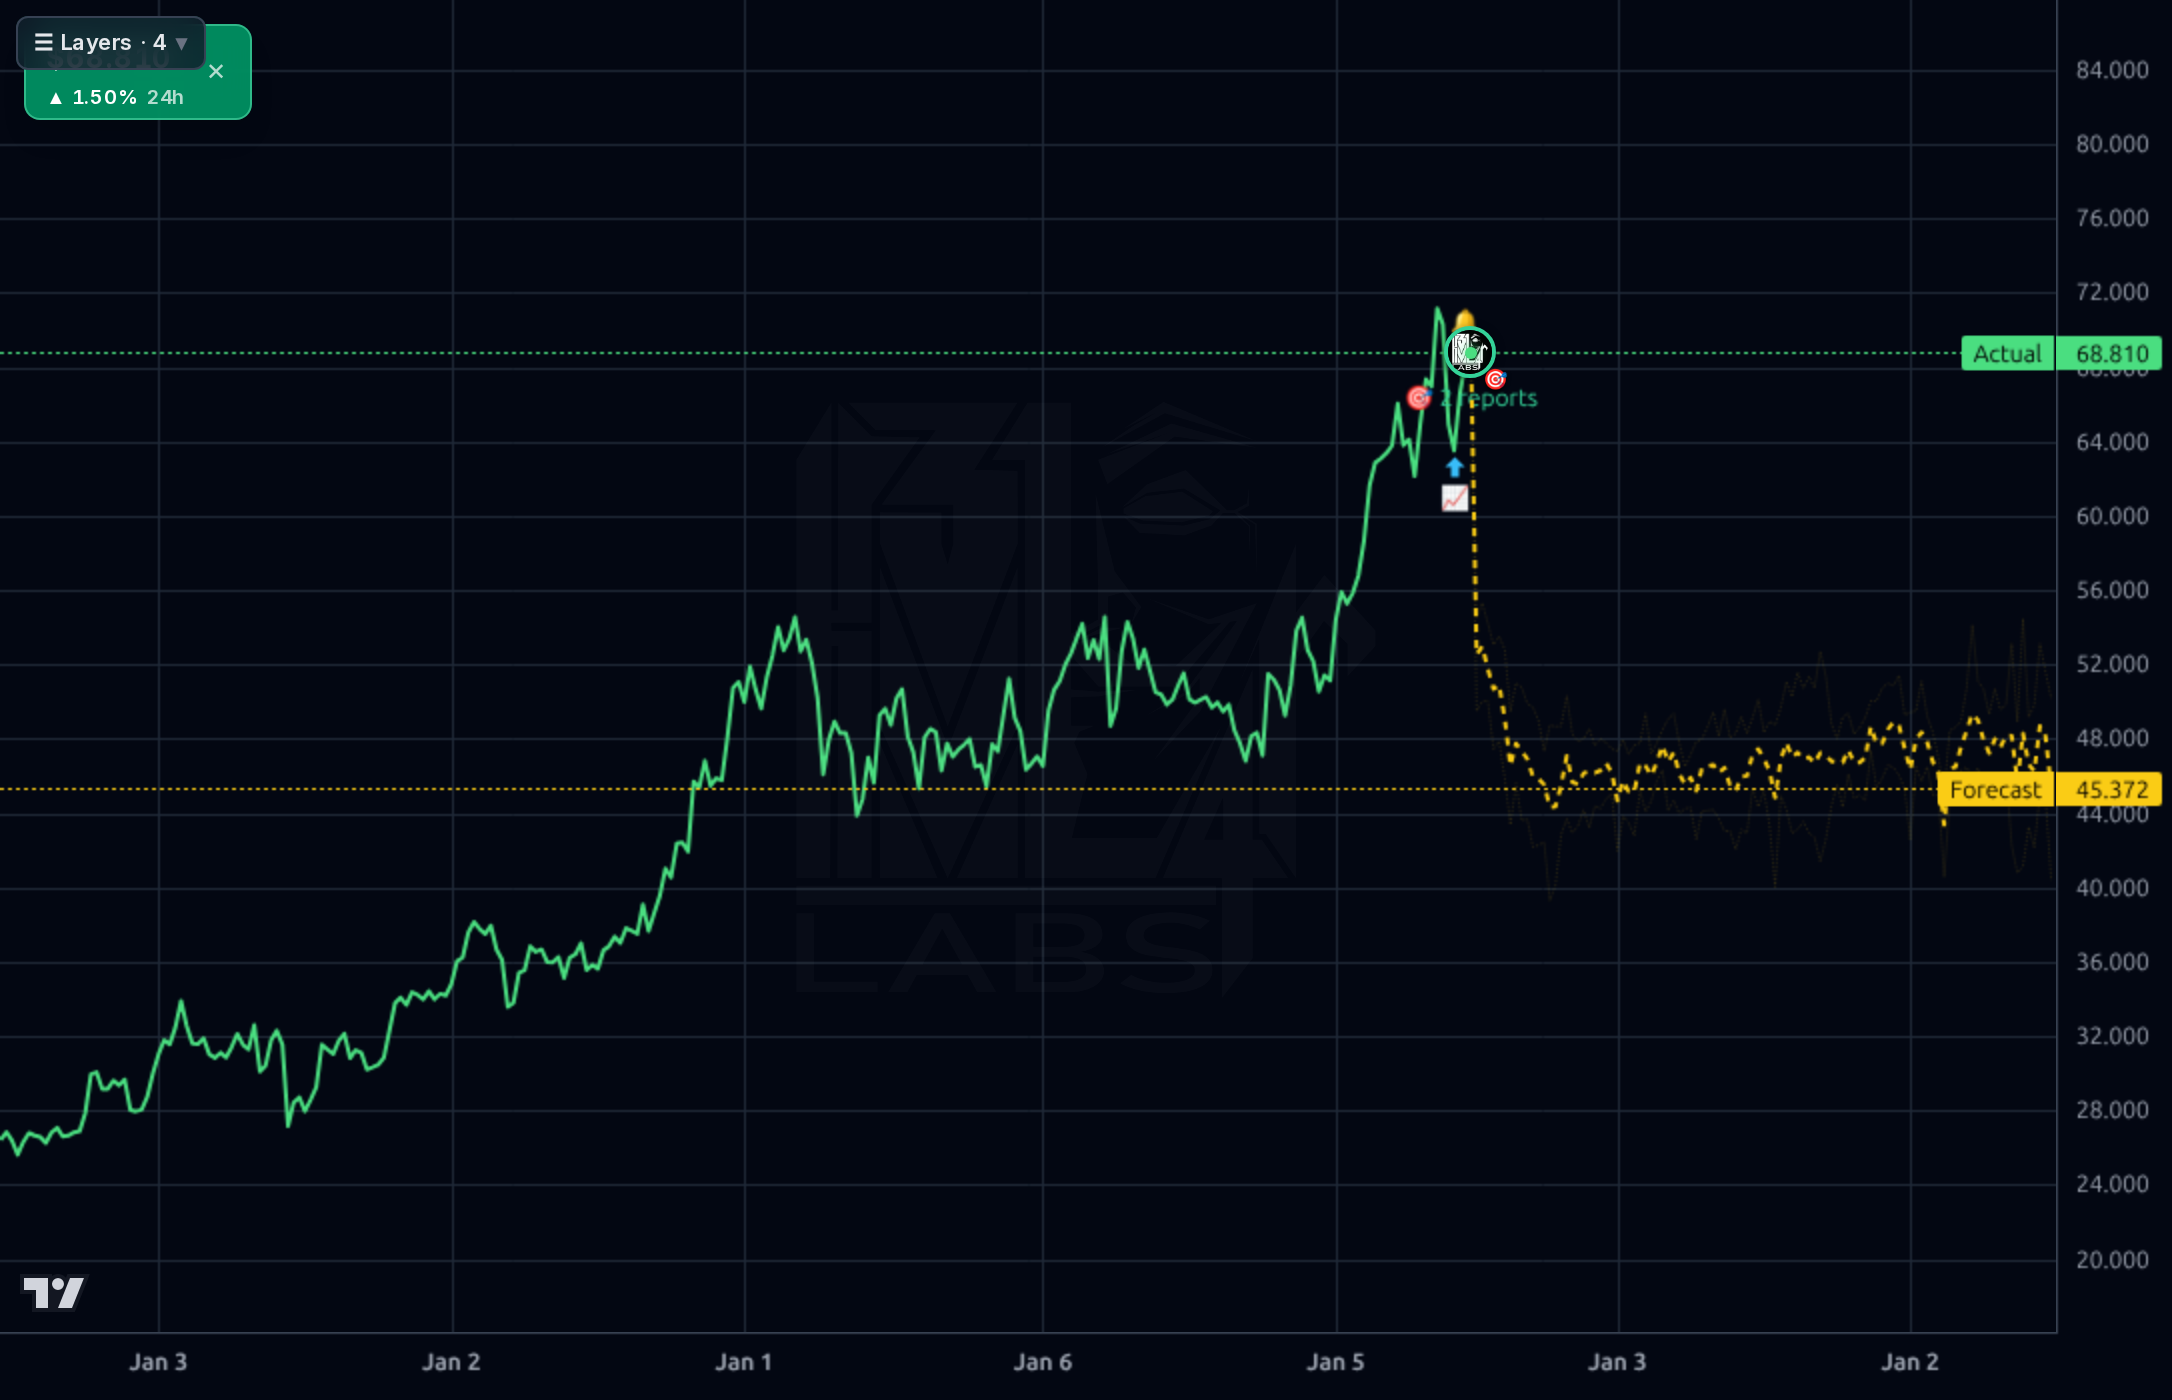
Across all four timeframes SUN is in a clear uptrend: on the 1wk chart price has moved from ~$28 to $68.81 over the visible window, on the 1d chart it broke out sharply from the $62 low in late June to test $68-69, and on the 4h chart it's consolidating just below the $69-72 resistance zone. Price sits +14.9% above the 200-SMA, +4.5% above the 20-SMA, RSI 56.6 (room to run but not oversold), and is only 6.3% below the 52-week high of $72.88. The Kronos AI forecast bands are notably bearish across all timeframes — 1d forecast $66.25 (mild pullback), 4h $57.72, 1wk $45.37 — but the accuracy stats are damning: 1d directional accuracy is 28% vs a 72% naive baseline, and 1wk is 0% vs 100% naive, meaning the model has been systematically wrong in this uptrend regime. I would heavily discount the yellow forecast lines. Key levels: support $65 (recent breakout), $62 (June low, blue arrow entry), $60 (psychological); resistance $69, then $72.88 (52-week high). Momentum favors the bulls into earnings.
The news flow is uniformly constructive: Simply Wall St highlights the Q1 beat, reaffirmed $3.10-3.30B full-year adjusted EBITDA guidance, >$500M in bolt-on acquisitions planned, and a commitment to ≥5% annual distribution growth. Barclays raised its price target to $75 (Overweight) on June 23, and ChartMill flagged a breakout setup with 135% EPS growth. The July 6 8-K filing that Sunoco redomiciled from Delaware to Texas is largely administrative — not a catalyst, but worth noting for governance/tax nerds. The retail social feed is essentially noise (TRON's SUN token spam, not Sunoco LP) and should be ignored entirely — this is a data-quality artifact, not sentiment signal. The cleanest signal is the combination of the analyst target ($75.86 avg, +11% upside), the Barclays upgrade, and the reaffirmed guidance — all pointing to institutional acceptance of the NuStar-transformed Sunoco. The counter-signal is that everyone knows this, the stock is up 30% YTD, and the August 4 earnings print is the next real test.
- Complete >$500M in bolt-on acquisitions in 2026 as reaffirmed by management (per July 2 Simply Wall St summary)
- Deliver full-year adjusted EBITDA of $3.10-3.30B guidance (implies ~24% growth vs 2025 EBITDA run-rate)
- ≥5% annual distribution growth commitment — currently $3.75 TTM, estimated $3.99 forward
- NuStar pipeline/terminal integration synergies flowing through — Q1 2026 revenue at $10.69B vs $5.39B in Q2 2025 shows scale-up in progress
- Barclays raised PT to $75 on June 23 citing midstream execution — analyst upgrades typically precede fund inflows
- Payout ratio of 158% and TTM FCF of only $115M vs ~$500M+ annual distributions — coverage gap is real and financed by debt/equity issuance
- Debt/equity of 1.85 and total debt of $15.4B leaves little cushion; MLPs are rate-sensitive and any hawkish Fed repricing hurts
- Forward EPS estimated at $3.14 vs $3.92 trailing — the Street expects earnings to DECLINE next year, implying current 21.7x forward P/E is not cheap
- August 4 earnings is a binary catalyst; the stock is up 30% YTD and priced for a beat + raise
- Kronos AI 1wk and 1d models are both bearish, but their directional accuracy has been beaten badly by naive baseline in this regime — a signal to discount the model, not to trust the bearish call, though the persistent bearishness deserves note
- Secular EV adoption is a slow but real headwind to Fuel Distribution segment volumes over 5-10 years
- MLP structure has tax complications (K-1) and limits some institutional buyers
Get AI analysis on any stock
This is one of hundreds of Kronos AI reports — scored fundamentals & technicals, bull/base/bear price targets, a multi-horizon plan, and continuously-updated forecasts across the market. Create a free account to explore them all.
Create your free account →Already a member? Sign in · Join our Discord