TCOM — AI Stock Forecast & Price Targets
Published 7/17/2026 · A free sample of K3vl4r’s AI-powered analysis.
Kronos price forecasts, scored fundamentals & technicals, and a multi-horizon plan.
View the live TCOM price forecast →
TCOM at $43.75 offers a deep-value setup — 6.9x TTM P/E, 48% net margins, 20% ROE, and $17/share in cash — with international bookings (+65-90% YoY) as the secular driver, but the tape remains broken (-44.6% from 52-week high, -25.96% below 200dMA) and the binary Aug 24 earnings print looms as the near-term catalyst. Analyst consensus target ($60.79) and Recom (1.47) remain constructive, but recent target cuts (BofA to $64, Citi to $64, Barclays to $60) confirm the guidance-driven de-rating is real. Best played as a staged accumulation, not a swing into the print.
1-4 weeks: do NOT size aggressively into the Aug 24 earnings print (~38 days out) — treat this as a pre-earnings staged accumulation only. Initial tranche appropriate in the $42-44 zone (current), with a second tranche only on a reclaim of $46 with volume OR a retest of $40 support that holds. Invalidation: sustained break below $38 (52-week low) on high volume — that would signal a fresh leg down and warrant exit. IV is elevated so short-dated options are expensive; equity or defined-risk put spreads to hedge the print are preferable. Sizing: 1/3 to 1/2 of intended full position pre-print; keep dry powder for post-print gap.
1-6 months: the thesis pivots entirely on the Aug 24 print. A confirmed guidance stabilization + capital return signal (buyback) unlocks a re-rating toward $50-55 (a still-modest 8-9x forward P/E). A guide-down would push toward $35-38 retest. Expected return range: -15% to +25% over 6 months, skewed positive given the extreme valuation compression. Catalysts: Aug 24 earnings, any capital return announcement, China domestic travel data. What changes my mind: a materially worse Q2 guide, evidence of ADR delisting acceleration, or international bookings deceleration below +40% Y/Y.
1-3 years: TCOM remains a dominant Asian OTA franchise with genuine international optionality via Trip.com brand, Skyscanner, and Trip.Biz. At 6.9x TTM P/E with $17/share in cash and 20% ROE, the setup is a classic quality-at-a-discount if the China regulatory overhang normalizes. Terminal thesis: normalized earnings power of $5-6/share × 12-14x multiple = $60-80 fair value range over 2-3 years, plus meaningful cash generation. Biggest structural risks: (1) ADR delisting/audit access disputes, (2) persistent Chinese consumer weakness capping domestic segment growth, (3) competitive pressure from Meituan/domestic super-apps eroding take rates.
The fundamental profile remains best-in-class within Asian consumer cyclicals. Q1 2026 revenue of ¥16.2B (+23% Y/Y per snapshot Sales Q/Q) with gross margins of 79.5%, operating margins of 24.3%, and net margins of 15.4% (48.4% TTM, boosted by a Q3 2025 one-time gain producing ¥19.9B net income). ROE of 20.05% and ROIC of 17.28% are elite. Balance sheet is a fortress: ¥81B cash vs. ¥31.4B debt, net cash of ~¥50B (~$17/share), Debt/Eq of 0.19, current ratio 1.53. Enterprise Value at $23.2B on a $30.2B market cap implies EV/EBITDA of 9.7x — undemanding for this quality. What's working: international platform bookings growth, Trip.Biz/Skyscanner diversification, capital-light model throwing off cash. What's broken: forward EPS estimate ($4.28 vs. TTM $6.65) implies analysts expect earnings to compress materially — the guide-down concern is embedded in the -46.7% EPS this Y and -11.48% EPS next 5Y estimates. Sales Y/Y TTM of 19.28% is decelerating but still healthy.
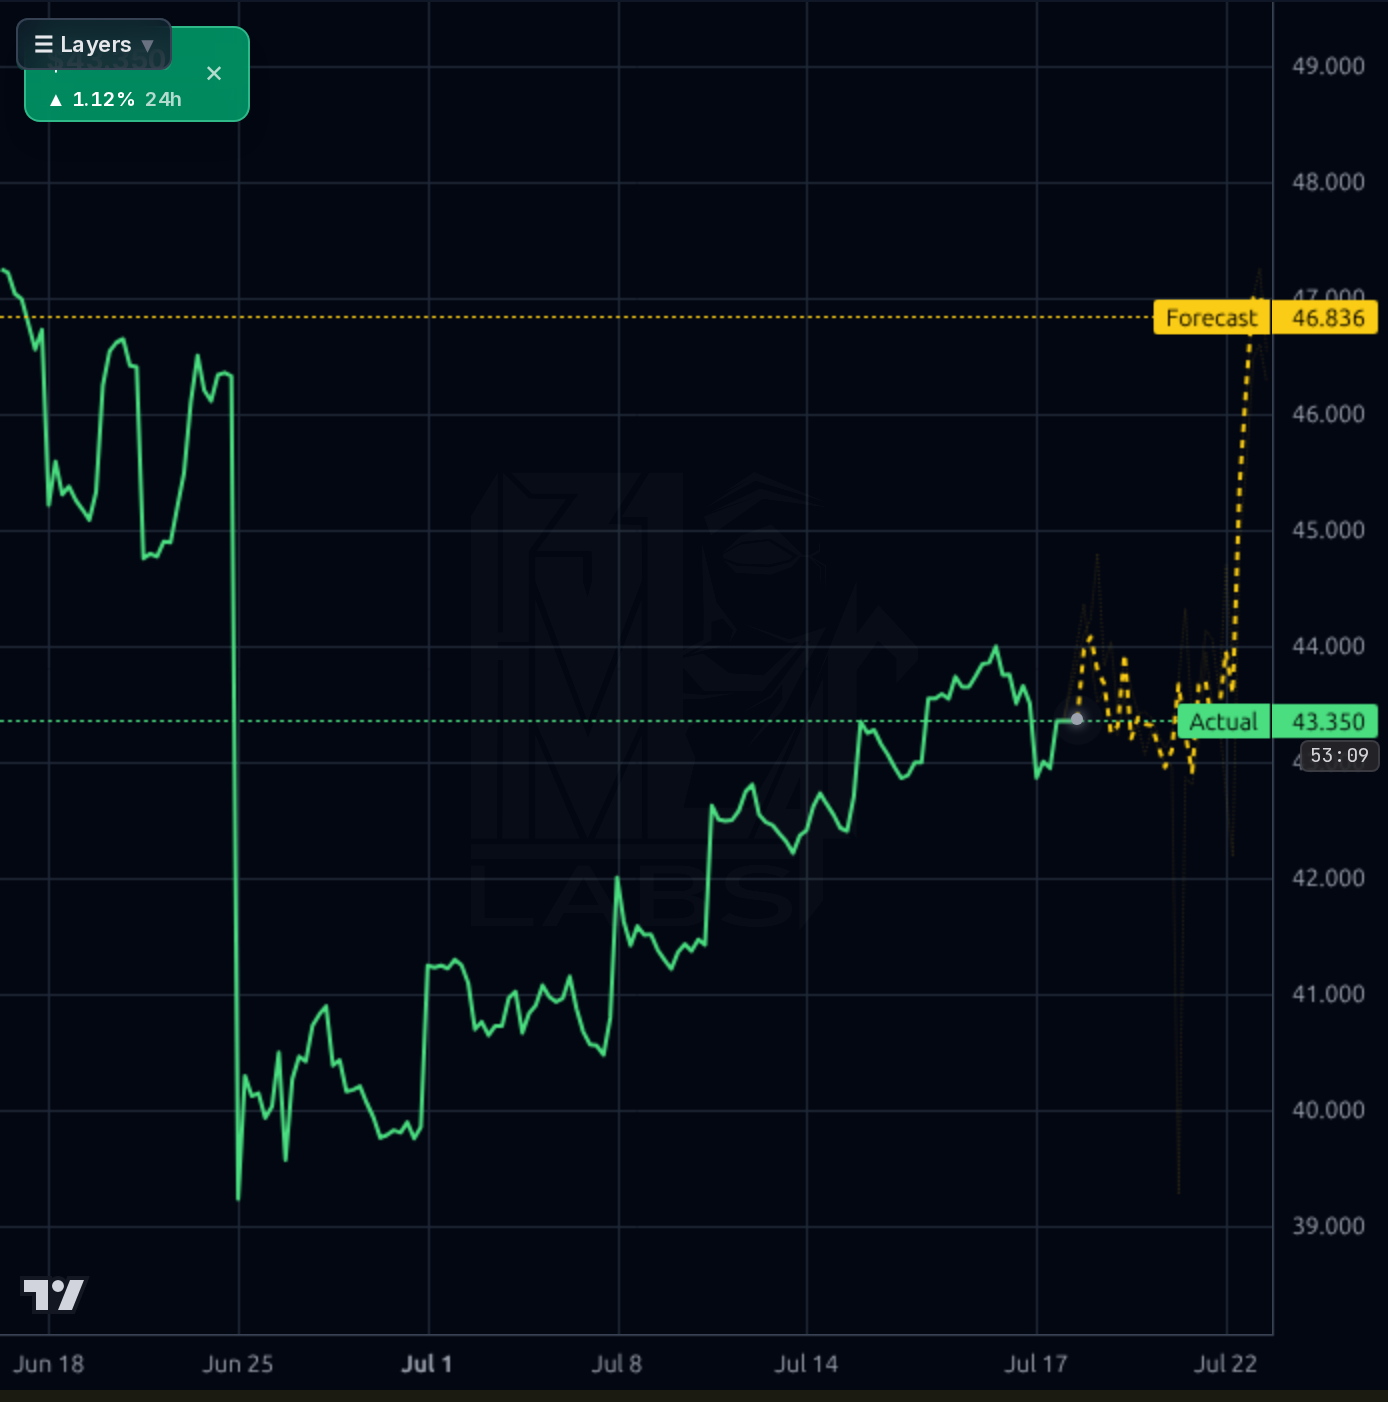
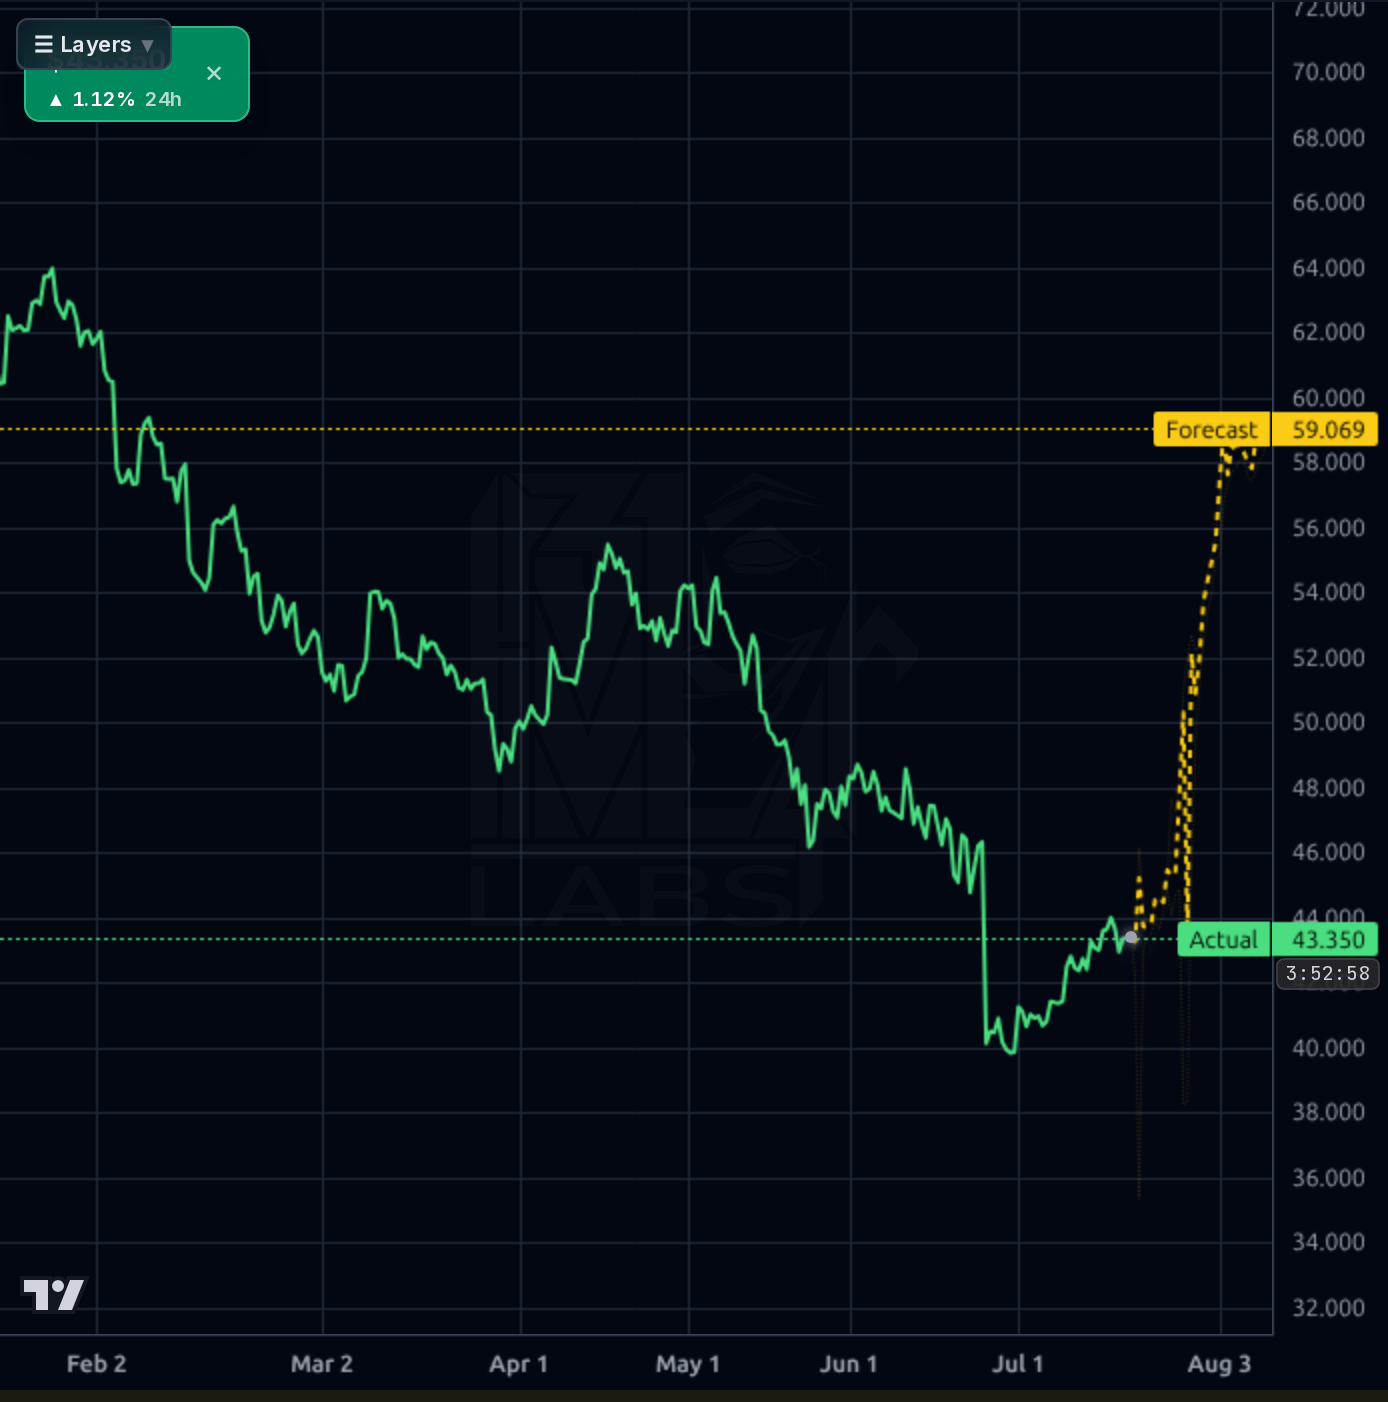
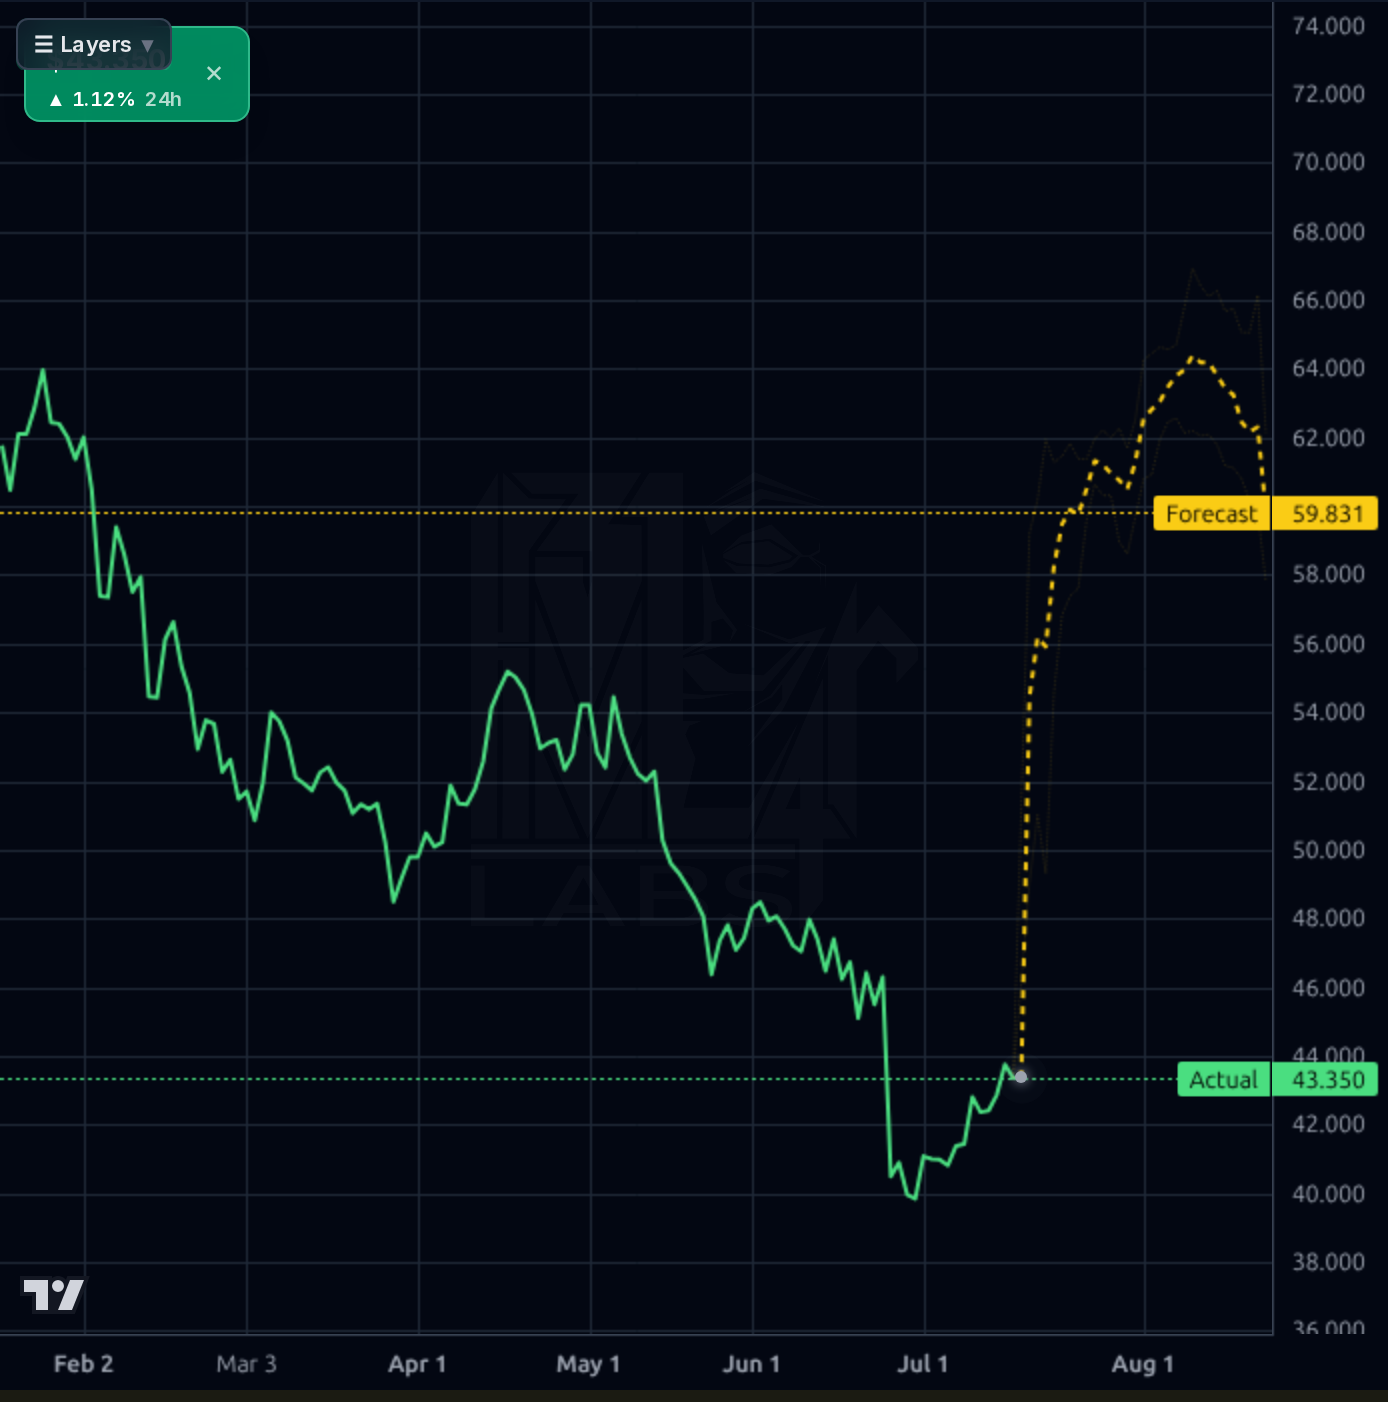
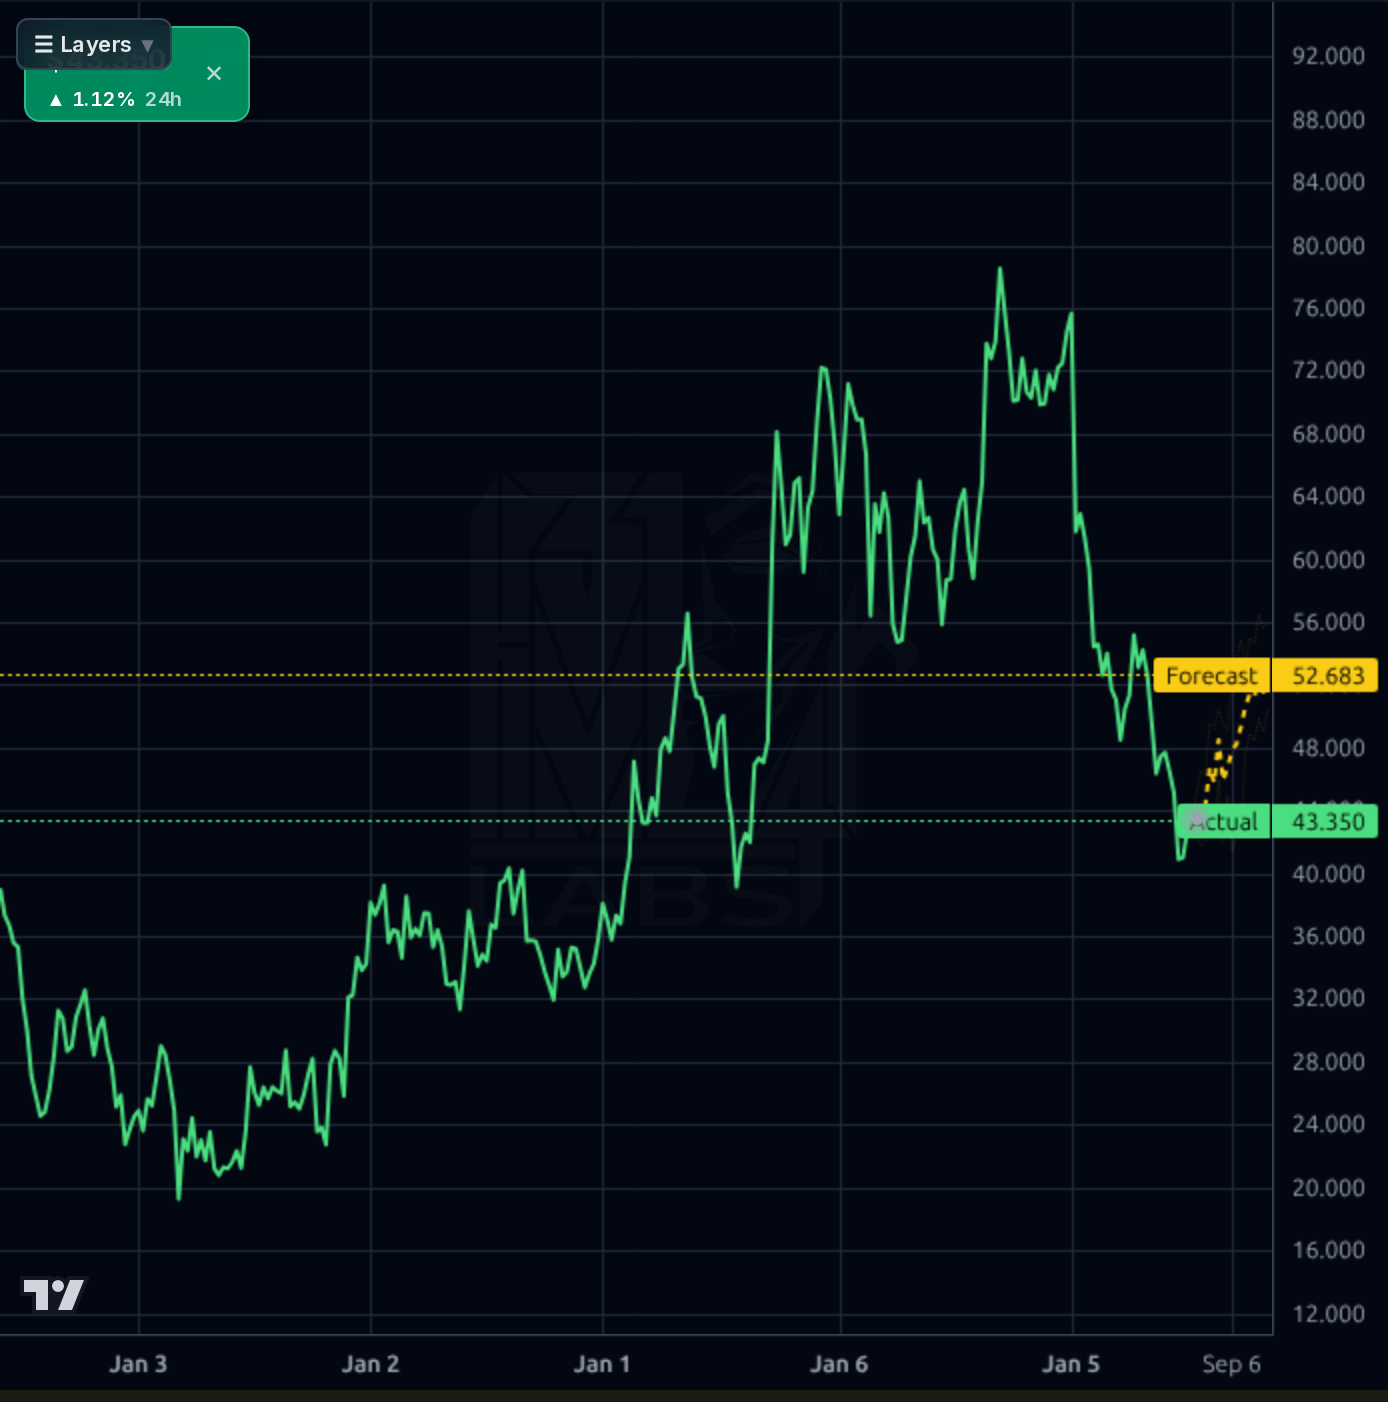
The chart is broken across timeframes. 1wk view shows TCOM has round-tripped from $19 lows to $79 highs and now sits at $43.75, having sliced through prior support in the mid-$50s. The 1d chart shows the June flash-crash to ~$38 followed by a grinding recovery, now testing the $43-44 zone; SMA50 is -5.81% above (resistance) and SMA200 is -25.96% above (major overhead supply). RSI at 50 is neutral — no momentum in either direction. The 1h/4h charts show constructive short-term stabilization with the forecast band projecting toward $46.8-59 over the coming sessions, but the model's realized directional accuracy (49% at 1d, 33% at 1wk vs. 53%/100% naive baselines) means these projections should be heavily discounted. Key levels: $38 is the line-in-the-sand support (June low); $46 is the first meaningful pivot to reclaim; $50-52 is the SMA50/gap-fill zone; a decisive break above would require volume. Perf Week +5.6% but Perf Month -7.7% and Perf Half-Y -42.19% — the primary trend remains down.
The news flow is dominated by a coordinated analyst reset: China Renaissance downgraded to Hold with a $42 PT (essentially at current price), BofA cut to $64 (from $78), Citi cut to $64 (from $82), and Barclays cut to $60 (from $75) — all citing disappointing Q2 guidance rather than a Q1 miss. The consensus reset acknowledges near-term China travel softness while most maintain Buy/Overweight ratings, indicating the Street sees this as a valuation reset, not a thesis break. Implied volatility is surging on TCOM options, consistent with positioning into the Aug 24 print. The L1 bearish fundamental signal (average price target -14.9% to $66) confirms the de-rating. Signal: guidance is the swing factor for the print. Noise: retail social sentiment is bullish but heavily promotional (WhatsApp groups, generic 'stocks to watch') — discount entirely.
- International platform bookings compounding at +65-90% Y/Y — the primary secular driver and margin expander given global travel's higher take rates
- Trip.Biz corporate travel management platform building recurring, higher-margin B2B revenue stream
- Skyscanner meta-search integration providing global user acquisition funnel outside China
- $81B cash pile enables potential buyback authorization or dividend expansion — capital return would be a direct re-rating catalyst
- Forward P/E of 10.4x vs. TTM 6.9x suggests analysts expect earnings normalization, but consensus Recom of 1.47 (near strong-buy) implies re-rating upside if execution holds
- Aug 24 earnings guidance miss could trigger a gap toward $38 support given IV surge and recent analyst target cuts
- China regulatory overhang and potential US-China ADR delisting risk remain unquantifiable multiple suppressors
- SMA200 at -25.96% overhead — significant technical supply between current price and any meaningful upside target
- Forward EPS estimate of $4.28 vs. TTM $6.65 signals meaningful earnings compression already priced by sell-side
- Recent coordinated PT cuts (BofA, Citi, Barclays, China Renaissance) confirm Street is downgrading forward expectations
- Model directional accuracy (49% at 1d, 33% at 1wk) is worse than naive baseline — forecast band should not drive sizing
- Chinese consumer discretionary demand softness could persist longer than currently priced
Get AI analysis on any stock
This is one of hundreds of Kronos AI reports — scored fundamentals & technicals, bull/base/bear price targets, a multi-horizon plan, and continuously-updated forecasts across the market. Create a free account to explore them all.
Create your free account →Already a member? Sign in · Join our Discord