TCOM — AI Stock Forecast & Price Targets
Published 8/6/2026 · A free sample of K3vl4r’s AI-powered analysis.
Kronos price forecasts, scored fundamentals & technicals, and a multi-horizon plan.
View the live TCOM price forecast →
TCOM is a best-in-class OTA at 7.2x TTM P/E with 48% net margins and $18/share in cash, but sits 18 days from a binary earnings print with technical overhead at $50-$56 unresolved. The July 27 antitrust settlement ($780M) cleared the major regulatory overhang without disrupting the business, and international bookings compounding +65-90% YoY offer structural upside — but forward EPS of $4.21 vs. TTM $6.70 signals a normalization step-down that the market must digest.
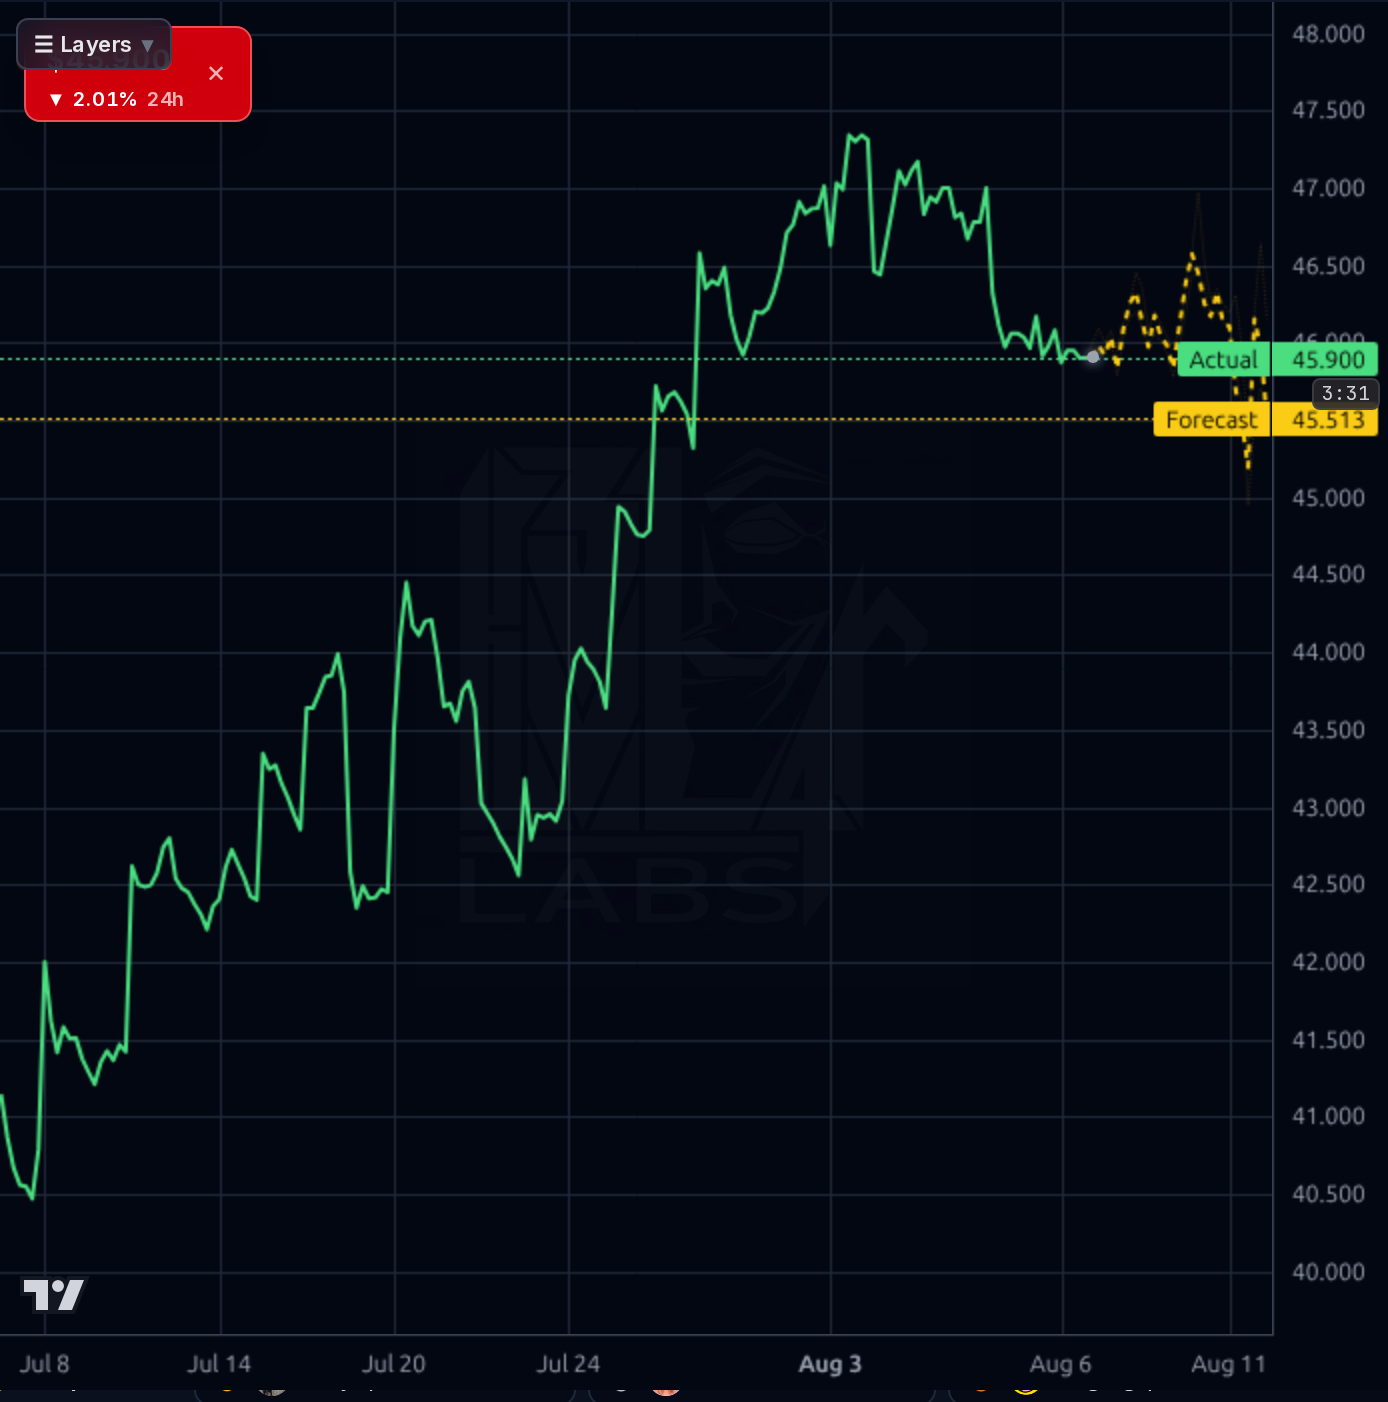
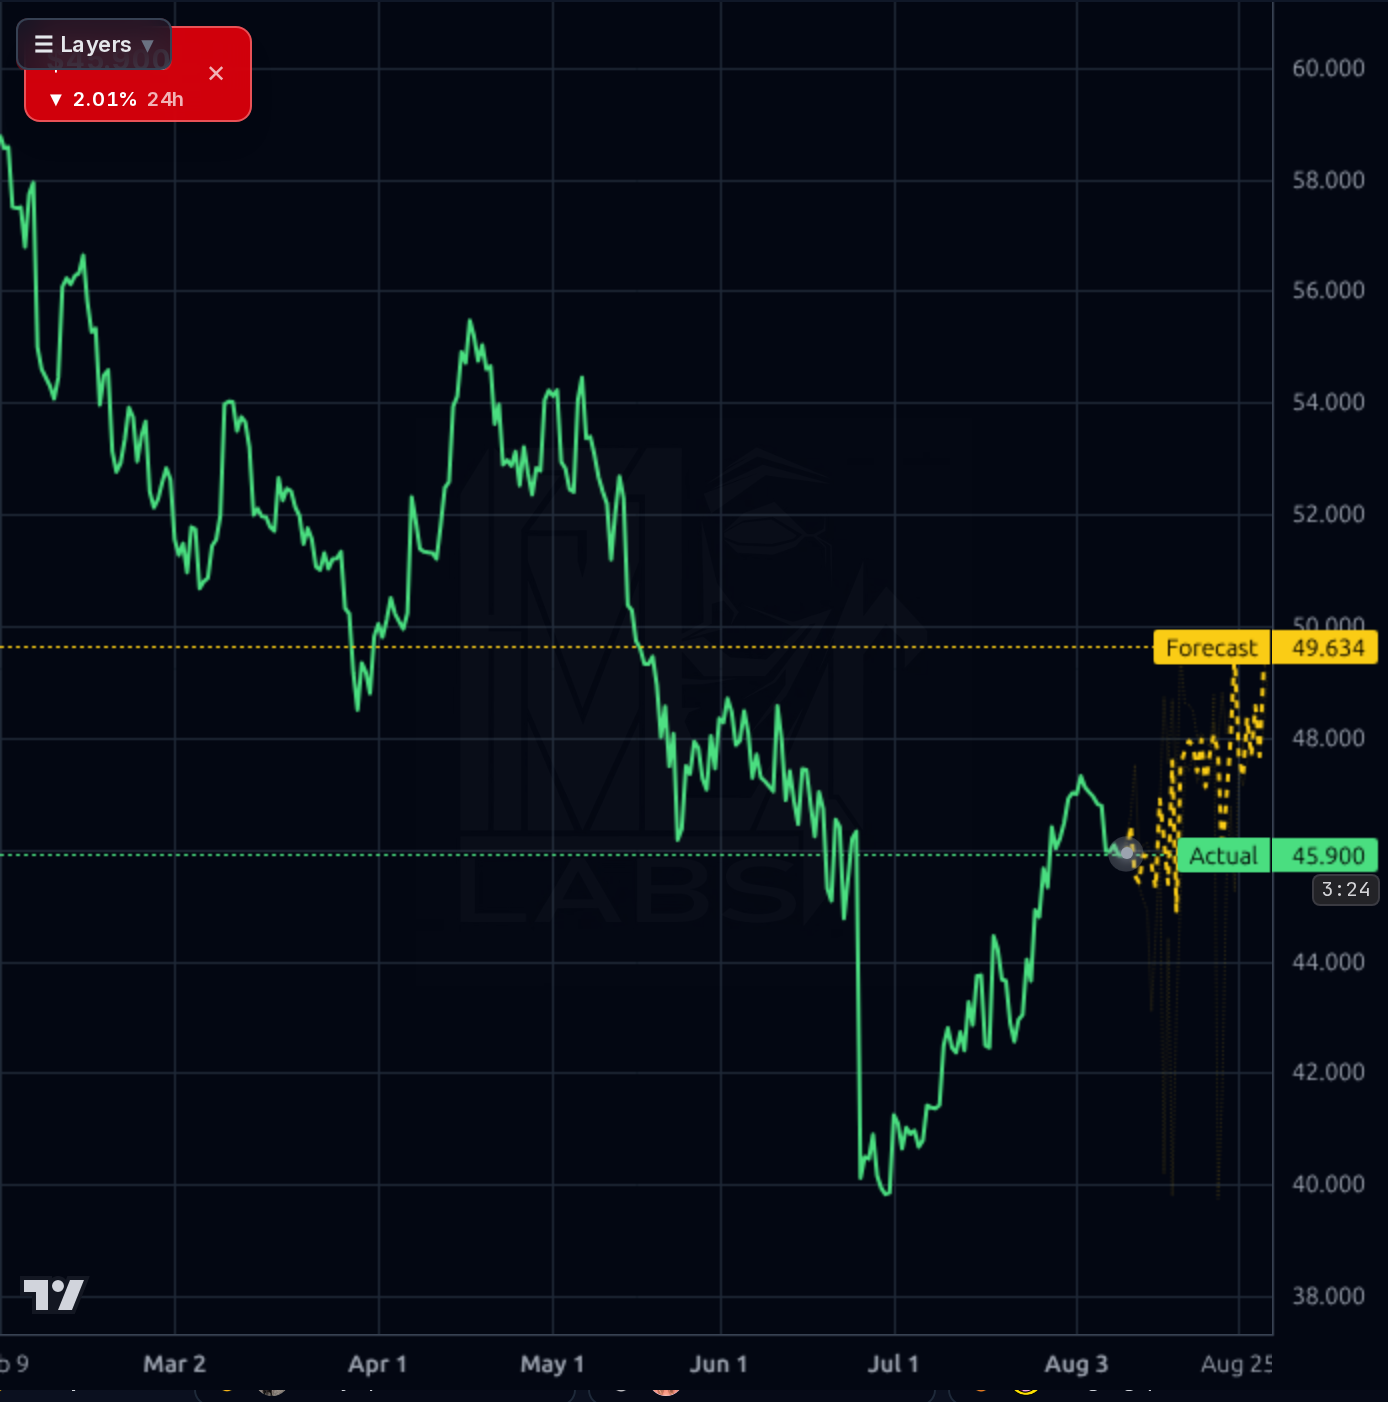
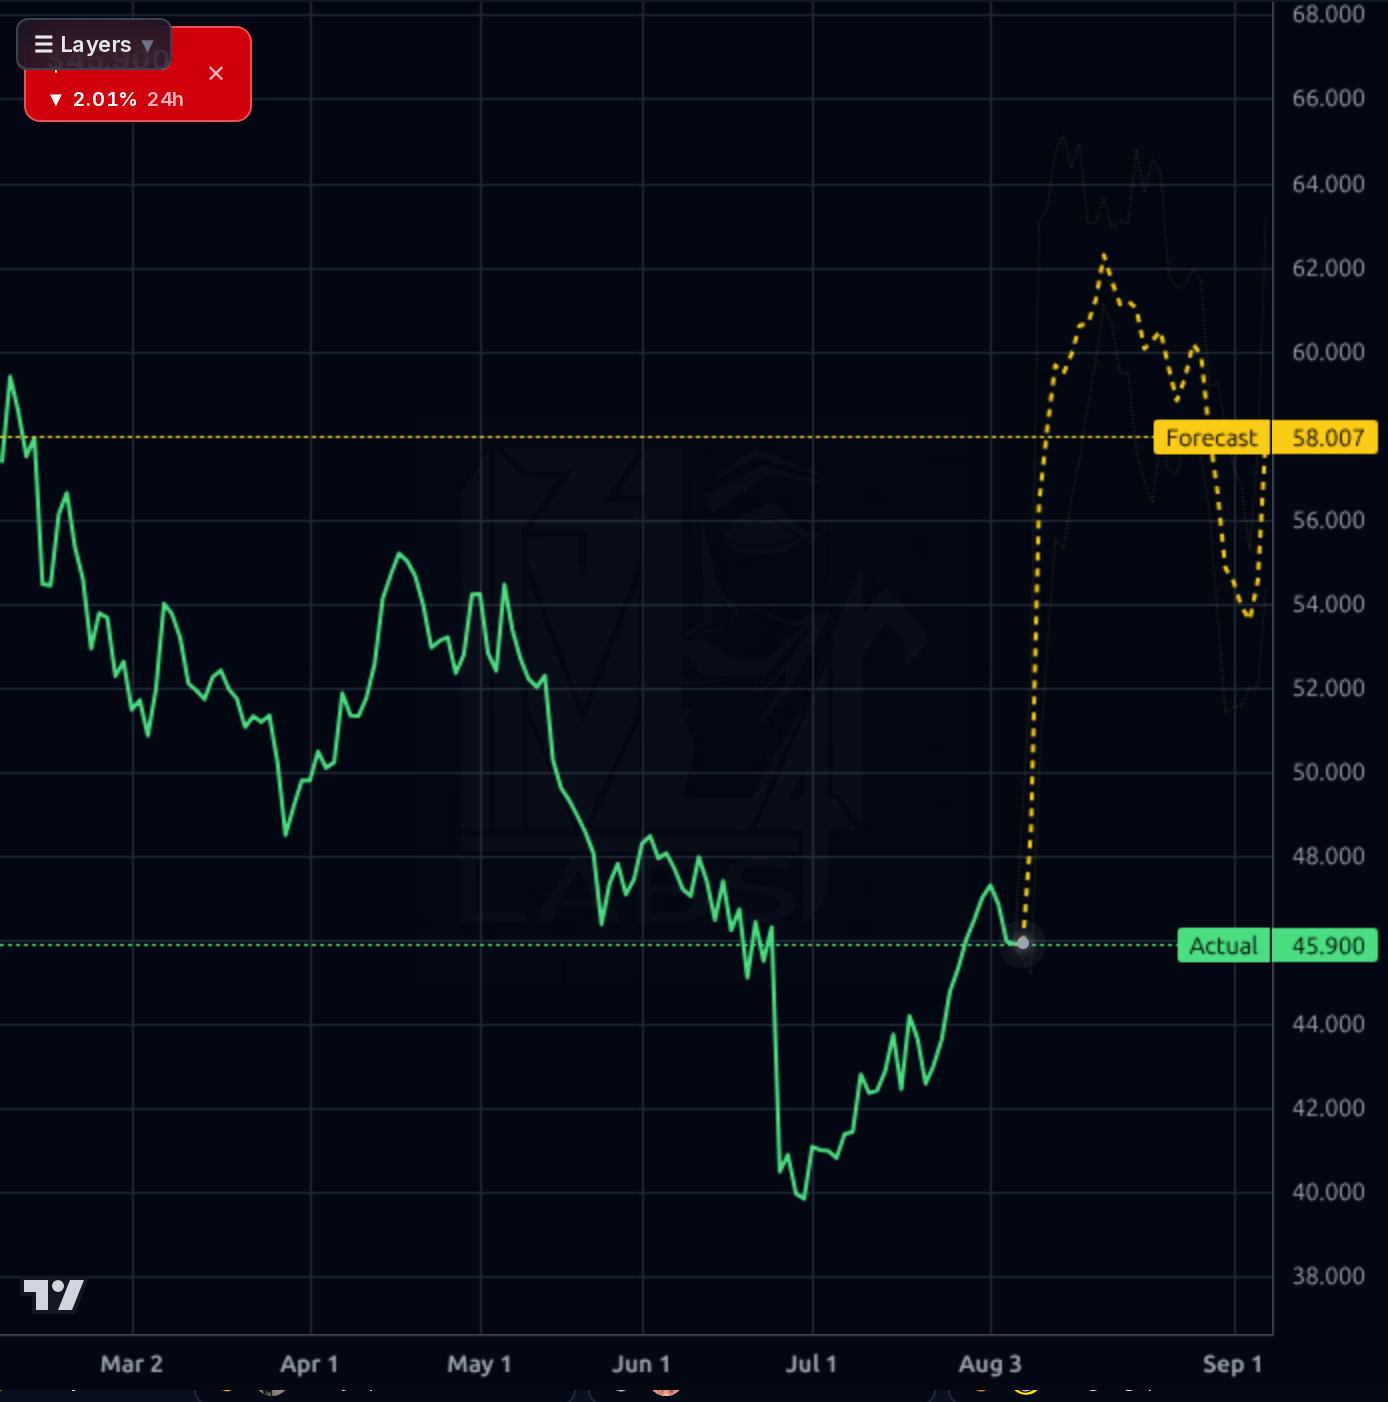
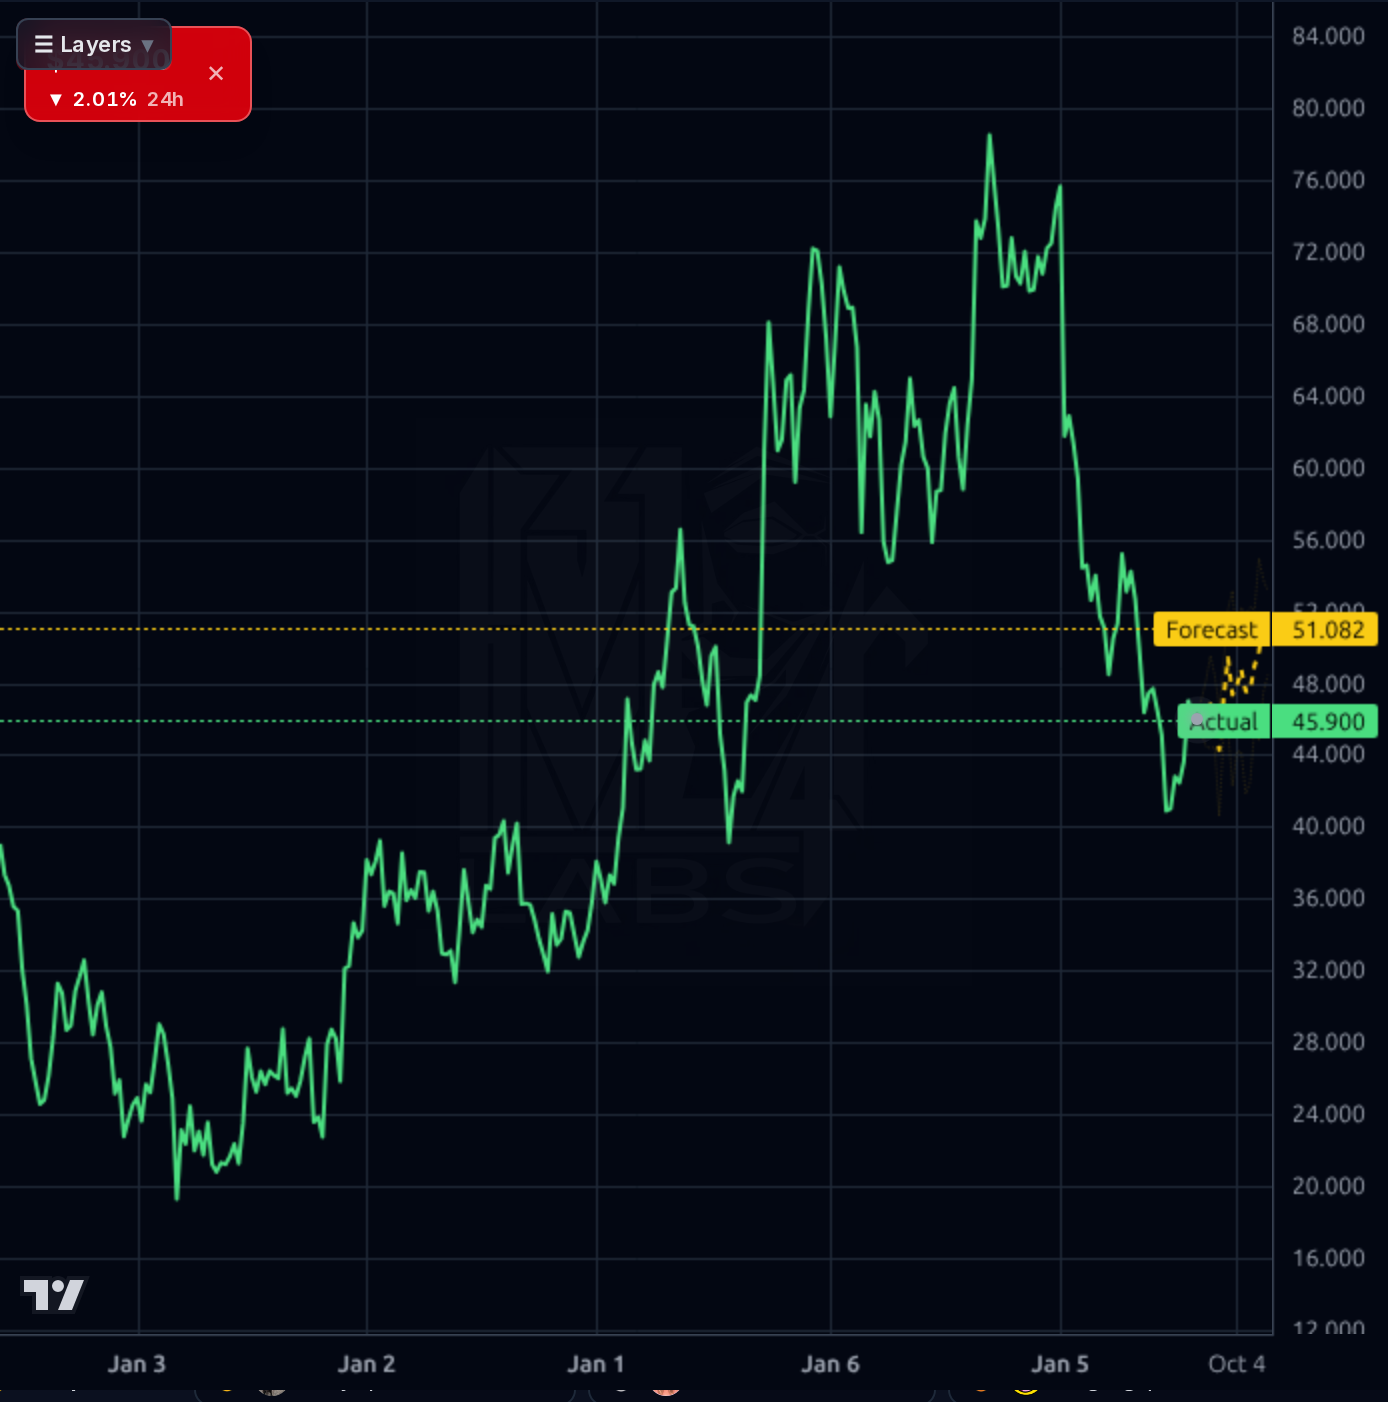
HOLD into the Aug 24 print — do NOT initiate or add a swing position 18 days from a binary event with IV crush risk. If already long from the $42-$44 base, hold; use a $43 stop as invalidation. For new capital, wait for either (a) a decisive close above $50 on volume post-earnings, or (b) a washout retest of $42-$43 with buying reaction. The 1h forecast range ($45-$46.50) suggests continued consolidation, so no urgency. Explicit earnings stance: NEUTRAL into the print — quality/valuation supports holding, but forward EPS normalization ($4.21 vs. $6.70 trailing) creates real guidance risk.
1-6 month view is ACCUMULATE on constructive earnings resolution. Base case: earnings clear without a major guidance cut, international bookings guidance holds +50%+ YoY, and price grinds toward $52-$53 (the persistent base target zone; +13-15% from spot). Bull case requires either a formal buyback authorization or clear PT raises from JPM/Citi — that unlocks $58-$60. Bear case is a guidance miss on domestic take rates (Meituan competition) or a weak international deceleration → retest of $40-$42. Would change my mind: sustained close below $42 or a >20% cut in forward EPS consensus.
1-3 year terminal thesis remains intact: TCOM is a structurally advantaged global OTA with the highest margins in the industry, a fortress balance sheet, and a genuine international growth engine (Trip.com brand +65-90% YoY bookings) that diversifies away from China-cycle risk. Multi-year fair value at 12-14x normalized forward EPS of ~$5-$5.50 supports $60-$75. Biggest structural risk is not fundamental but geopolitical — US-listed Chinese ADR delisting/audit risk and any escalation in cross-border tech restrictions — which caps the multiple that Western investors will pay regardless of execution.
Best-in-class quality metrics for the OTA space: 80.3% gross margin, 24.3% operating margin, 48.6% net margin, and 20.1% ROE on a $29.85B market cap. Q1 2026 revenue of ¥16.2B with ¥3.95B operating income shows margin durability; sales Y/Y TTM +19.3% and EPS Y/Y TTM +87% reflect the post-COVID travel normalization. Balance sheet is fortress-grade: ¥81B total cash ($18/share) vs. ¥31B debt, current ratio 1.53, LT Debt/Eq 0.07. The critical caveat is EPS normalization — trailing $6.70 vs. forward $4.21 implies ~37% haircut as one-time gains roll off, making the 10.9x forward P/E (still cheap) the more honest anchor than 6.9x TTM. Capital allocation remains the missing lever: massive cash pile with no dividend growth and no announced buyback authorization is the single most direct re-rate catalyst still on the table. Q1 EPS Q/Q of -36.8% and the L1 bearish PT cut from $77.59 to $66.05 on 6/26 flag sell-side caution into the print.
Mixed multi-timeframe picture. The 1d chart shows price parked at $45.96, +12.6% on the month but -19.6% below SMA200 and -41.8% off the 52-week high of $78.99 — a rally from the $40 base but still deep in a longer downtrend. The 1h/4h charts show consolidation just under $46 with the short-term model forecasting a chop range of $45-$46.50 (1h) and a strong upward drift to $49.63 (4h) — but the 1wk directional accuracy (67% vs 83% naive baseline) means the multi-day model is UNRELIABLE in this regime and should be discounted. RSI 56.3 is neutral-constructive; SMA20 +3.9% and SMA50 +2.5% confirm short-term momentum. Overhead supply at $50-$56 is the well-defined ceiling; support tiers are $44 (recent breakout retest), $42 (base), then $40 (July lows). Bullish probability of 1.00 on the model looks overly confident given the earnings binary in 18 days.
The dominant signal is the July 27 antitrust settlement — regulators imposed a $780M fine on Trip.com but left the wider business intact, which structurally removes the biggest overhang while imposing a manageable one-time cost. Sell-side reaction is nuanced: JPM cut PT to $72 (from $75, Overweight maintained) and Citi to $62 (from $64, Buy maintained) on 7/28-7/30, and a SeekingAlpha piece flagged EPS downside risk and OTA competition. The Zacks 8/5 coverage notes TCOM lagged the broader tape at -1.88%. Expedia's Q2 beat (8/5) is a mild read-through positive for global OTA demand. Net signal: overhang cleared, but analysts are trimming near-term EPS estimates ahead of the Aug 24 print — consistent with the forward-P/E jump from 7 to 11x and the flag on estimate revisions.
- International platform (Trip.com/Skyscanner) bookings compounding +65-90% YoY — durable multi-year revenue diversifier away from China cycle
- Post-antitrust settlement removes regulatory overhang, opening path for multiple expansion once earnings clarity emerges Aug 24
- $18/share cash pile ($11.3B) enables a large buyback authorization — the single most direct catalyst for a re-rate
- Corporate travel platform (Trip.Biz) expanding as global business travel normalizes, providing higher-margin segment mix
- Q1 2026 revenue growth of 23% Y/Y demonstrates travel demand resilience despite China consumer softness
- Aug 24 earnings binary — forward EPS $4.21 vs. TTM $6.70 signals ~37% normalization step-down that may spook the market
- Technical overhead supply $50-$56 has repeatedly rejected rallies; failure to break creates a persistent capped range
- China domestic take rate pressure from Meituan and Alibaba's Fliggy competition in leisure travel
- US-listed Chinese ADR geopolitical/delisting risk — structural multiple compression regardless of fundamentals
- Sell-side PT trend is negative (JPM $75→$72, Citi $64→$62, prior L1 bearish PT cut) signaling estimate revisions ahead
- No formal buyback authorization despite $11B+ cash pile — capital allocation remains a missed catalyst until announced
Get AI analysis on any stock
This is one of hundreds of Kronos AI reports — scored fundamentals & technicals, bull/base/bear price targets, a multi-horizon plan, and continuously-updated forecasts across the market. Create a free account to explore them all.
Create your free account →Already a member? Sign in · Join our Discord