TIGR — AI Stock Forecast & Price Targets
Published 7/13/2026 · A free sample of K3vl4r’s AI-powered analysis.
Kronos price forecasts, scored fundamentals & technicals, and a multi-horizon plan.
View the live TIGR price forecast →
TIGR trades at $4.61, near 52-week lows and ~1x book, with a 7.4x TTM P/E and 4.9x forward P/E that already price in stress — yet Q1 2026 flipped to a $26.9M net loss, breaking a 3-quarter streak of $41-54M profits and forcing a re-underwrite of the earnings power. With $596M corporate cash vs $66M debt, forward EPS estimates still being revised up (+64%), but sell-side targets cut (Citi $16.80 → $7.10) and the chart badly damaged (-66% from 52wk high, -41% below SMA200), this is a HOLD with accumulation only into the $4.00-4.20 zone ahead of the binary Aug 27 print.
HOLD; do not initiate size ahead of the Aug 27 earnings binary (~45 days out). Range trade only: small nibble bids at $4.20-4.30 with a hard stop below $4.00, targeting $4.85-5.00 for a scalp. Do not chase; the daily is stuck under SMA20 at $4.65 with rel volume 0.29 and RSI 43 — no momentum signature. Invalidation for any short-term bull attempt: close below $4.00 on volume, which would open $3.50 quickly. Explicit earnings stance: no swing position through the Aug 27 print; either flat by Aug 25 or hedged with puts sized to the $4.00 downside scenario.
1-6 months: the setup is asymmetric IF the Aug 27 print discloses the Q1 loss as a one-off regulatory charge and Q2 shows a return to $40M+ net income. In that scenario, forward EPS of ~$0.94 × a normalized 8x multiple = $7.50 becomes reachable, aligned with the reduced Citi target of $7.10. In the bear case, if Q2 reveals ongoing pressure (either the penalty extending or margins compressing), the stock likely tests $3.50 with the $4.00 floor broken. Expected return range: -20% to +45% over 6 months, skewed slightly positive given valuation floor but constrained by regulatory/execution overhang. Change-my-mind triggers: (1) buyback authorization, (2) clear one-off disclosure at Q2, (3) sell-side target upgrades resuming, or downside (4) new China enforcement action, (5) Q2 miss with margin compression.
1-3 years: terminal thesis rests on TIGR compounding at 20-30% revenue growth with sustained 40%+ operating margins, translating scale into $1.00-1.50 of steady-state EPS, at which point a 10-12x multiple gives $10-18/share. Multi-year drivers: Singapore/SEA expansion, wealth management + IPO underwriting mix shift away from pure brokerage cyclicality, ESOP administration scale, and any regulatory clarity that lets the group re-rate toward global broker peers. Biggest structural risk is China policy: a specific enforcement action against digital brokers (data localization, capital controls, or forced restructuring of offshore accounts) could impair the growth trajectory and revalue the stock permanently lower. Secondary risk is that competitive pressure from Futu (FUTU) or the incumbent Chinese state banks compresses margins secularly. At 1x book with $3.30/sh in cash-per-share (corporate cash only), the downside is contained absent a franchise-impairing event.
The story bifurcates sharply between the trailing operating engine and the Q1 2026 bottom line. Revenue grew from $138.7M (Q2'25) → $175.6M (Q4'25) → $154.9M (Q1'26), still +26.5% Y/Y, and gross margin sits at 67-70% with operating margins of 41-49% across the last four quarters — clear evidence of a scalable platform. However, Q1 2026 broke the pattern with a $26.9M net loss and EPS Q/Q of -191.7%, despite $65.7M of operating income, implying a large non-operating or one-off charge (likely the previously disclosed regulatory penalty) rather than a franchise-level operating break. The balance sheet is genuinely fortress-like: $596M corporate cash, only $66M debt, book value $4.49/sh (stock at ~1.03x book), and $4.5B total cash on the platform. Caveat: total liabilities of $8.0B include customer segregated funds, so the leverage optics overstate corporate risk but understate franchise/trust risk. Capital allocation is the swing factor — with the stock at book, a buyback would be highly accretive; management has not signaled one. ROE 14.7%, ROA 1.4%, ROIC 12.7% are respectable but decelerating, and EPS next-Y estimates being revised up (+64%) while price targets fall creates the classic set-up where the sell-side ribbon lags the fundamental turn.
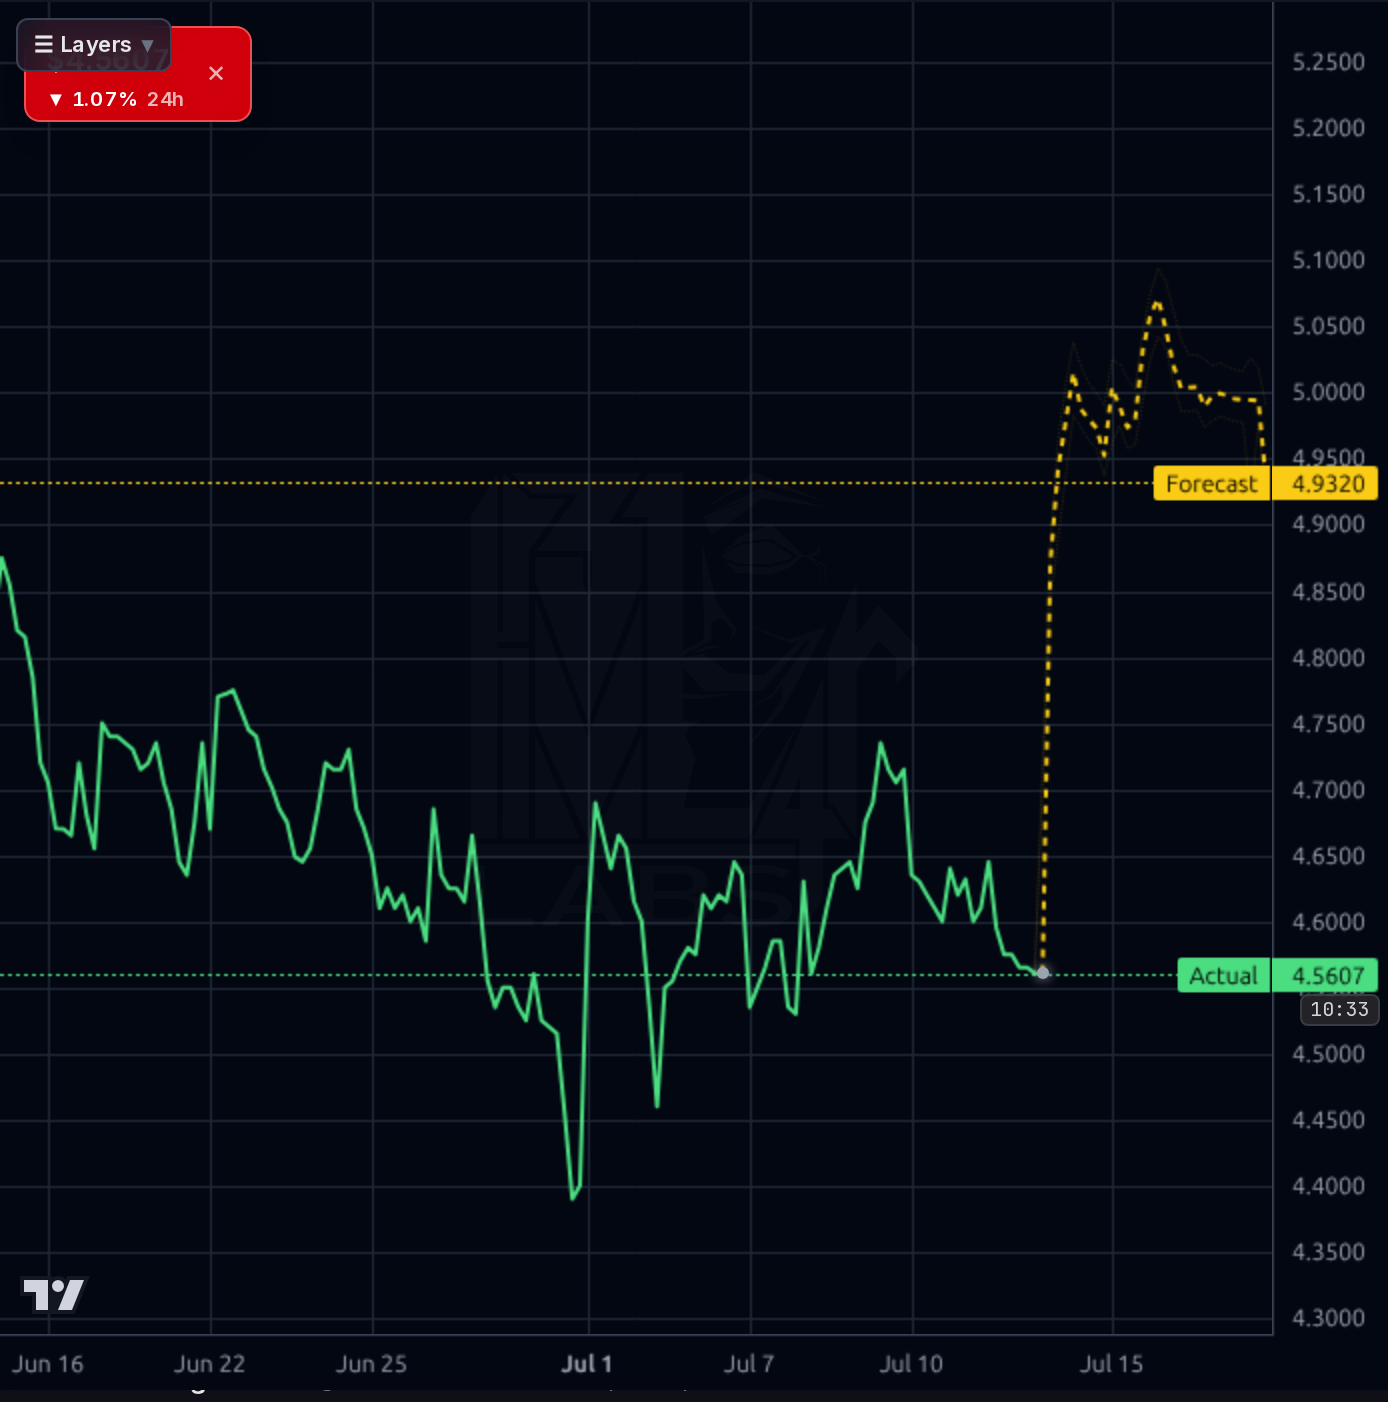
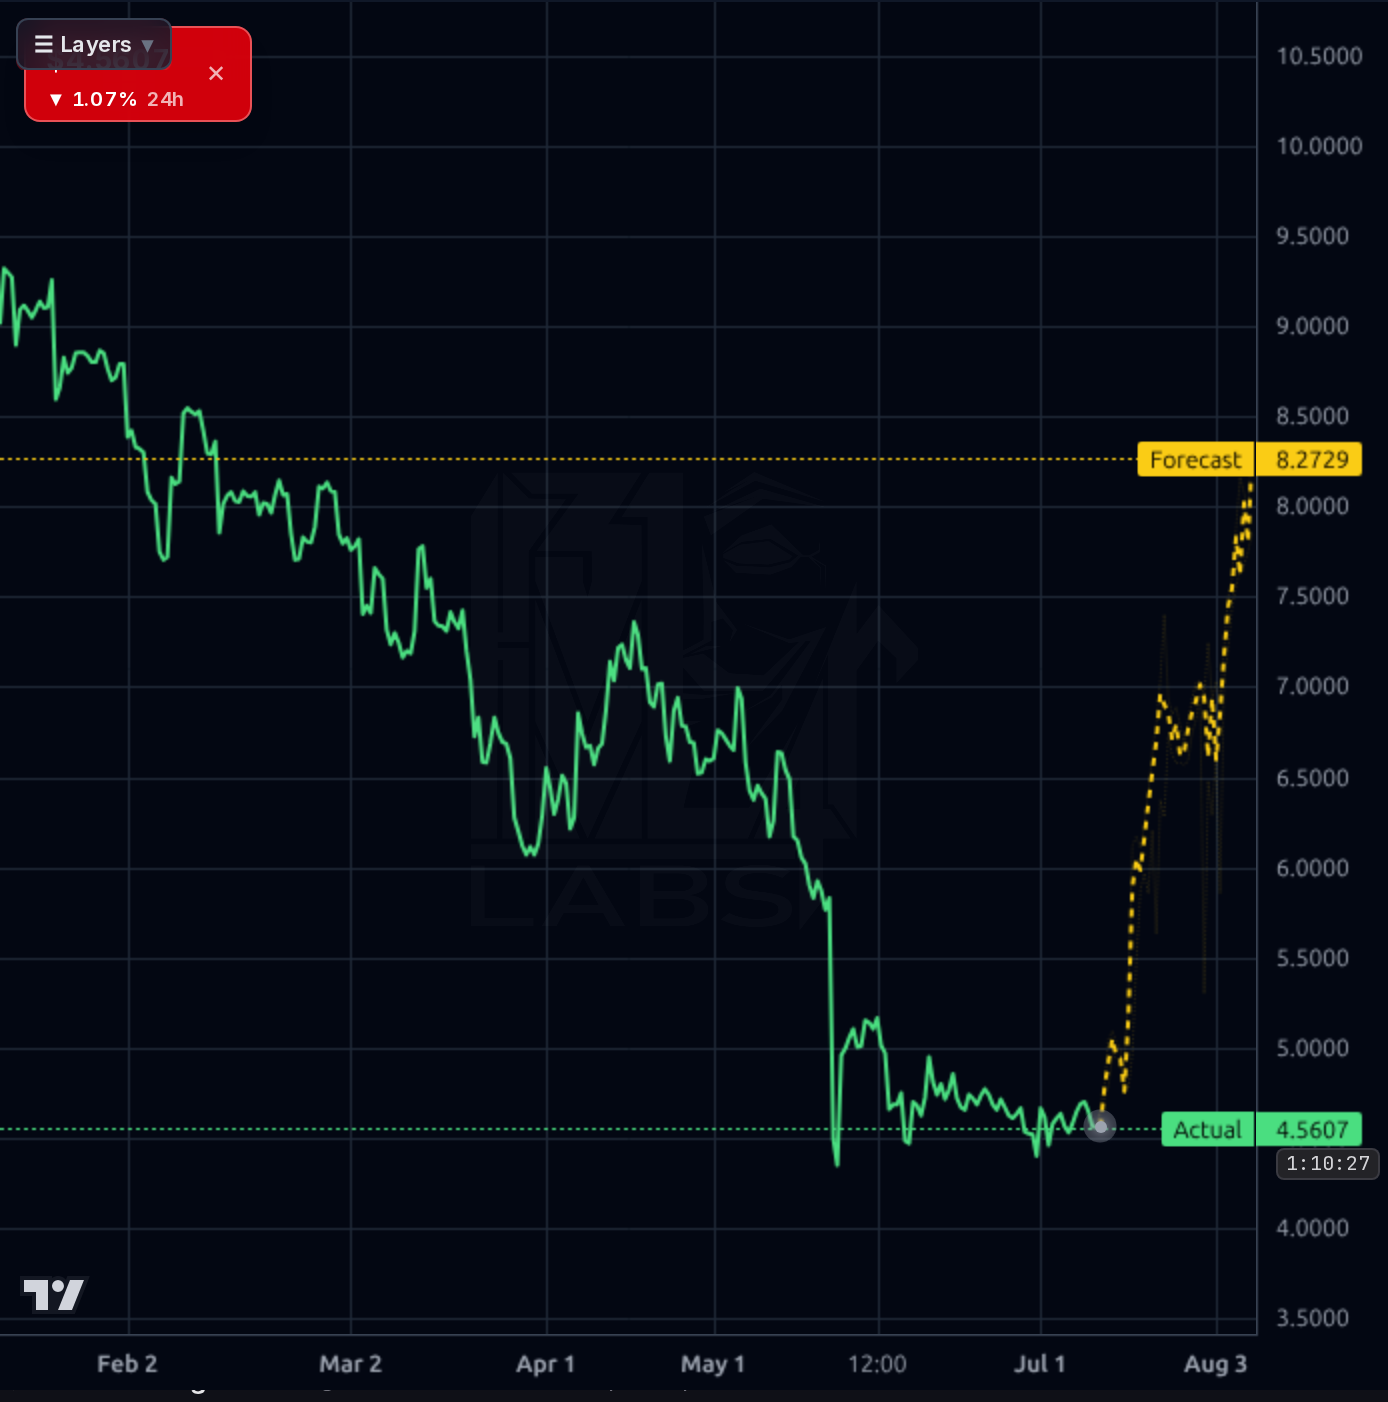
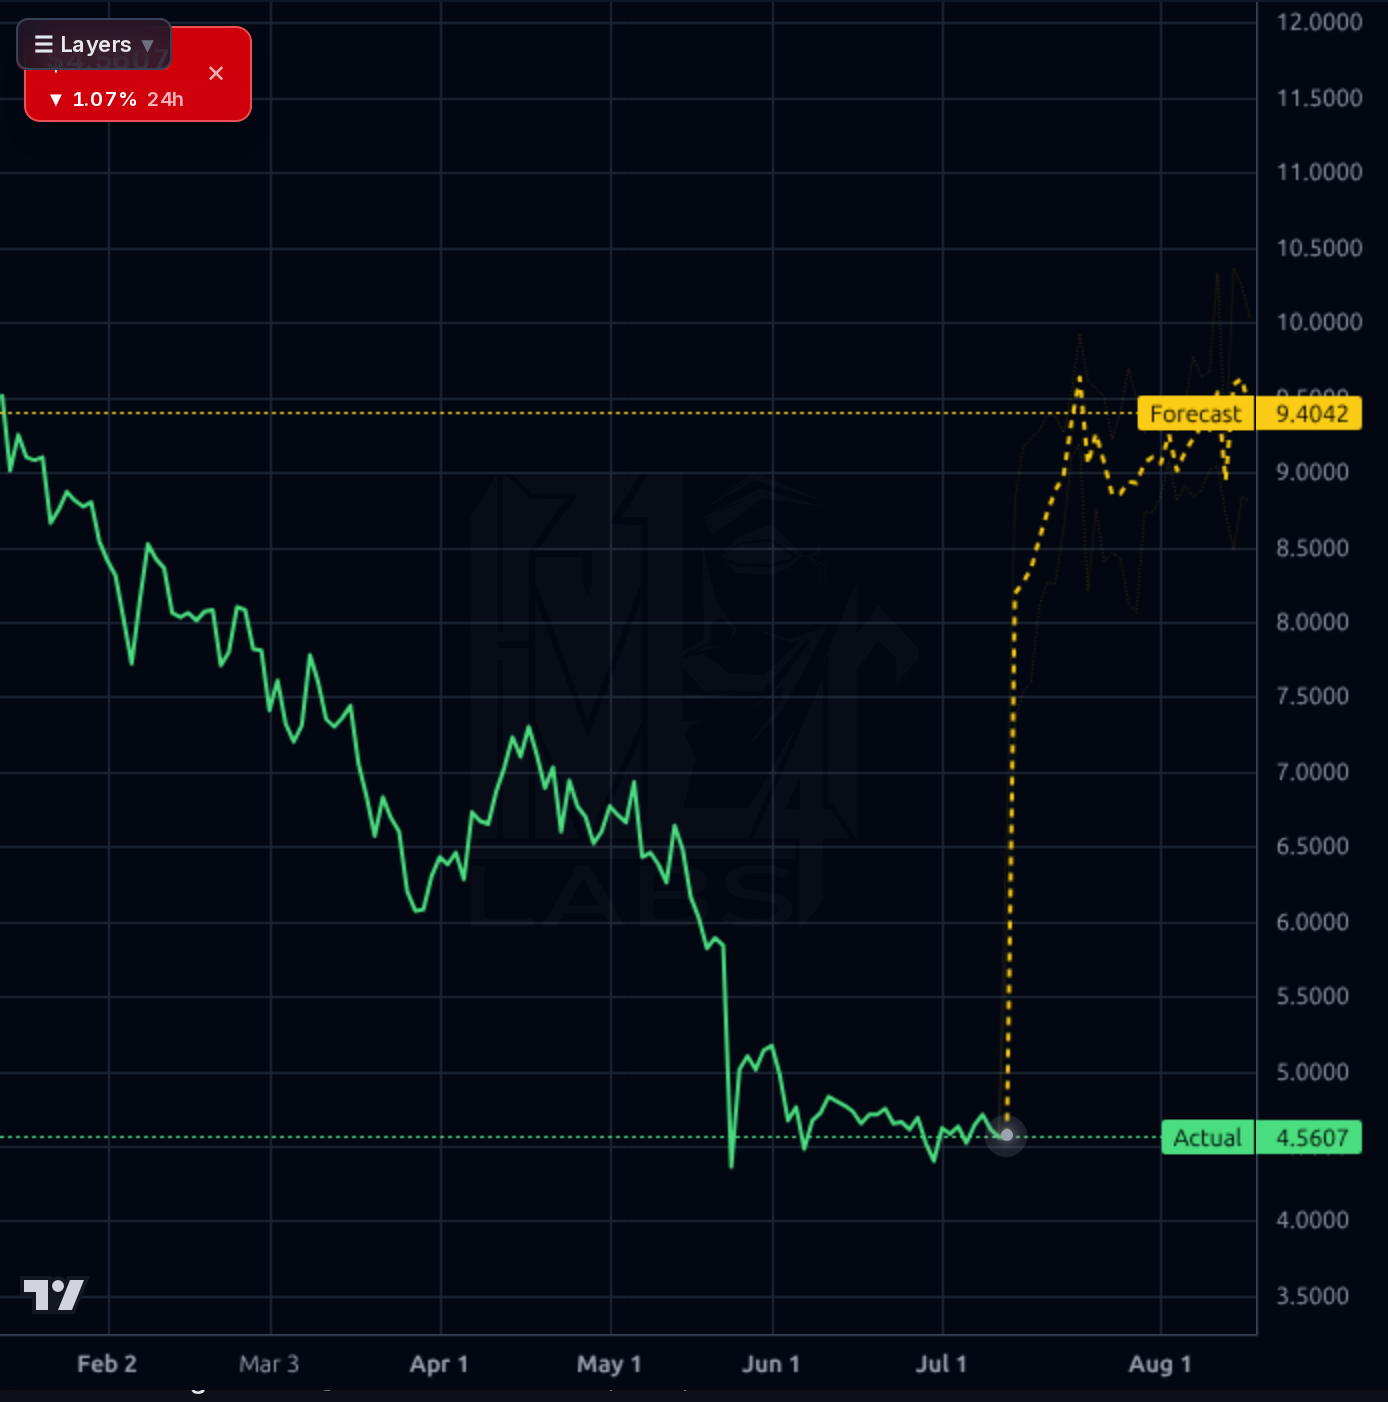
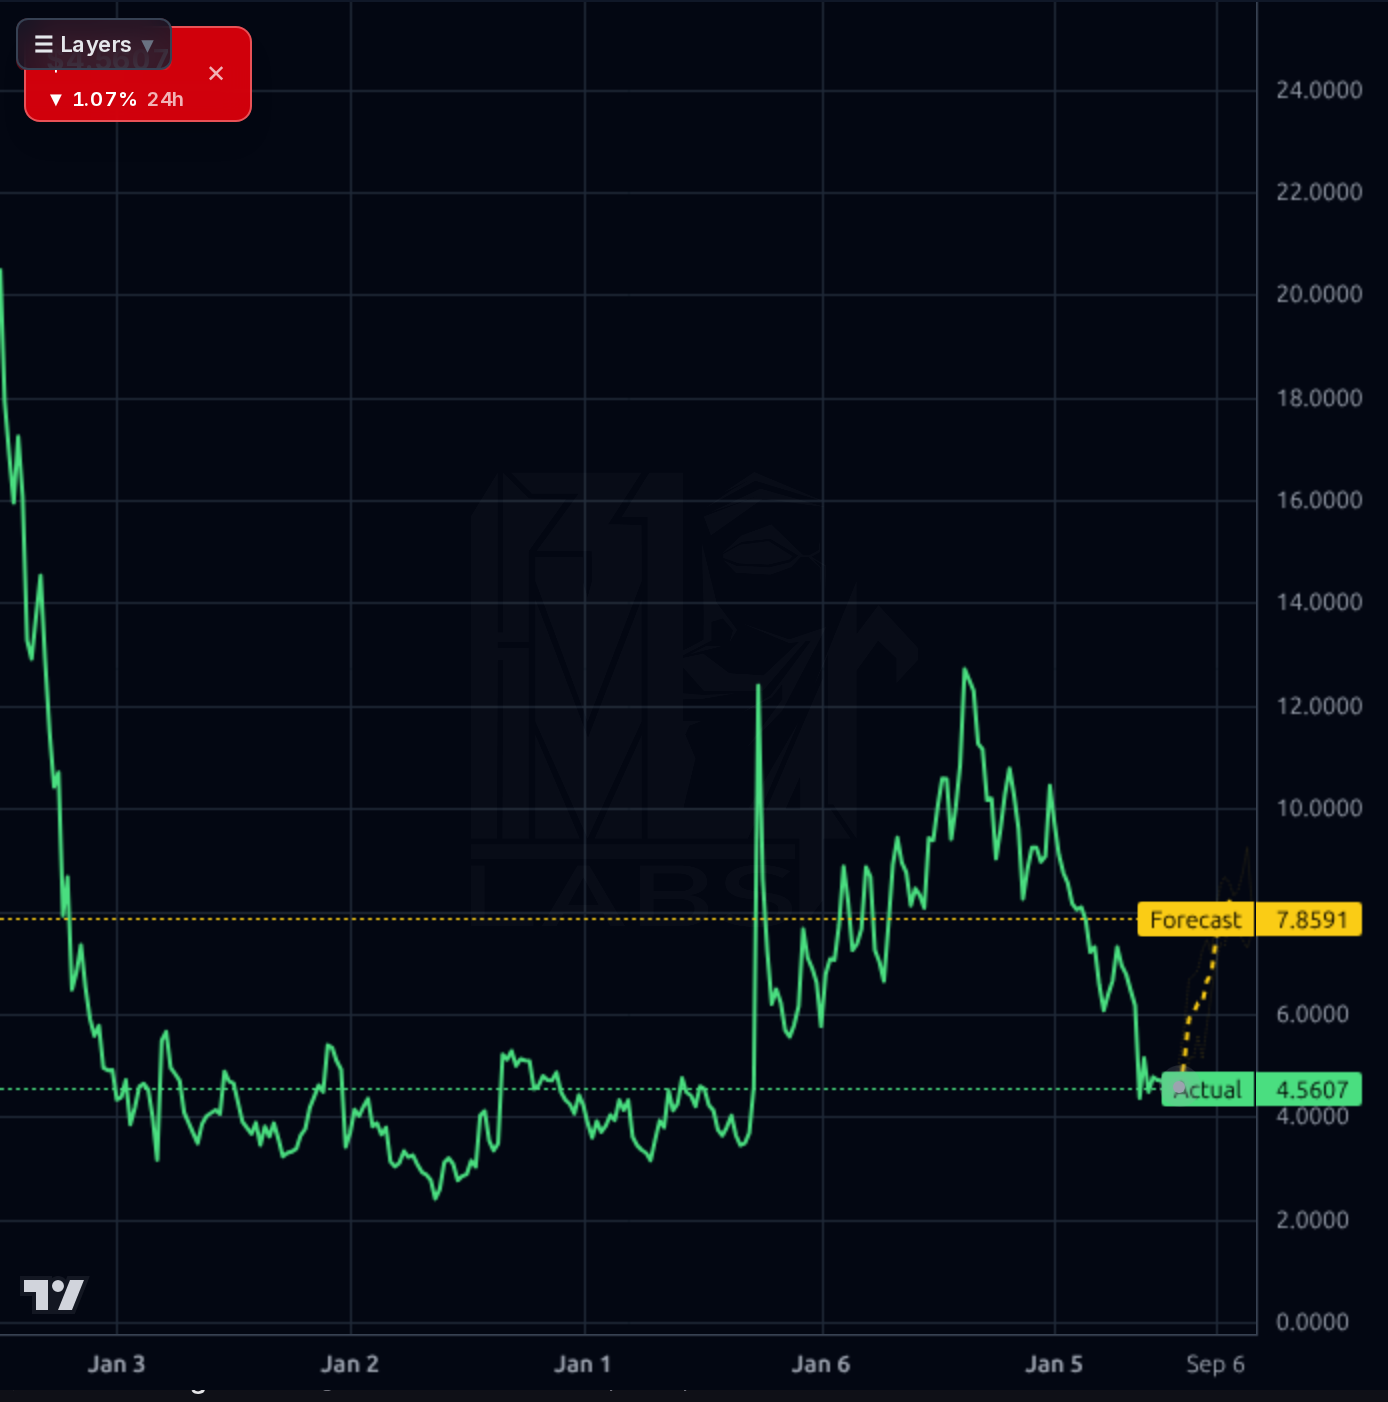
The setup is ugly across every timeframe. Weekly: multi-year downtrend from $20+ (Jan '21) to a $4.00 floor, with a failed rally to ~$12 that has fully retraced. Daily: -41% below SMA200, -12.8% below SMA50, -0.8% below SMA20 — flat-lining just under the short-term average, RSI 43, no divergence yet. 4h and 1h: tight range-bound consolidation between roughly $4.40 support and $4.75 resistance, with $4.00 as the hard 52-week floor and $5.00 the first meaningful overhead level, then $5.30 and the $6.50 gap-fill zone. Volume is subdued (rel volume 0.29), no accumulation signature. The AI forecast bands are aggressively bullish on every timeframe (1d target $4.93, 4h $8.27, 1d $9.40, 1wk $7.86), but the model's directional accuracy on this name is 26% vs 74% naive baseline at 1d and MAPE of 73% — it is worse than a coin flip here and should be discounted heavily. The one usable technical signal is that $4.00 has held twice; a break below invalidates the value-floor thesis, while a reclaim of $5.00 on rel-volume >1.5 would be the first sign base-building is complete.
The most important item is Citi's June 3 price target cut from $16.80 to $7.10 (Buy rating maintained) — a >50% haircut that helps explain the derating and reduces the sell-side ceiling to just ~$7. Simply Wall St also trimmed modeled fair value from $12.17 → $8.58 → $8.16 in successive updates, all citing near-term earnings pressure and China regulatory uncertainty balanced against long-term execution potential. The Q1 2026 earnings call (June 2) confirmed strong revenue growth but flagged a regulatory penalty and market turbulence as the drivers of the loss, which is consistent with a one-off classification but is not yet definitive. Retail social sentiment includes some negative signal linking TIGR (as broker) to a suspected pump-and-dump in an unrelated microcap — likely noise, but worth monitoring since franchise/trust risk is the asymmetric downside on this name. No buyback authorization has been announced despite the stock trading at book with $596M corporate cash — a notable capital-allocation absence.
- Revenue growth reacceleration: Q1 2026 sales +26.5% Y/Y and sales past 3/5Y at 39.7%/34.2% — reinvestment in the Tiger Trade platform continues to compound
- Diversification into asset/wealth management, ESOP services, and IPO underwriting reduces pure-brokerage cyclicality (multi-year mix-shift story visible in operating margin durability at 41-49%)
- $596M corporate cash and $66M debt against $836M market cap sets up potential buyback at ~1x book — highly accretive if authorized
- Multi-jurisdictional licensing (Singapore HQ, NZ, Cayman, US) hedges pure China regulatory risk and enables cross-border wealth flows from SEA
- Forward EPS estimates being revised up (+46% → +54% → +64% next-Y) signal underlying earnings power the sell-side price ribbon has not caught up to yet
- Q1 2026 net loss (-$26.9M) not yet definitively classified as one-off — if structural, forward P/E of 4.9x is a value trap
- China regulatory overhang: prosecutorial stance on crypto/AML and potential enforcement against offshore digital brokers is an ongoing tail risk
- Sell-side derating momentum (Citi $16.80 → $7.10; SWS $12.17 → $8.16) often precedes further downside as estimates cascade
- Technical damage severe: -66% from 52wk high, -41% below SMA200, RSI 43 — mean reversion typically takes quarters, not weeks
- Aug 27 earnings is a binary with demonstrated gap risk — no signal advantage into the print
- $8.0B liabilities include customer segregated funds — franchise/trust event risk is asymmetric even if operationally remote
- No buyback signal despite stock at ~1x book with $596M cash — either management sees risks not disclosed or is preserving optionality
- AI forecast model is unreliable on this ticker (26-33% directional accuracy, worse than naive) — do not use its bands as trade targets
Get AI analysis on any stock
This is one of hundreds of Kronos AI reports — scored fundamentals & technicals, bull/base/bear price targets, a multi-horizon plan, and continuously-updated forecasts across the market. Create a free account to explore them all.
Create your free account →Already a member? Sign in · Join our Discord