TMDX — AI Stock Forecast & Price Targets
Published 7/23/2026 · A free sample of K3vl4r’s AI-powered analysis.
Kronos price forecasts, scored fundamentals & technicals, and a multi-horizon plan.
View the live TMDX price forecast →
TMDX is a category-leading organ preservation platform with elite quality metrics (45% ROE, 59% GM, 30% TTM revenue growth) trading at $75.38 after a ~52% drawdown from $156, with a binary Aug 4 earnings print ~12 days away as the decisive catalyst. Q1 2026's operating margin collapse to 7.6% and FCF flip to -$12M against a $173.9M revenue beat is the central controversy — one-time capex/logistics build vs. structural erosion. The setup is a de-rated quality name with real optionality but genuine downside if margin recovery slips; sizing into the print is not warranted.
Aug 4 AMC earnings is ~12 days out — do NOT size a directional swing trade into it. Hold existing positions; do not add. Key pre-print levels: support $70/$65, resistance $80. A confirmed daily close below $65 pre-print would be a de-risk signal. Post-print stance: if operating margin recovers toward 15%+ and FCF flips positive, look to add on any consolidation above $80 with $95-100 as the first upside target. If margin stays sub-10% or FCF is still negative, expect a gap to $60-65 and reassess — do not catch the falling knife. Retail bullishness at 75% into a binary with 23.7% short float is a contrarian caution flag — expect an outsized move either direction.
1-6 month base case assumes Q2 shows partial margin recovery (10-15% op margin) and management provides credible bridge back to 20%+ by year-end; that path supports a re-rating toward $85-95. Bull path requires Q2 op margin >18% AND FCF flip positive AND unchanged/raised FY26 guide of $727-757M — that unlocks the $100-110 zone but the $114 sell-side consensus target has not printed in the last several attempts and is stretched given the model's forecast unreliability. Bear path (margin sub-10%, guide cut) opens $55-60. What changes my mind: two consecutive quarters of operating margin expansion and NOP flight volume acceleration would move this to ACCUMULATE.
1-3 year terminal thesis is intact and genuinely differentiated: TMDX is the only integrated OCS-plus-logistics platform for organ transplant, with an expanding TAM (Kidney launch 2026-27, EU NOP replication via PAD Aviation, Italy template), and TTM sales growth still 30%. If they execute, 2028 revenue in the $1.0-1.2B range at recovered 20%+ operating margins supports $120-160+. Biggest structural risk is CMS/reimbursement policy shifts to organ preservation economics — unhedgeable and existential. Secondary risk is competitive clearance (already flagged in-market) eroding pricing power on the liver segment (80% of product revenue). Debt load ($863M) becomes concerning if utilization ramp fails to materialize by end-2026.
The underlying franchise remains elite in isolation: TTM revenue $635.9M with sales growth of 30% Y/Y, gross margin 59.1%, ROE 45.2%, and profit margin 27% (flattered by tax/one-timers). The problem is the sequential trajectory — quarterly operating margin has walked down from 23.2% (Q2'25) → 16.2% (Q3'25) → 13.2% (Q4'25) → 7.6% (Q1'26), and FCF flipped from +$82.5M in Q2'25 to -$12.1M in Q1'26 as capex ran $36.7M/quarter. Total debt grew to $863M against $462M cash (Debt/Eq 1.75), reflecting the convertible-funded capacity build; the balance sheet is still liquid (current ratio 6.7, working capital $527M) but leverage is real and interest coverage will thin if margin doesn't recover. Revenue concentration in liver (~80%) and reliance on NOP logistics scaling remain the two big operational unknowns. This is a growth story mid-transition — capex/opex front-loaded ahead of a utilization ramp that has to actually show up in Q2. Fwd P/E of ~25x on depressed forward EPS ($2.77) is not a valuation-trap setup, but neither is it cheap without margin recovery.
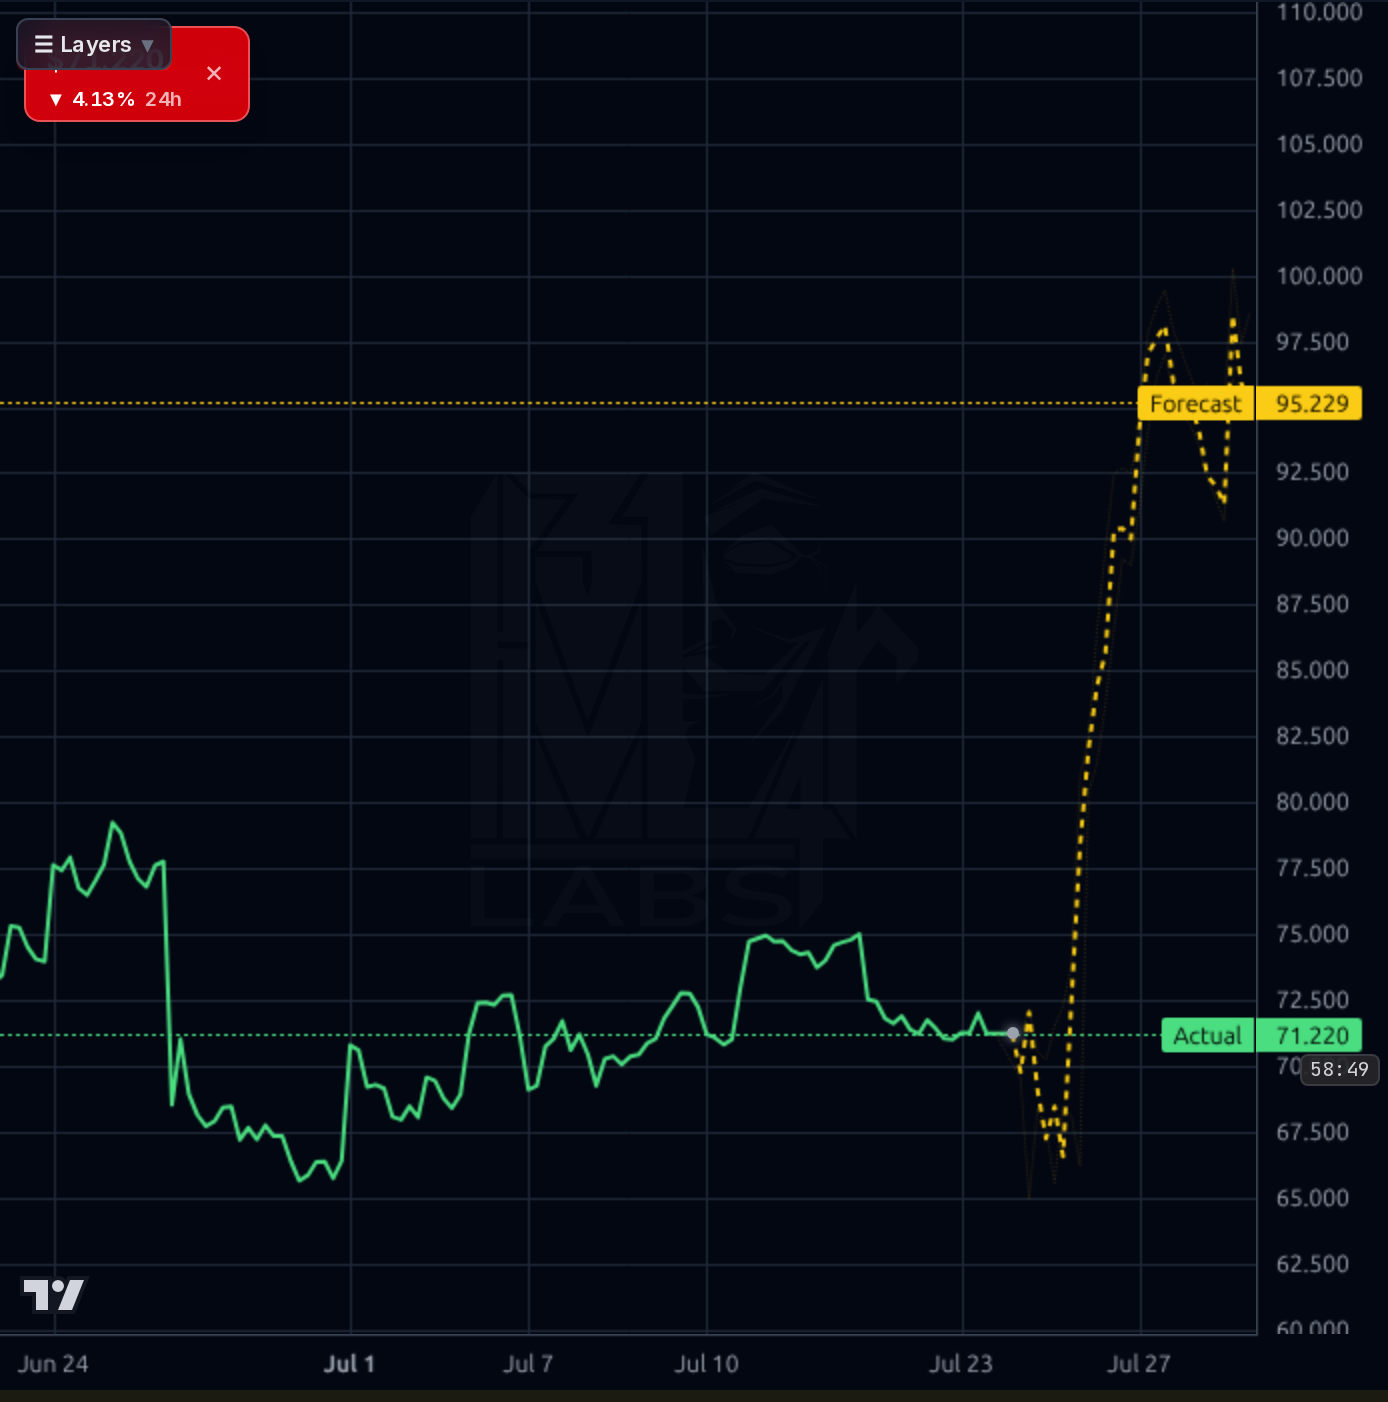
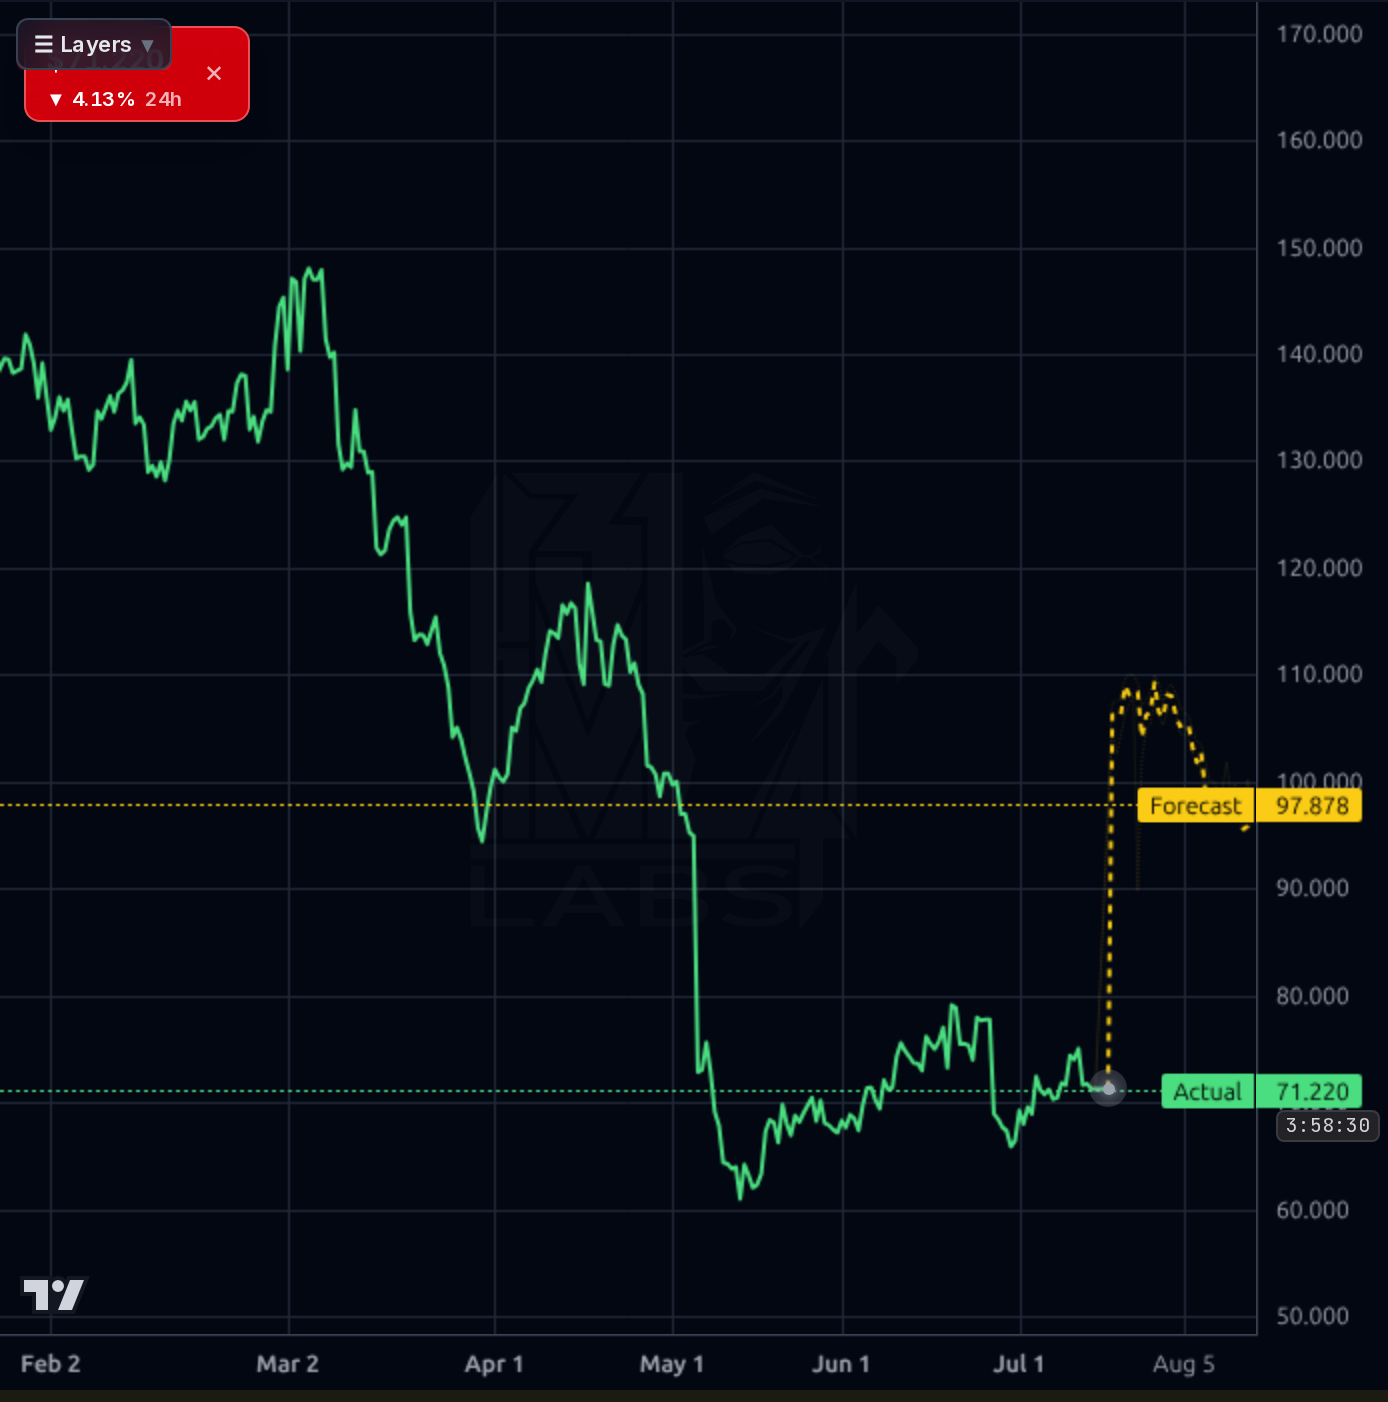
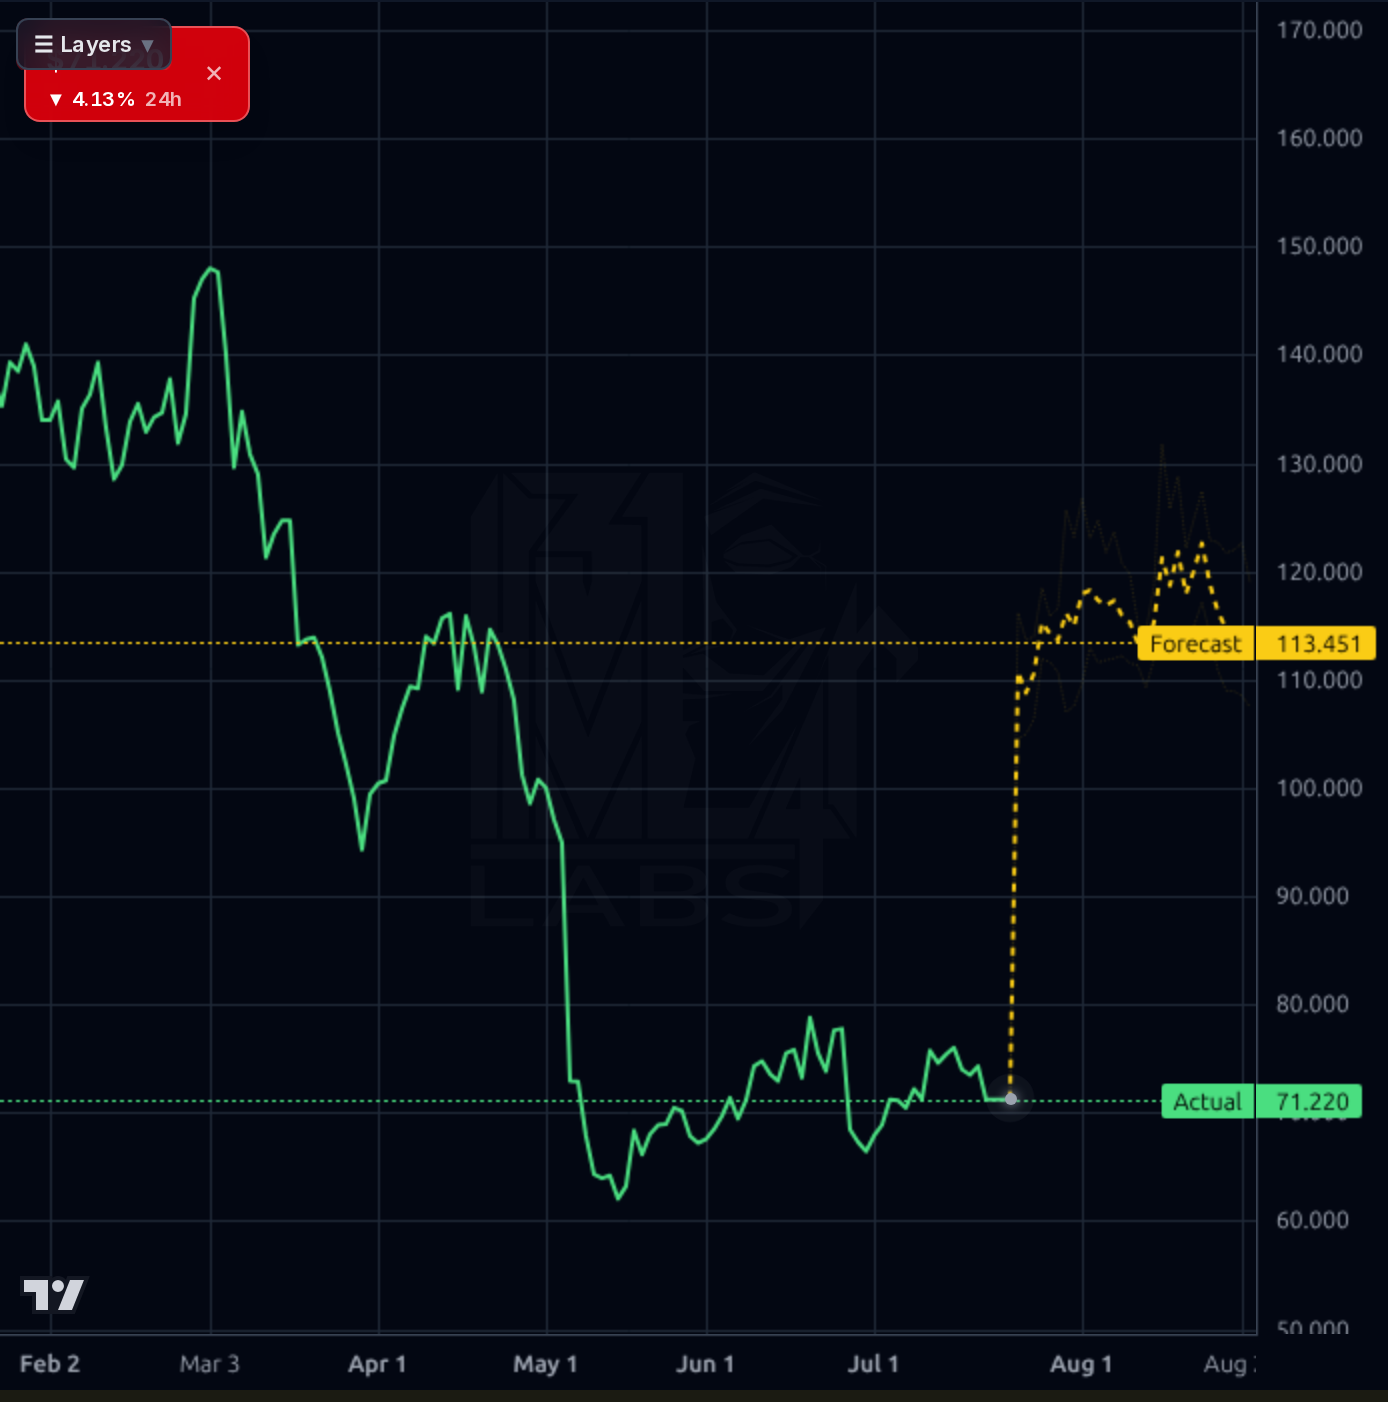
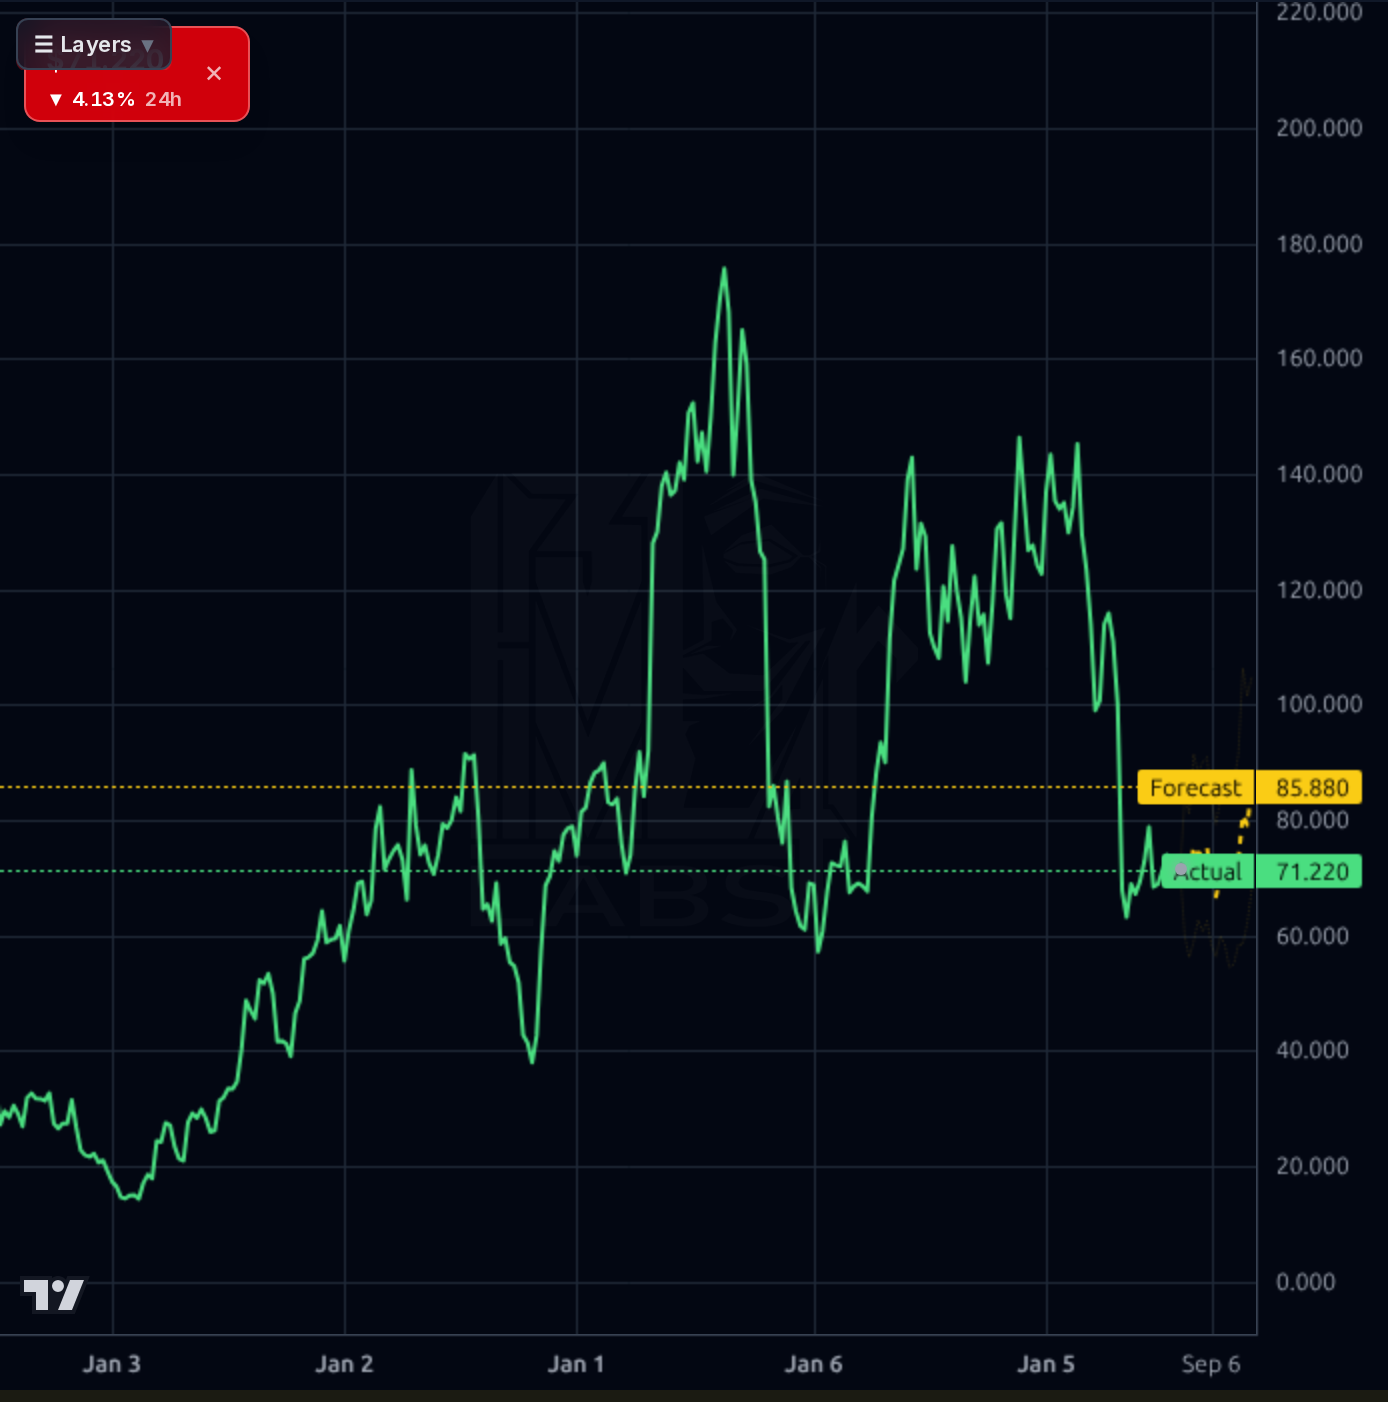
Across timeframes the picture is a broken uptrend consolidating just above key support. Weekly: down ~52% from the $156 high, currently sitting at $71.22 (mid-range vs the $60/$147 12-month band); the base at ~$60-65 has held twice since May. Daily: a rounded-bottom / higher-low structure from the May $60 low, but stalled below the $80-90 supply zone; SMA200 is -35.5% overhead, SMA50 essentially flat (+0.4%), SMA20 -1.5% — a coiled, trendless posture. 4h/1h: minor rally attempt into the July 23 print zone with price fading; RSI 45.5, not oversold, not overbought. The AI forecast band projects a sharp move to $85-100 across 1h/4h/1d — this model has been empirically unreliable on this name (1wk directional accuracy 17% vs 67% naive; 1d 65% vs 66% naive), so those upside projections must be heavily discounted. Real resistance layer: $80 (repeatedly rejected), then $90-95, then the $100-105 gap-fill zone. Real support: $70 (dotted line on chart), $65, then $60.10 52-week low.
[Correction: 8 recent article(s) were provided — see the news.] Signal: analyst posture is holding constructive despite the drawdown — Evercore ISI trimmed PT to $90 from $100 (still Outperform, July 6), TD Cowen reiterated Buy at $120 (July 1), consensus target $114 with a Recom of 1.64 (near strong-buy). The bull narrative from sell-side is that Q1 margin pressure is transitory and the core growth thesis is intact (SeekingAlpha, TD Cowen, ChartMill affordable-growth screen). The strategic investment in PAD Aviation (Germany) is a concrete step toward European NOP replication and is directionally positive for the multi-year story but doesn't move Q2 numbers. Noise: retail sentiment on social is a mix of 'buy the dip' cheerleading and hostile posts predicting negative Q2 EPS — a 75% bullish/25% bearish split with 23.7% short float is a genuine binary setup into earnings. Nothing in the news changes the fundamental question: does Q2 operating margin recover meaningfully off the 7.6% Q1 low?
- European NOP replication via July 2026 PAD Aviation (Germany) strategic investment — extends the Italy/Mercedes-Benz template into a pan-European rollout by 2027
- OCS Kidney platform launch expected late 2026 / early 2027 — expands addressable organ market beyond liver-dominated (~80% of product) revenue mix
- Full-year 2026 revenue guide $727-757M implies ~15-19% growth; Q1 was $173.9M (+21% Y/Y), leaving room for upside if NOP utilization accelerates
- $344M debt-funded capacity expansion is positioned as future operating-leverage catalyst once utilization catches up to the built footprint
- Heart DCD adoption expansion — expanding the addressable donor pool for the Heart OCS product line
- Q1 2026 operating margin collapsed to 7.6% from 23.2% in Q2 2025 — if Q2 confirms structural erosion rather than transitory capex, the entire quality-name thesis breaks
- FCF flipped to -$12.1M in Q1 with capex running $36.7M/quarter; $863M total debt vs $462M cash creates real leverage pressure if utilization ramp delays
- Binary Aug 4 earnings print with 23.7% short float and 75% retail-bullish sentiment — asymmetric downside gap risk if margin/guide disappoints
- $80 resistance has been rejected repeatedly across recent attempts; without a confirmed weekly close above it, technical setup remains fragile
- CMS/reimbursement policy shifts are an unhedgeable existential risk to OCS unit economics
- Liver segment concentration (~80% of product revenue) exposes the company to competitor clearance events and single-segment shocks
- AI forecast model has been empirically unreliable on this name (1wk directional accuracy 17% vs 67% naive baseline) — do not anchor to its $85-100 projections
Get AI analysis on any stock
This is one of hundreds of Kronos AI reports — scored fundamentals & technicals, bull/base/bear price targets, a multi-horizon plan, and continuously-updated forecasts across the market. Create a free account to explore them all.
Create your free account →Already a member? Sign in · Join our Discord