TMUS — AI Stock Forecast & Price Targets
Published 7/24/2026 · A free sample of K3vl4r’s AI-powered analysis.
Kronos price forecasts, scored fundamentals & technicals, and a multi-horizon plan.
View the live TMUS price forecast →
T-Mobile just gapped down ~10.75% post-Q2 on a revenue miss despite an EPS beat and raised FCF guidance, resetting the stock to $170 near its 52-week low with RSI 36 and price 15% below the 200DMA. Fundamentals remain high-quality (24% op margin, $11B FCF, PEG 0.63, Recom 1.43, target $247) but leverage is heavy (Debt/Eq 2.17) and the Kronos model has been beaten by naive baseline in this regime, so its bullish forecast deserves discounting. Net: an oversold, high-quality compounder trading at 11.9x fwd P/E — attractive for accumulation, but knife-catching risk is real given deteriorating breadth and a broken technical structure.
Post-gap-down, expect chop between the 52-week low $165.66 and the gap-fill zone $188-192. A small starter position here ($170) makes sense for tactical traders, sized 1/3 of intended position, with a stop below $163 (invalidates the oversold bounce thesis and opens $158). Do not chase into the gap; wait for either a reclaim of $180 on volume or a retest of $165 that holds. Discount the Kronos 1D/1wk bullish forecasts — they've underperformed naive baseline in this regime.
1-6 month base case: dead-money-to-modest-recovery as the market digests the revenue-miss narrative and satellite competition fears. Catalysts: Q3 earnings 2026-10-22 (must show revenue reacceleration and subscriber trends holding), further buyback execution, and any concrete SpaceX/ASTS commercial data points that either confirm or refute the competitive threat. Base case return $185-200 (+9% to +17%); bull case $215+ if guidance is reaffirmed and satellite fears fade. Change my mind if Q3 shows further margin compression below 19% op margin or postpaid net-add deceleration.
1-3 year thesis: TMUS remains the structurally-advantaged US wireless carrier with the best 5G spectrum position, superior FCF conversion, and a demonstrated buyback/dividend growth story. At 11.9x fwd P/E and PEG 0.63 with 20%+ operating margins, downside from here is limited barring a genuine satellite disruption. Terminal risk is exactly that: if direct-to-cell satellite (SpaceX/ASTS) becomes a real substitute for tier-3/rural cellular, the entire industry re-rates lower. Secondary risk is the $119B debt load in a higher-for-longer rate environment. Target $240-260 over 2-3 years assuming multiple re-rating back to 14-15x on $17-18 EPS.
TMUS generated $92.2B TTM revenue with 9.5% Y/Y growth, 24.1% operating margin, 62.5% gross margin, and $11.0B FCF against a $184B market cap (P/FCF ~11.8, EV/EBITDA 9.1). ROE is a healthy 18.0% and forward P/E of 11.9 with PEG 0.63 screens cheap for a telecom with these margins. That said, quarterly trends show softening: Q1'26 revenue $23.1B with op margin compressing to 19.5% from 24.7% in Q2'25, and net income dropping to $2.50B from $3.22B — EPS Q/Q -11.9%. The balance sheet carries $121B in total debt vs $55.9B equity (Debt/Eq 2.17, LT Debt/Eq 2.04) and only $3.5B cash — a legacy of Sprint integration and spectrum spend. Capital allocation is aggressive: $2.5B buyback in the latest tranche (13.25M shares) plus a 2.3% dividend at a 37.7% payout, funded by robust $28.8B operating cash flow. The story is fine; the deceleration in top-line growth versus the multiple the market had been paying is what broke.
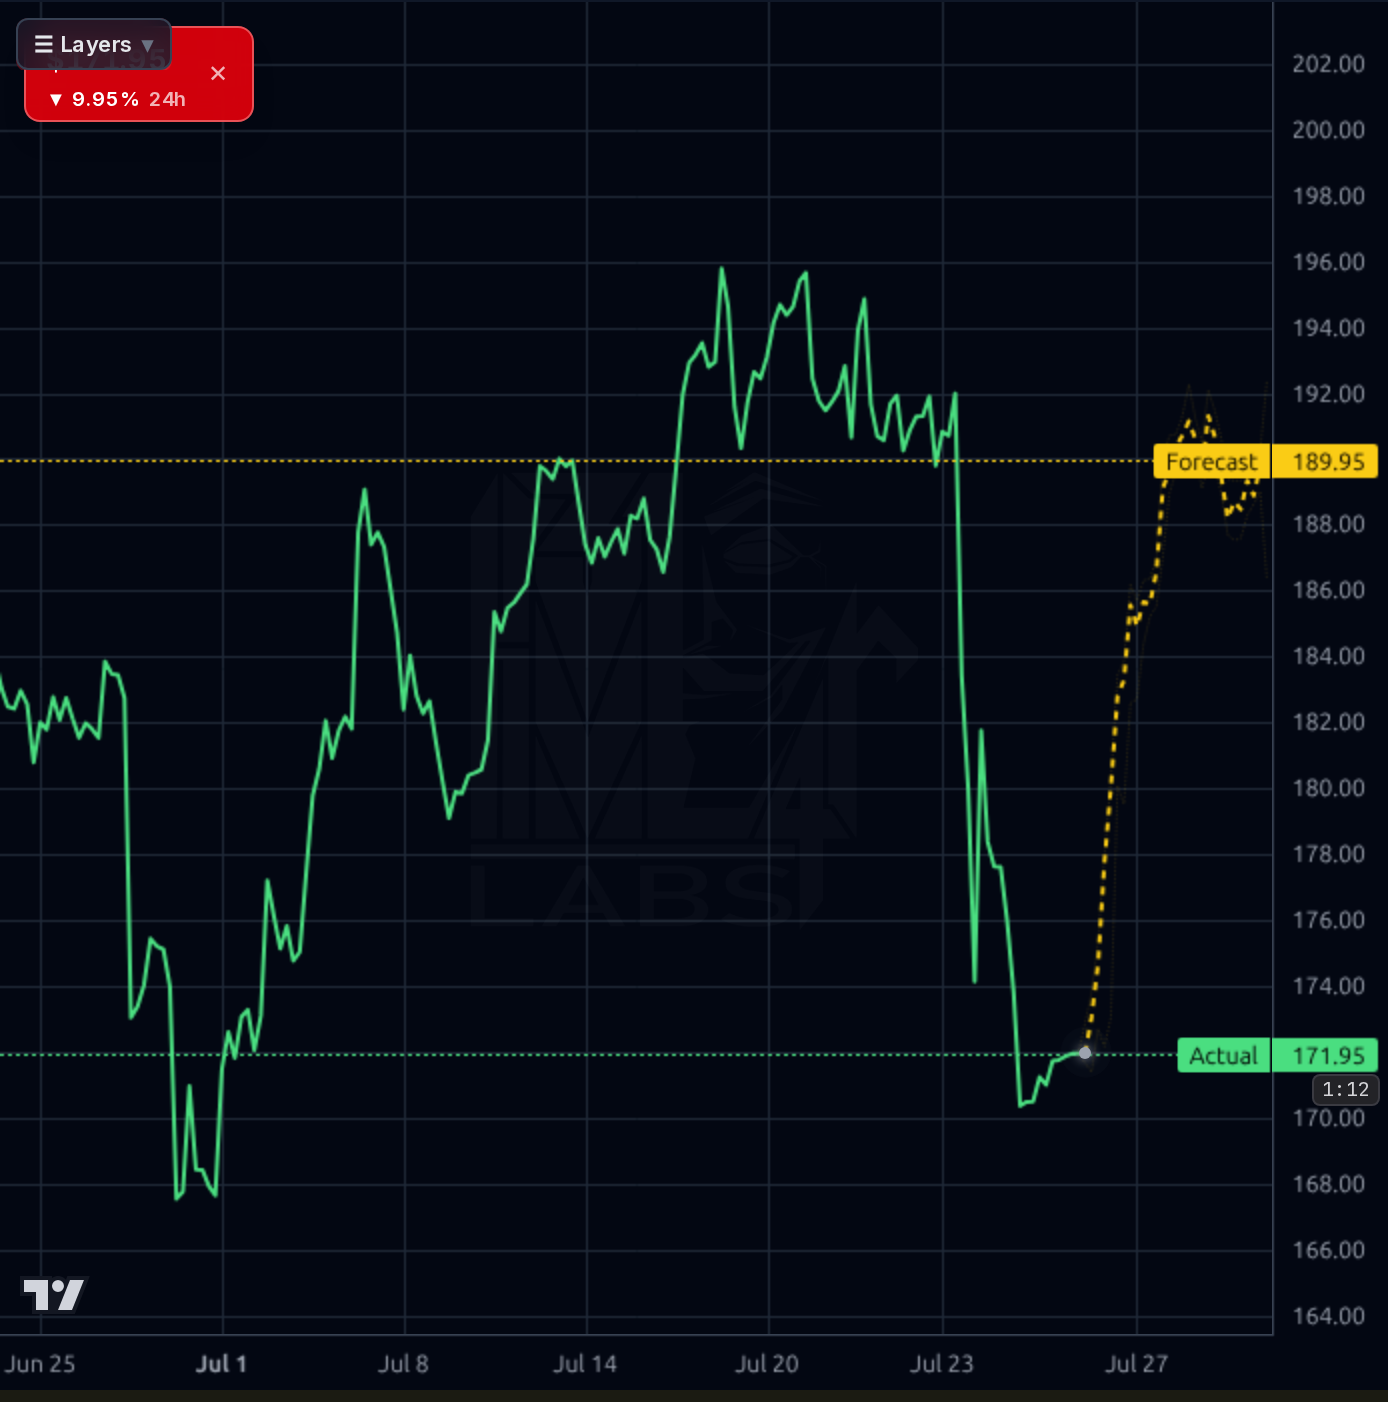
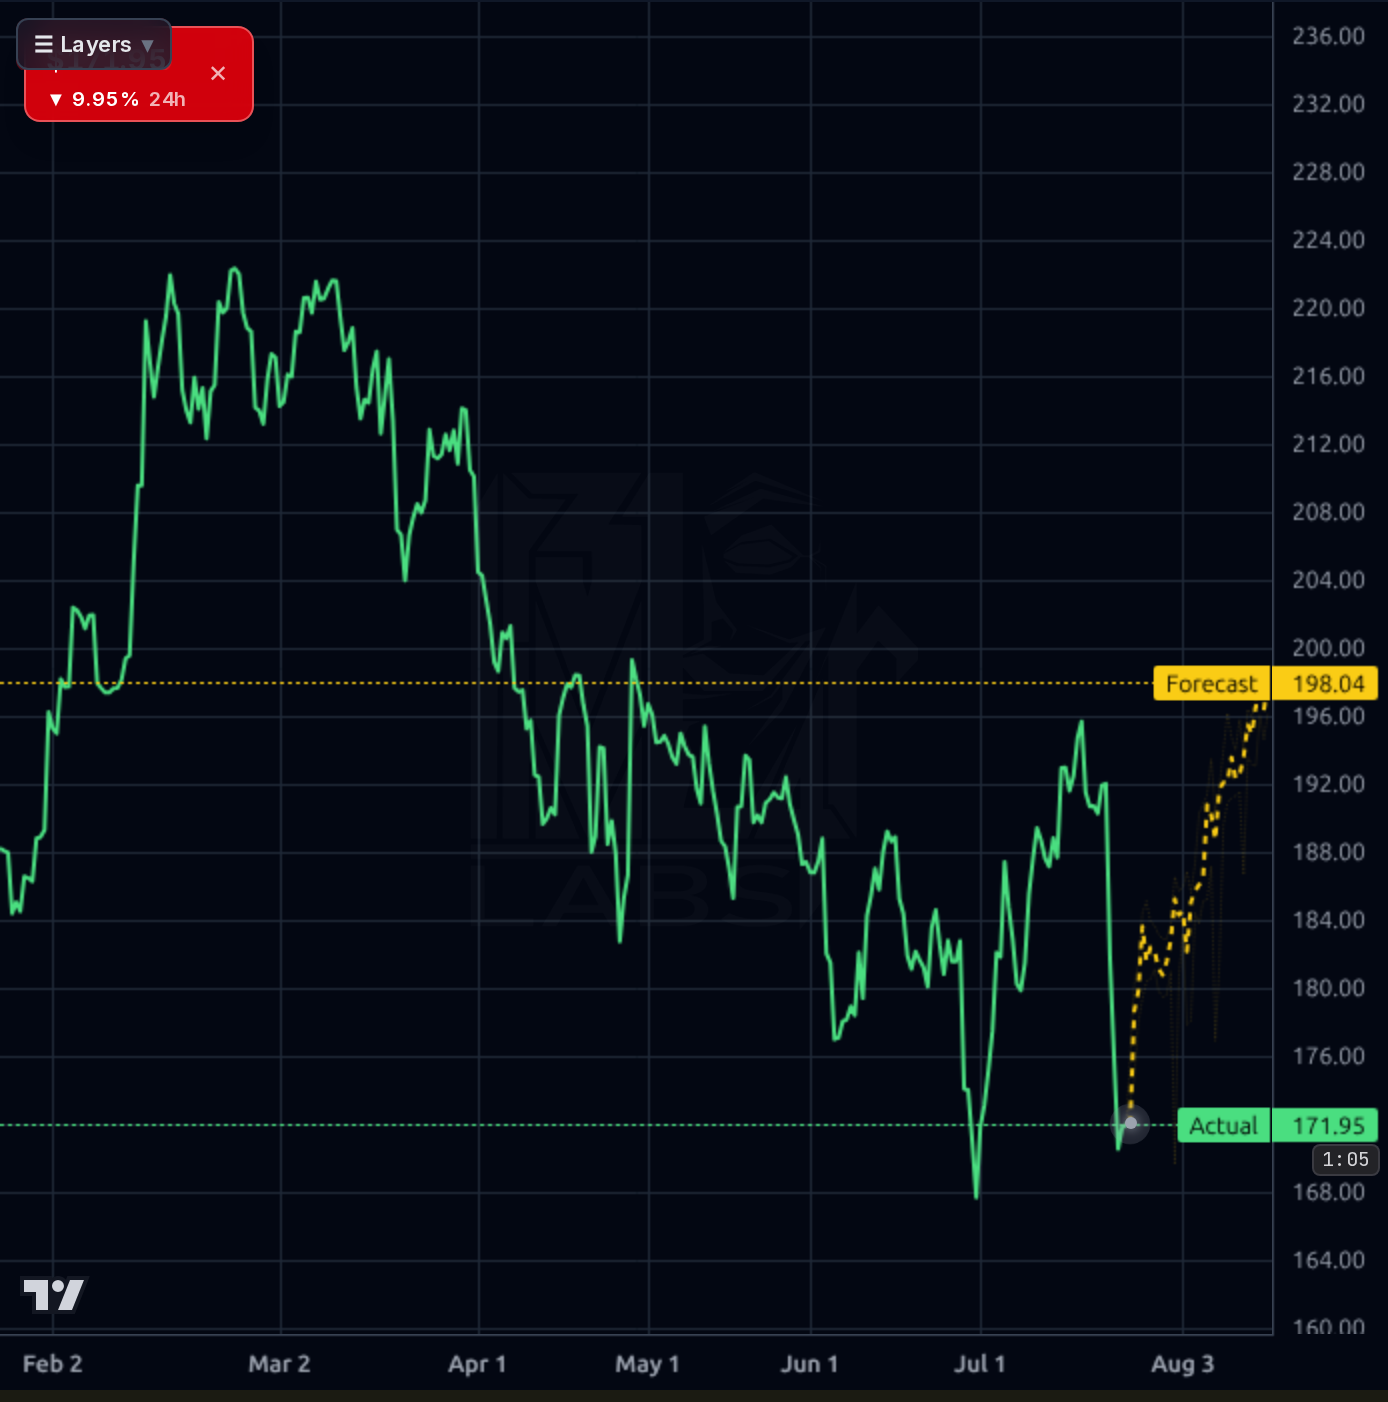
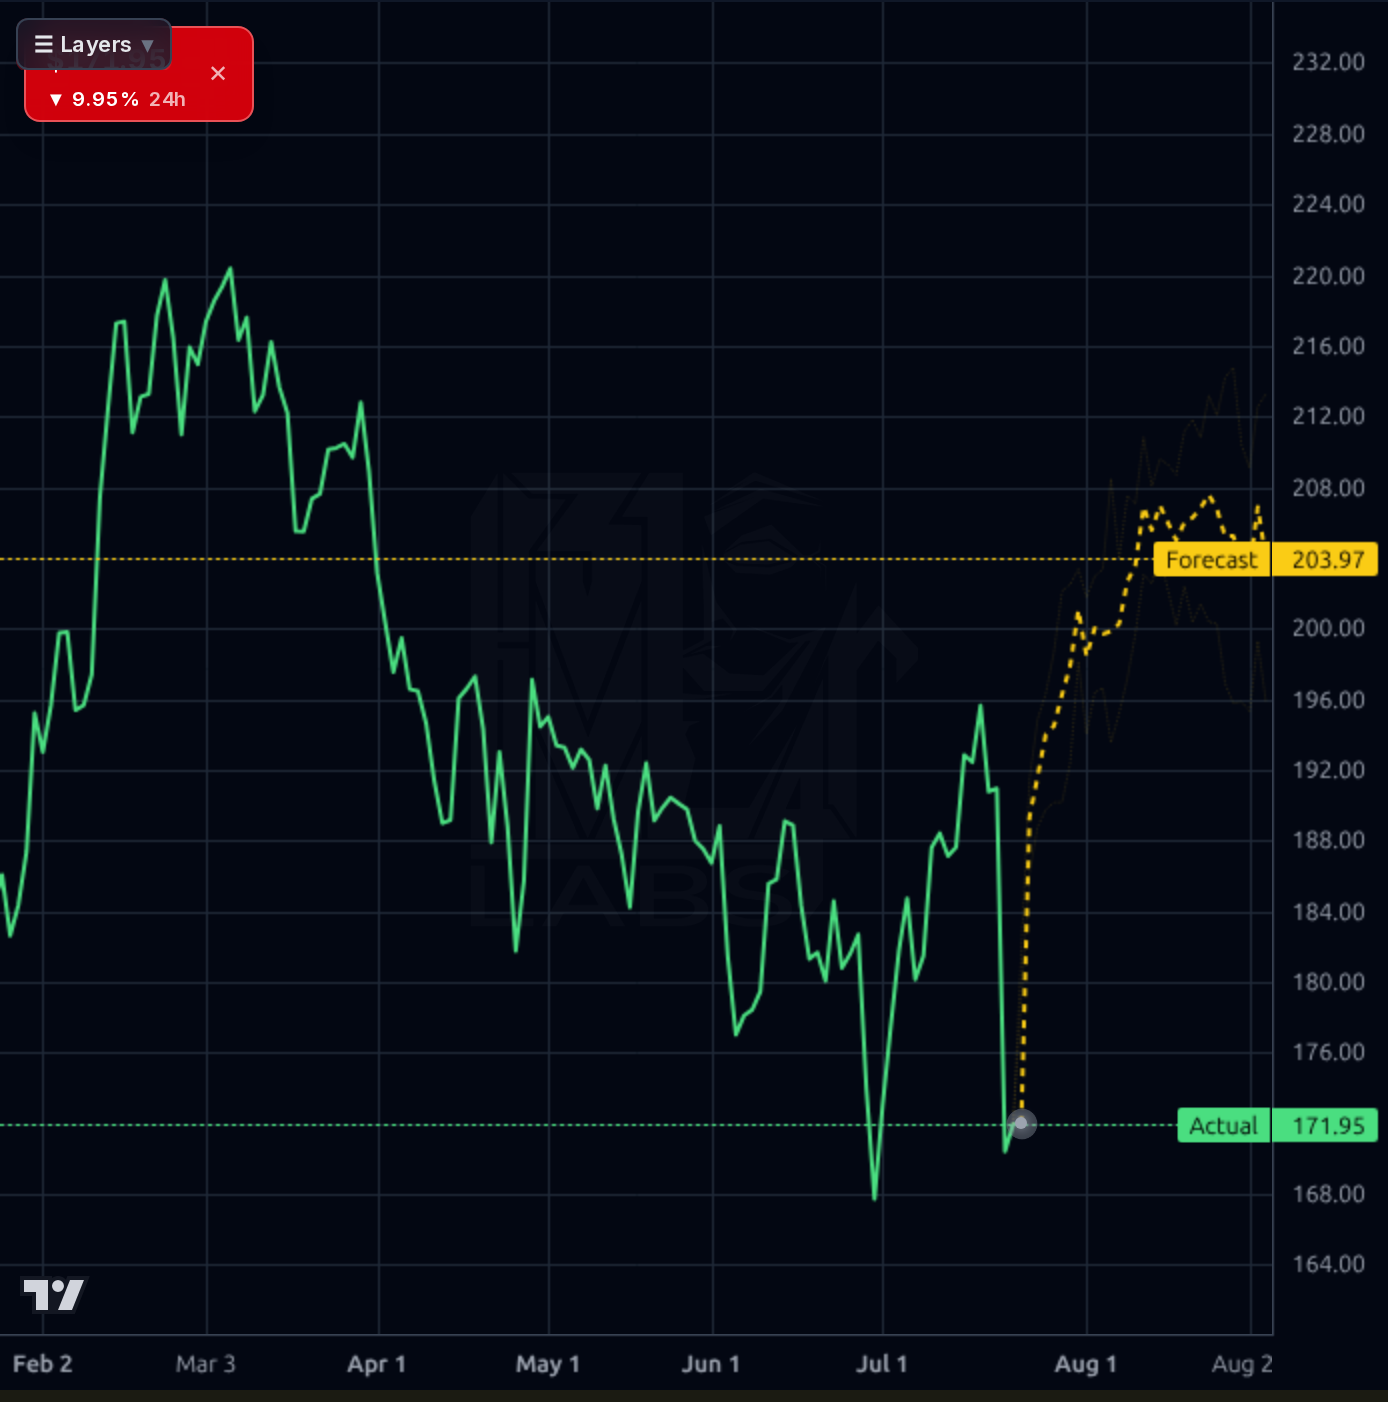
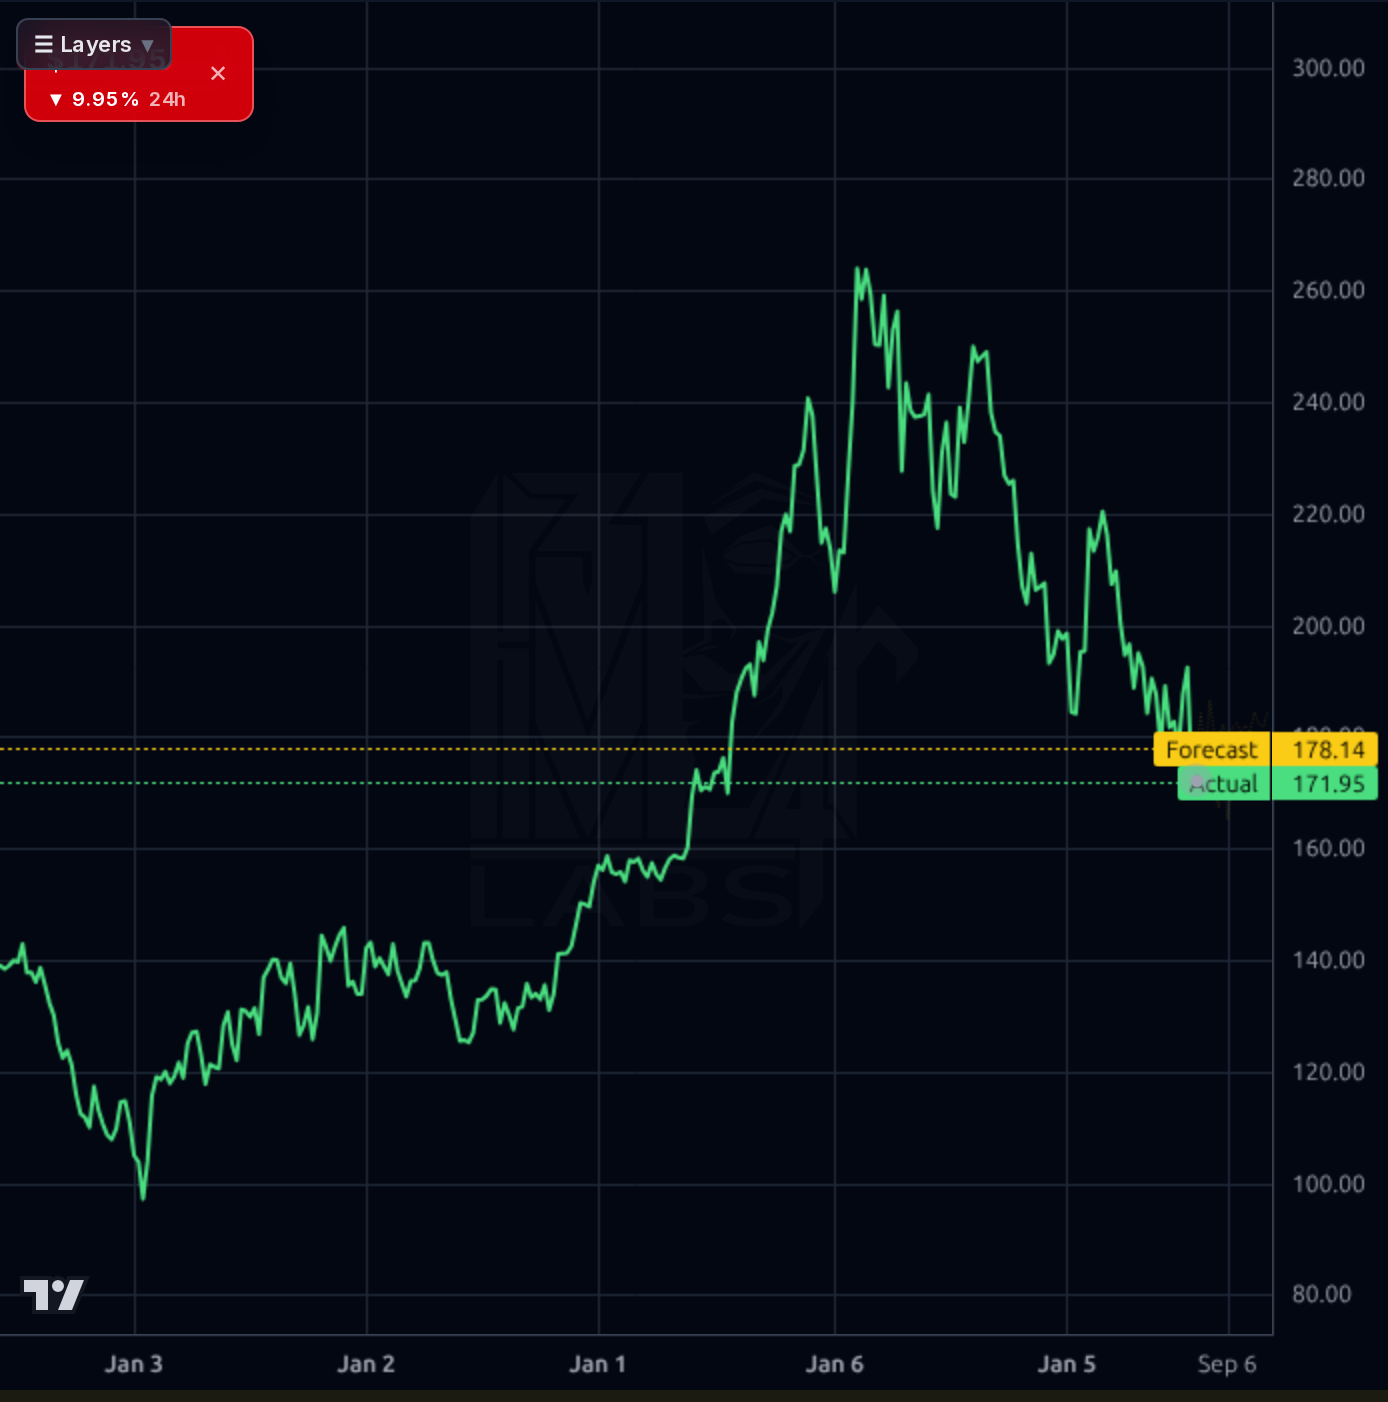
Across all four timeframes the setup is broken. On the 1D chart, price crashed from ~$192 to $170 in a single session (July 23 earnings), taking out the mid-July low near $170 and printing near 52-week low $165.66. On the 4H/1D charts, TMUS is in a clear multi-month downtrend from the March highs near $220, with lower highs at $196 and $192, and price now -15% below the 200DMA and -7.9% below the 50DMA. RSI at 36.3 is oversold but not washed out. The weekly chart shows a peak near $265 with the stock now down ~35% from the 52-week high — a legitimate distribution top, not just noise. Kronos forecasts modest mean-reversion bounces on the 1H (to ~$190) and 4H (to ~$198), but the accuracy panel shows the model was BEATEN by the naive baseline on both 1D (76% vs 78%) and 1wk (33% vs 83%) horizons in this regime, so those bullish tilts should be heavily discounted. First support is the 52-week low $165.66; below that opens $158-160. Resistance is the gap fill at $190-192, then $196.
The dominant catalyst is the July 23 Q2'26 print: EPS beat, revenue slight miss, raised full-year FCF guidance, and $2.5B in buybacks — yet the stock fell 10.75% for its worst week in six years. Goldman Sachs raised its target to $230 (implying ~35% upside from $170) and consensus target sits at $247.26 with a strong Recom of 1.43 — Street is not capitulating. Secondary noise: SpaceX/ASTS satellite competition fears (the same fear pressuring Verizon), and T-Mobile itself framing satellite as complementary/'table stakes.' The July 7 8-K noted a new Chief Enterprise Officer and reorganization — a modest strategic signal toward enterprise growth. Congressional trade is a trivial small sell from March. Retail sentiment is 67% bullish on light volume — mildly contrarian-supportive but not decisive. Signal: earnings reset was real (growth deceleration + satellite overhang); noise: analyst posture and buyback commitment argue the sell-off is overdone.
- Raised FY2026 free cash flow guidance disclosed in July 23 8-K despite revenue miss
- July 7 8-K: new Chief Enterprise Officer + reorg to accelerate B2B/enterprise segment
- Buyback pace of $2.5B/quarter (13.25M shares last tranche) is EPS-accretive at $170
- Forward EPS growth 29% next year / 19.85% 5Y consensus supports the PEG 0.63 valuation
- Satellite (SpaceX/ASTS) reframed by TMUS as complementary 'table stakes' — potential upside optionality
- Mint Mobile + Metro prepaid brands provide down-trade capture in weakening consumer environment
- Q1'26 operating margin compressed to 19.5% from 24.7% in Q2'25 — margin trajectory is the key bear case
- Total debt $121B vs $3.5B cash and Debt/Eq 2.17 — refinancing risk if rates stay elevated
- Direct-to-cell satellite competition (SpaceX/ASTS) is a genuine long-tail structural threat to telecom moats
- Stock is -27% YoY and -16% YTD — technical downtrend intact, no confirmed reversal yet
- Kronos model beaten by naive baseline on both 1D and 1wk in this regime — model's bullish signal is unreliable here
- SPY market regime shows deteriorating breadth (49.6% >200DMA) — high-beta reversions can extend further than expected
- Revenue growth decelerating (Sales past 3Y only 3.53%) despite recent 9.5% TTM print — sustainability question
- Dividend payout ratio 37.7% + heavy buyback + heavy capex leaves limited cushion if FCF disappoints
Get AI analysis on any stock
This is one of hundreds of Kronos AI reports — scored fundamentals & technicals, bull/base/bear price targets, a multi-horizon plan, and continuously-updated forecasts across the market. Create a free account to explore them all.
Create your free account →Already a member? Sign in · Join our Discord