TMUS — AI Stock Forecast & Price Targets
Published 9/4/2026 · A free sample of K3vl4r’s AI-powered analysis.
Kronos price forecasts, scored fundamentals & technicals, and a multi-horizon plan.
View the live TMUS price forecast →
TMUS presents a compelling value proposition underpinned by strong cash flow generation and recent margin recovery (Q2'26 Op Margin: 24.1%), trading at an attractive forward P/E of 13.5x. The immediate technical breakout above $186 resistance suggests constructive momentum, but structural overhangs from Starlink and high debt limit multiple expansion potential. We recommend accumulating on pullbacks toward established support levels while awaiting confirmation of sustained margin strength.
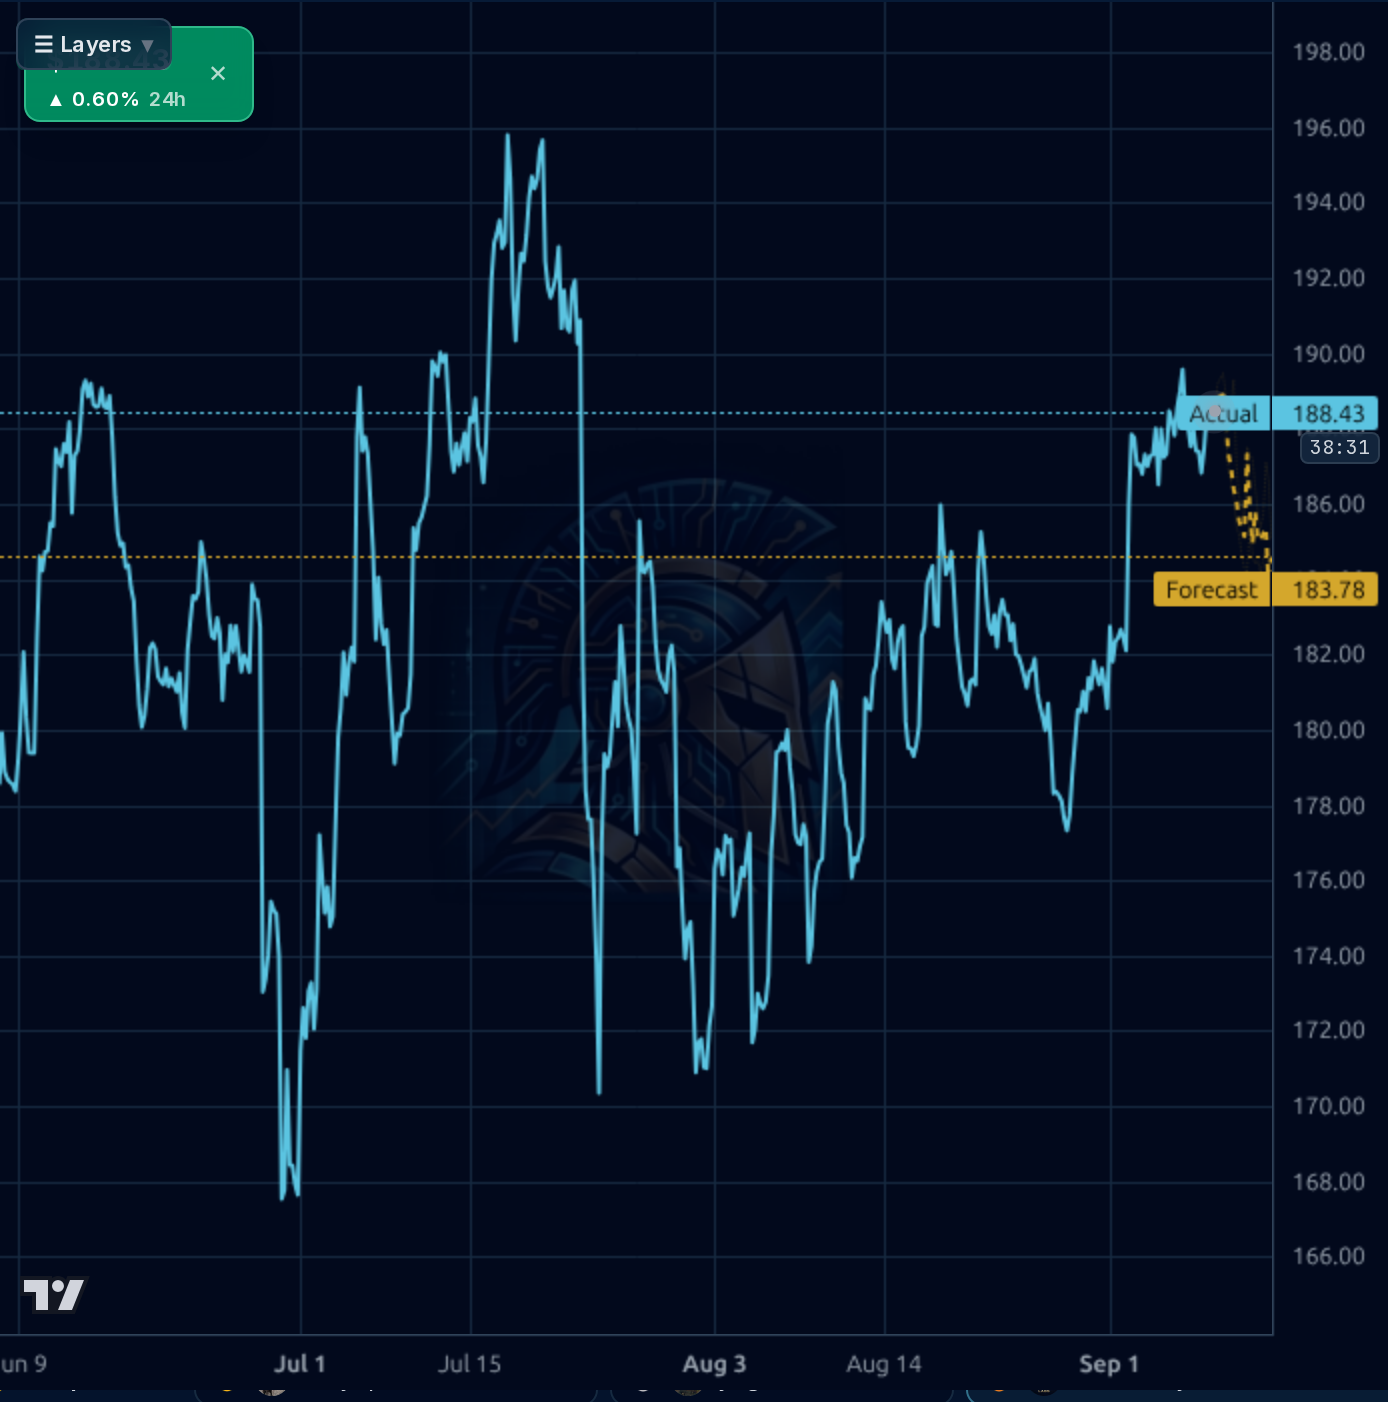
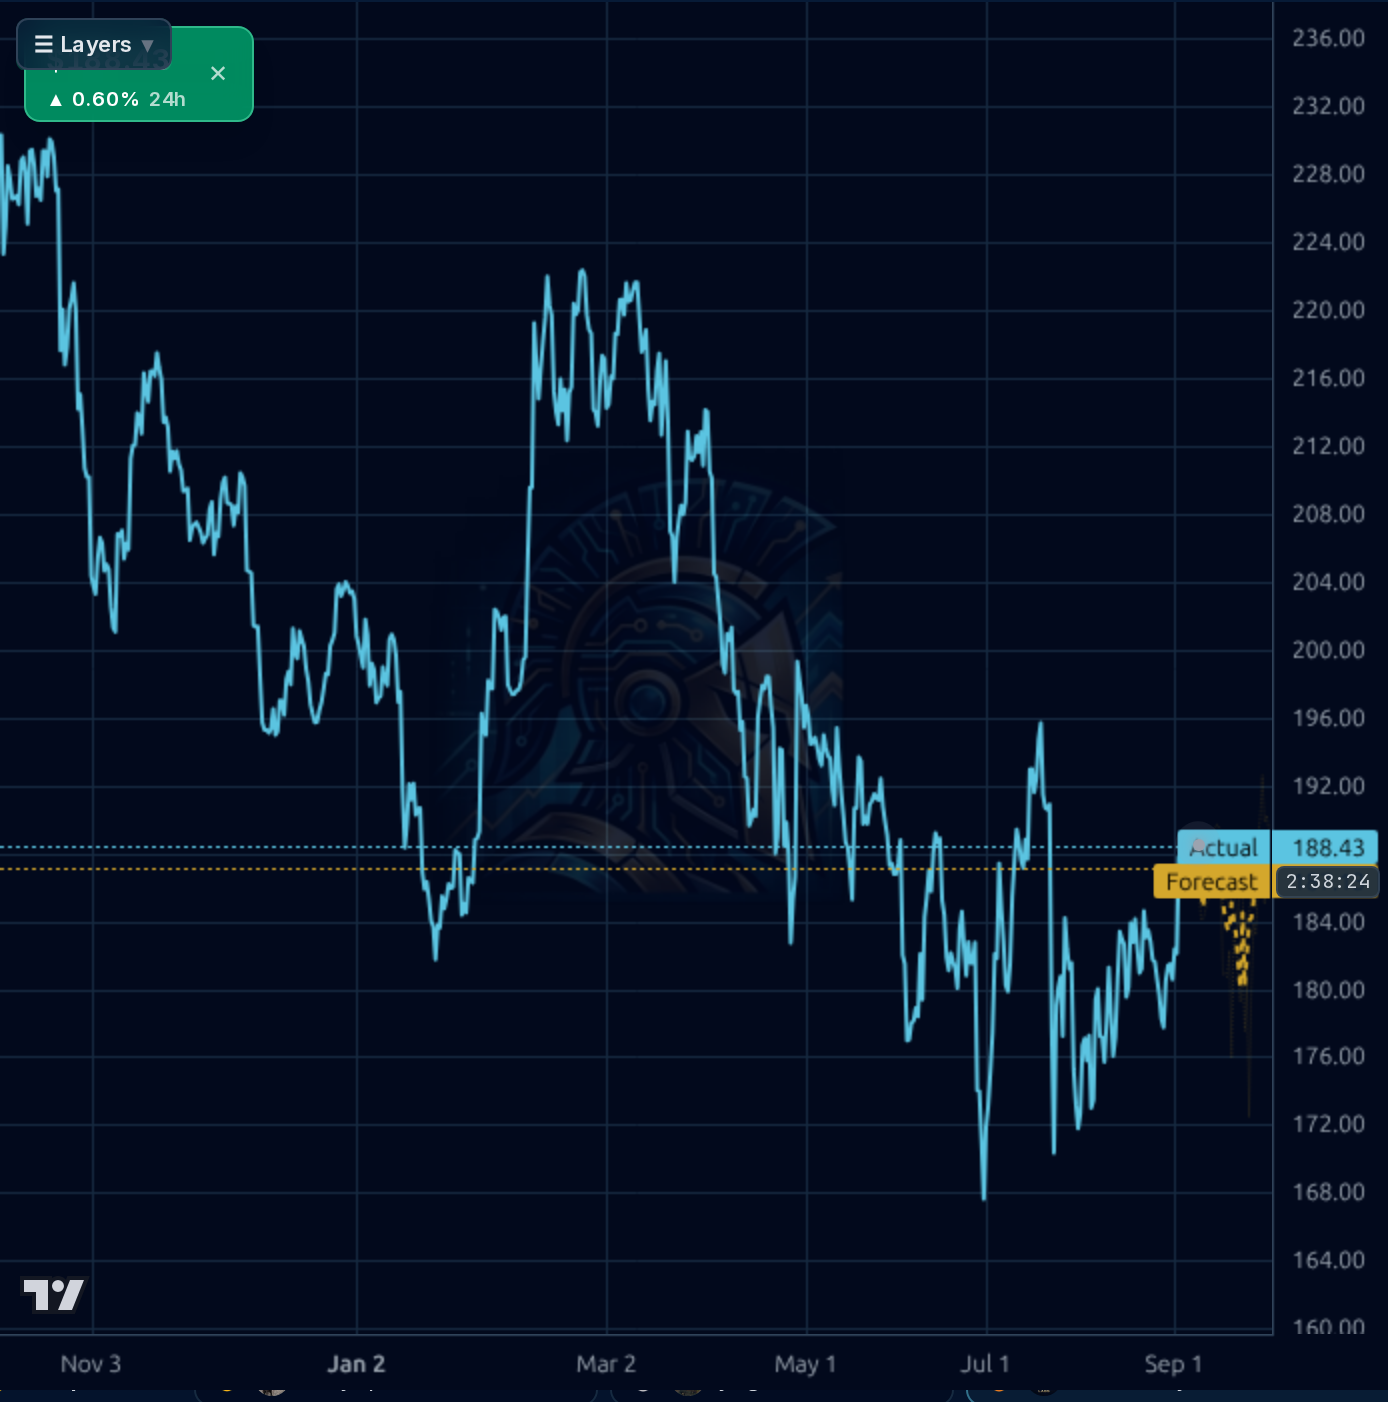
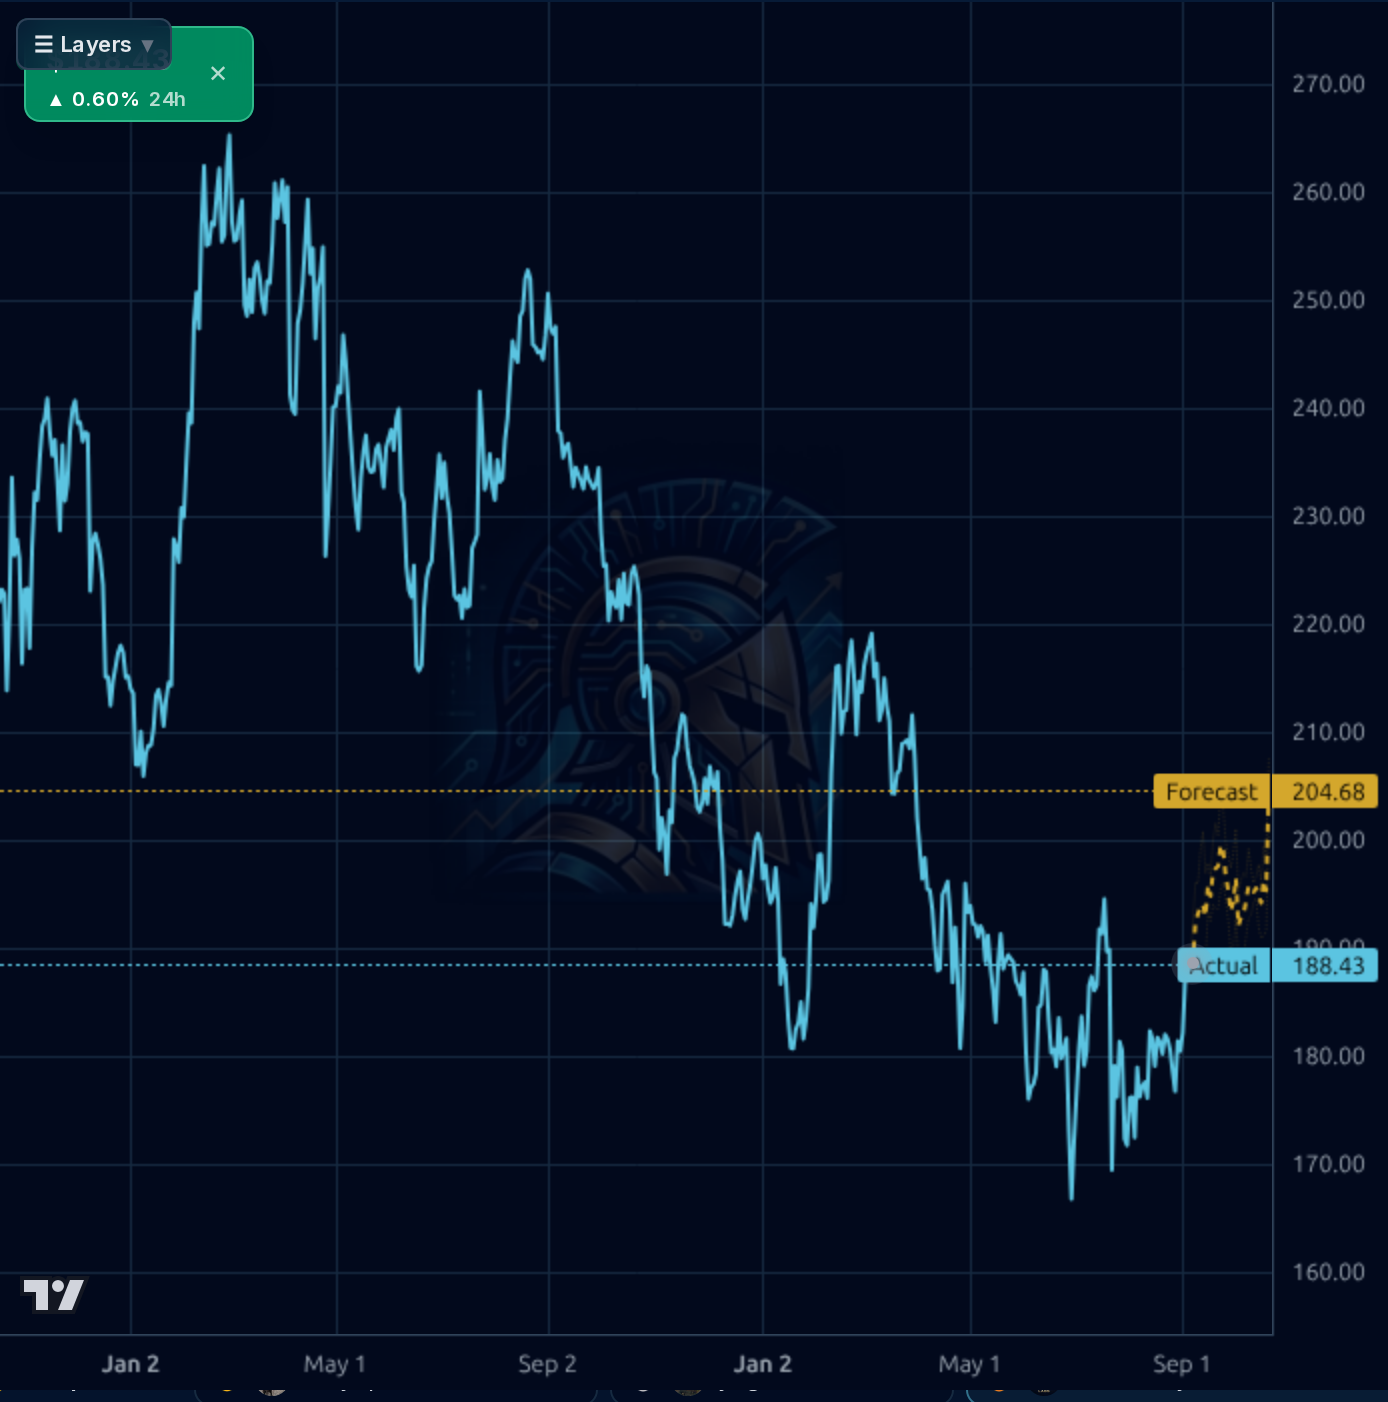
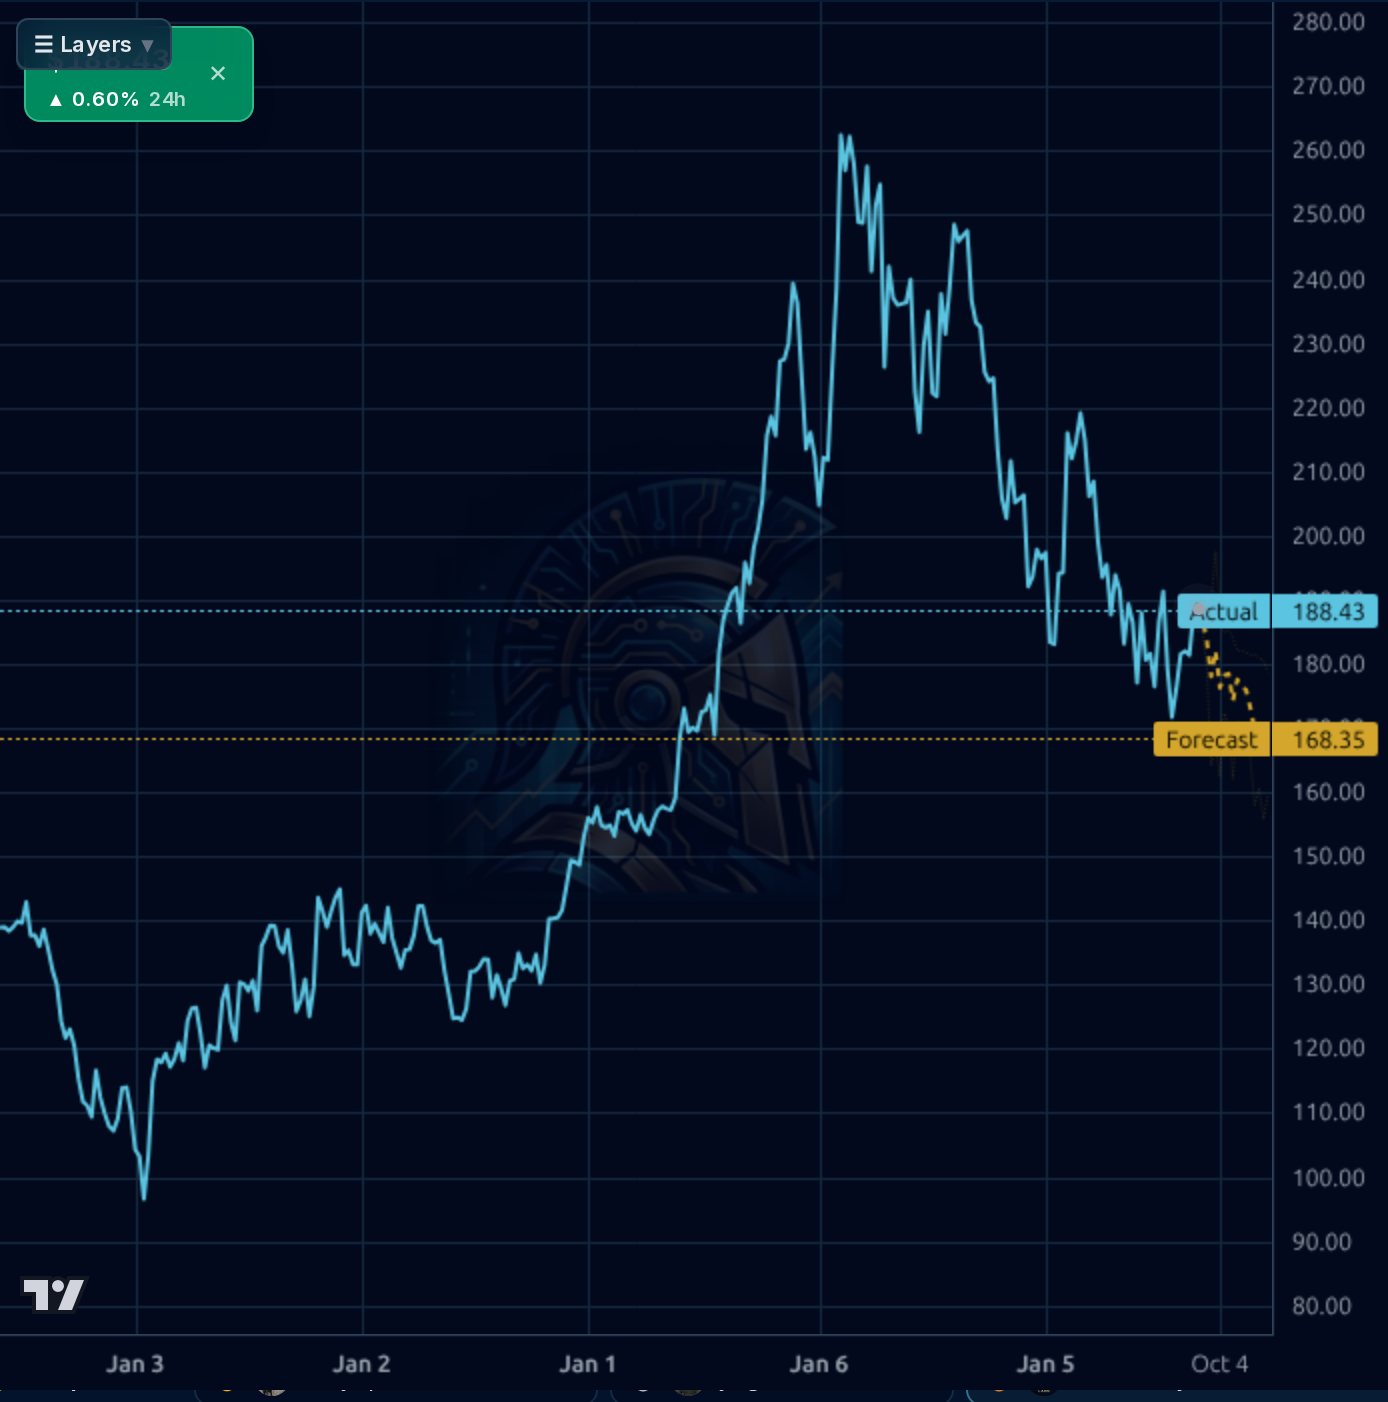
Accumulate on any pullback toward the $178-$182 support zone, treating this as a consolidation phase following the recent breakout above $186. Invalidation would be a sustained break below $172.
The thesis hinges on TMUS sustaining an operating margin of 23%+ through Q3'26 earnings (Oct 22). If this is confirmed, we expect the stock to test resistance levels toward $200-$210. A failure here suggests structural headwinds are outweighing operational improvements.
The long-term thesis remains value-driven based on best-in-class FCF generation funding dividends and buybacks. The biggest risk is the unquantified impact of Starlink/SpaceX, which could fundamentally alter market structure.
The company exhibits robust cash flow quality, with Free Cash Flow consistently above $3B in the last four quarters and operating cash flow around $7-8B recently. The Q2'26 results showed an operating margin of 24.1% on $22.8B revenue, representing a significant recovery from prior periods. Balance sheet strength is mixed; while total assets are substantial ($213B in Q2'26), the high total debt ($119B) and resulting Debt/Equity ratio (1.93) limit financial flexibility. Capital allocation remains strong due to consistent FCF generation, supporting dividends and buybacks.
The stock has shown clear upward momentum, breaking above key resistance levels like $186, as seen in the chart patterns. The model's forecast band suggests a current price of $188.02 with a target range that implies upside potential towards the $241.22 analyst target. However, the recent 1-week forecast shows low bullish probability (0.00), suggesting caution despite the daily momentum. Key support areas to watch are near the $172-$178 zone, which aligns with prior analysis and historical consolidation patterns.
The primary news catalyst is T-Mobile's planned CFO transition in early 2027 (Osvaldik to Uhl), which introduces minor execution uncertainty. More significant are the external competitive narratives: activist investor Elliott targeting Deutsche Telekom, and the persistent structural overhang from SpaceX/Starlink direct-to-cell services. The news flow is dominated by macro telecom dynamics rather than immediate operational catalysts for TMUS itself.
- FWA broadband expansion into fiber-underserved markets continues to drive net adds and ARPU mix uplift.
- Prepaid consolidation (Metro + Mint) allows TMUS to capture trade-down share in a higher-rate economic environment.
- Structural overhang from SpaceX/Starlink direct-to-cell competition remains unquantified and poses the largest multiple risk.
- High debt load ($119B) limits financial maneuverability during potential rate shocks or spectrum auction losses.
- The CFO transition adds execution uncertainty to the margin recovery narrative heading into 2027.
Get AI analysis on any stock
This is one of hundreds of Kronos AI reports — scored fundamentals & technicals, bull/base/bear price targets, a multi-horizon plan, and continuously-updated forecasts across the market. Create a free account to explore them all.
Create your free account →Already a member? Sign in · Join our Discord