
TOYO— AI Stock Forecast & Price Targets
Published 7/28/2026 · A free sample of K3vl4r’s AI-powered analysis.
Kronos price forecasts, scored fundamentals & technicals, and a multi-horizon plan.
View the live TOYO price forecast →
TOYO's extreme valuation (fwd P/E 1.45) and Q1'26 margin inflection (33.5%) create a compelling value case, but severe balance sheet fragility (current ratio 0.68, D/E 83.5) and binary earnings risk ahead dominate the thesis. The stock's technical structure is deeply oversold with short float unwinding from 63.9% to 24.6%, yet the $4.50-$5.00 support shelf remains critical for near-term viability.
Hold below $4.50; if price breaks above $4.50, consider small position entry (1-2% of portfolio) with stop-loss at $4.30. Invalidation is break below $3.88 52-week low or Q2'26 earnings miss on margin durability.
Accumulate if Q2'26 earnings confirm gross margins >25% and no dilutive capital raises; target $6.00 as base (current price +24%). Catalysts include US manufacturing buildout under IRA incentives, but failure to sustain margins risks triggering equity raises that invalidate current technical support.
Terminal value hinges on margin sustainability in a secular solar oversupply environment; long-term upside is capped by global ASP deflation and Chinese competition. The stock's small-cap structure amplifies volatility, making it suitable only for high-risk investors with strong conviction in the Q2'26 earnings print.
Revenue surged 141.5% YoY in Q1'26 ($142.8M) with gross margins expanding to 33.5%, driven by operational efficiency, but balance sheet fragility is severe: current ratio 0.68 and debt-to-equity 83.5 indicate high vulnerability to dilutive capital raises. Free cash flow turned positive in Q1'26 ($28.8M) but capex remains heavy (-$4.59M), and the $205.9M market cap trades at a forward P/E of 1.45 with negligible PEG (0.02). The Russell 3000 inclusion provides indexing exposure, yet margin durability is unproven given Q2'26's critical role in validating Q1'26's inflection.
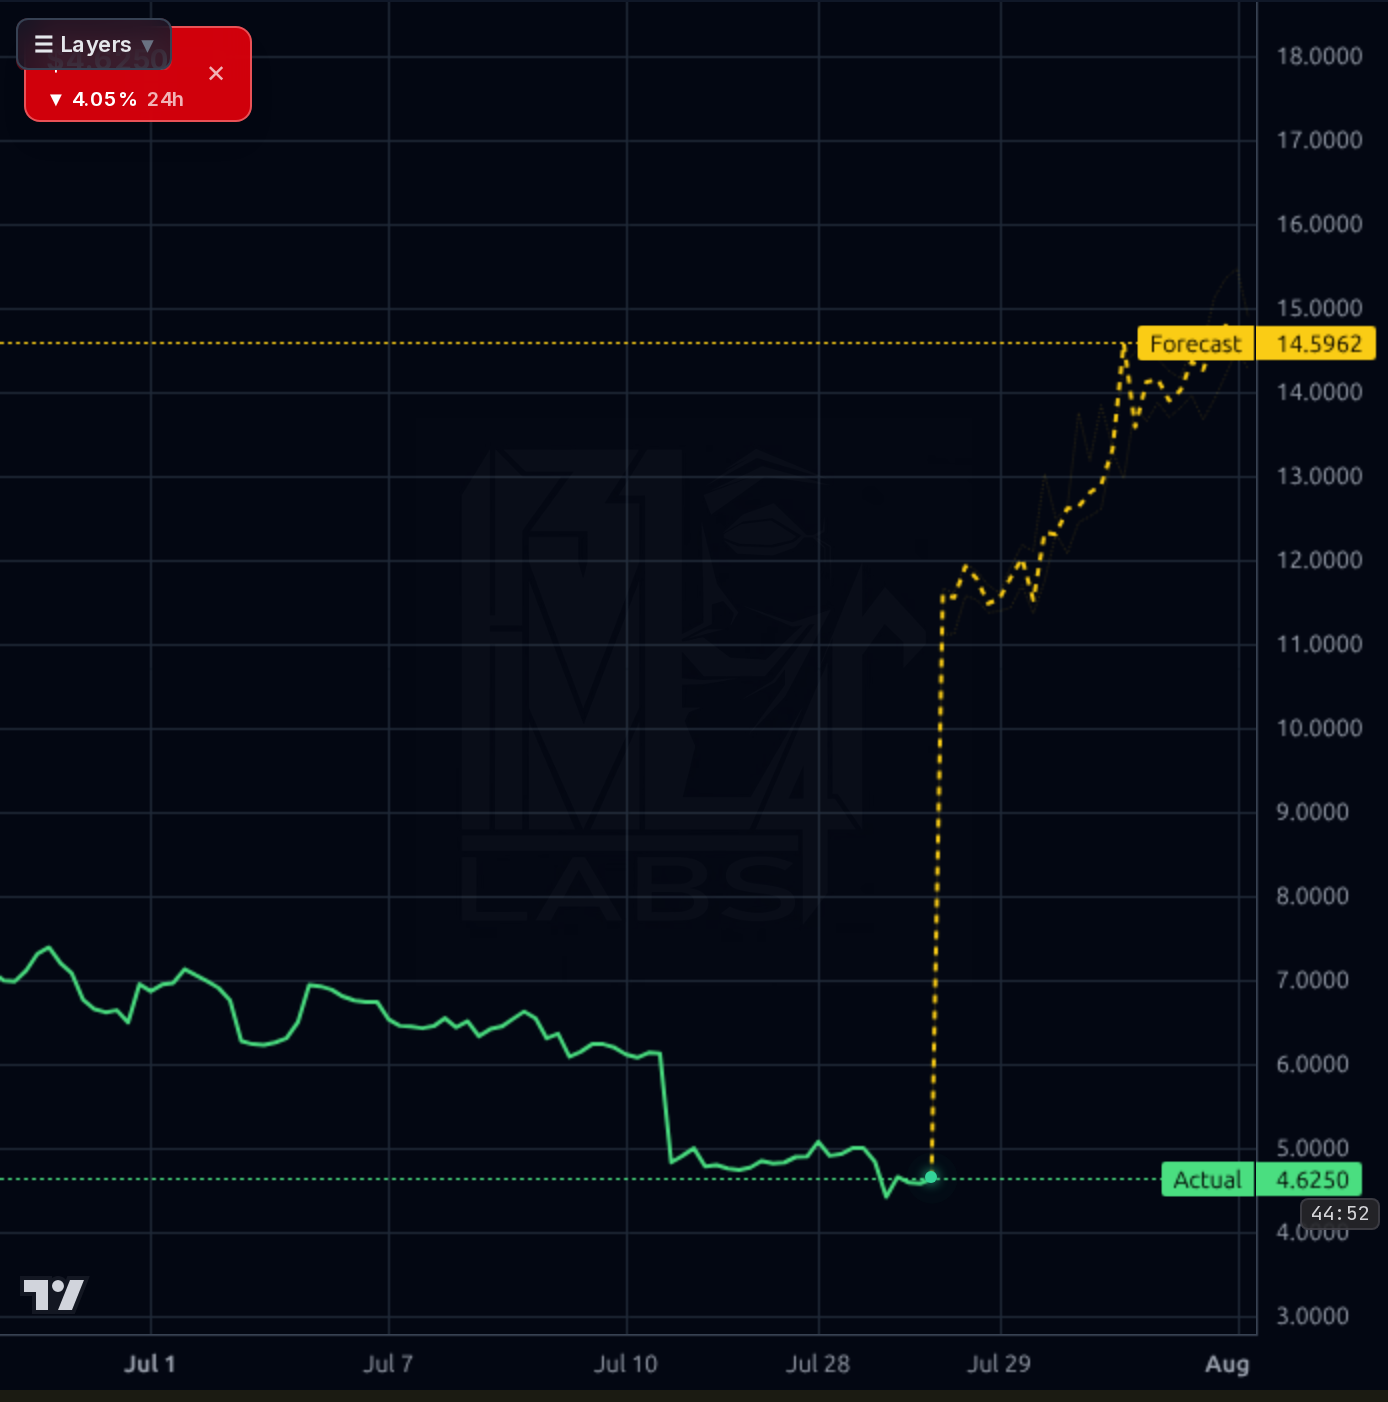
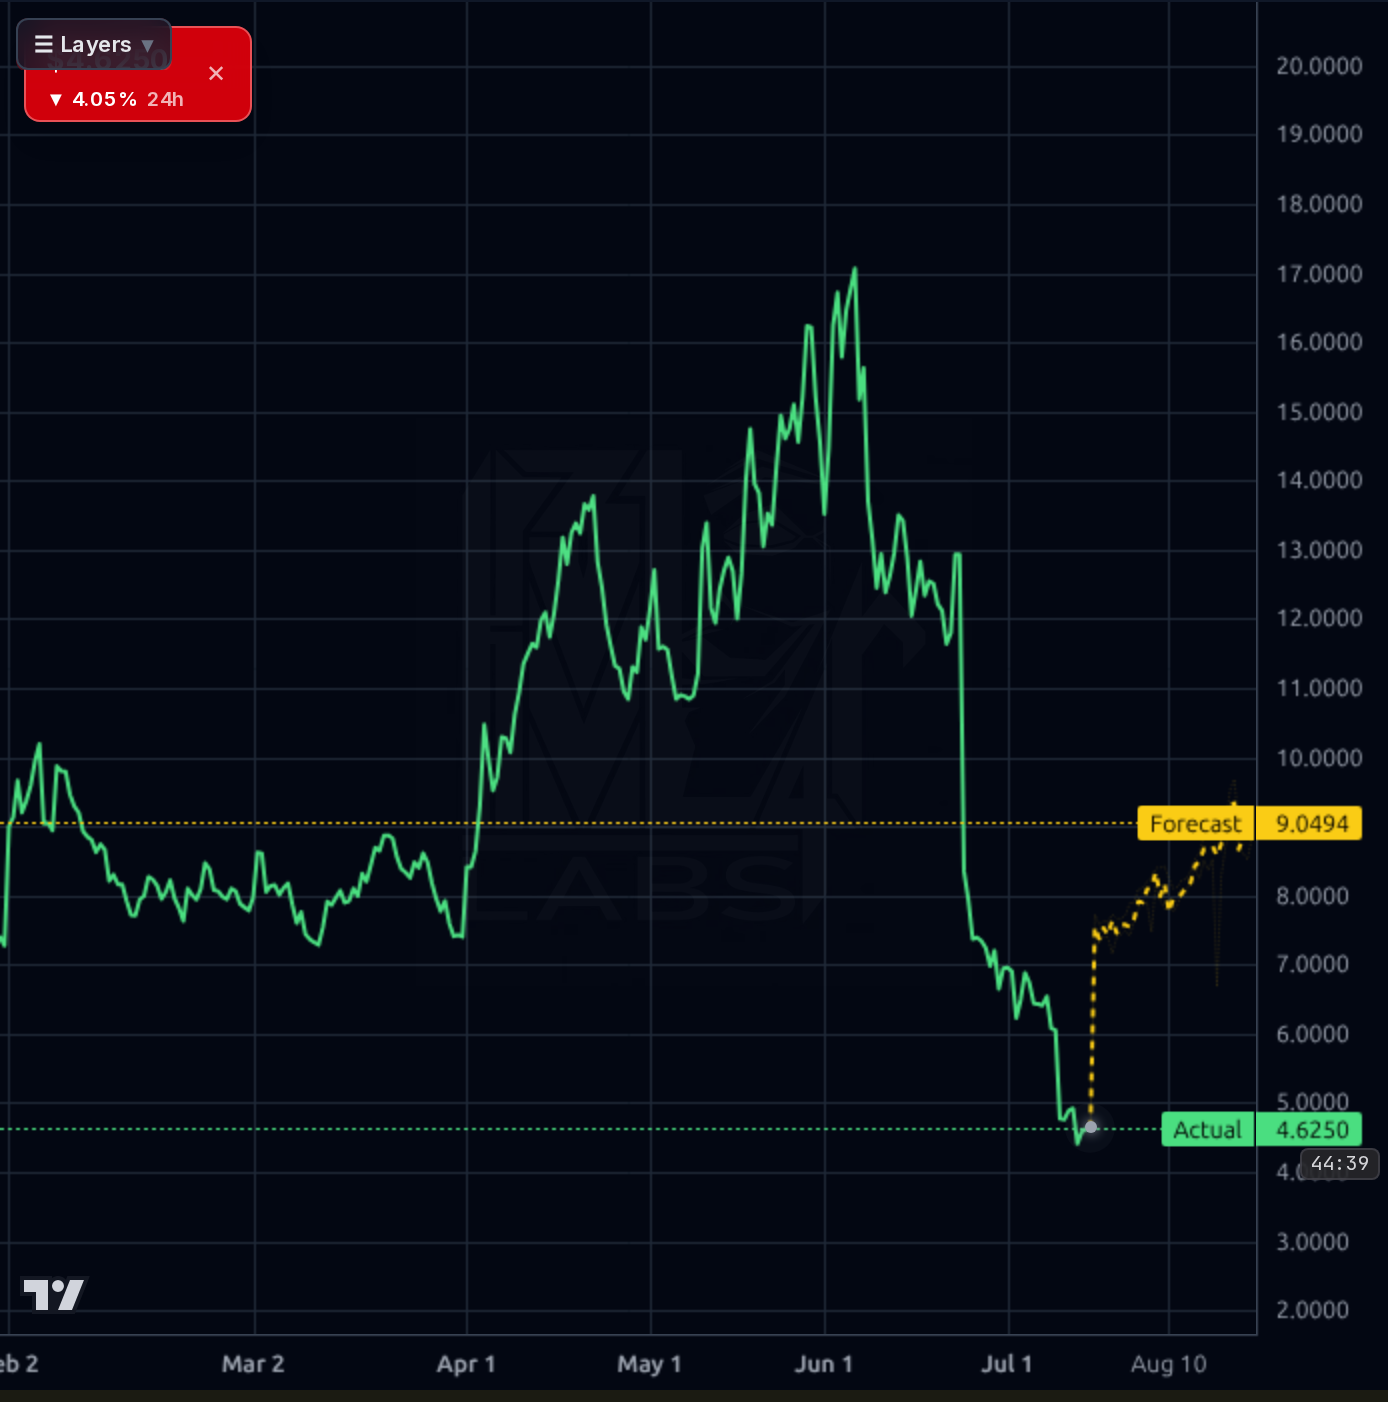
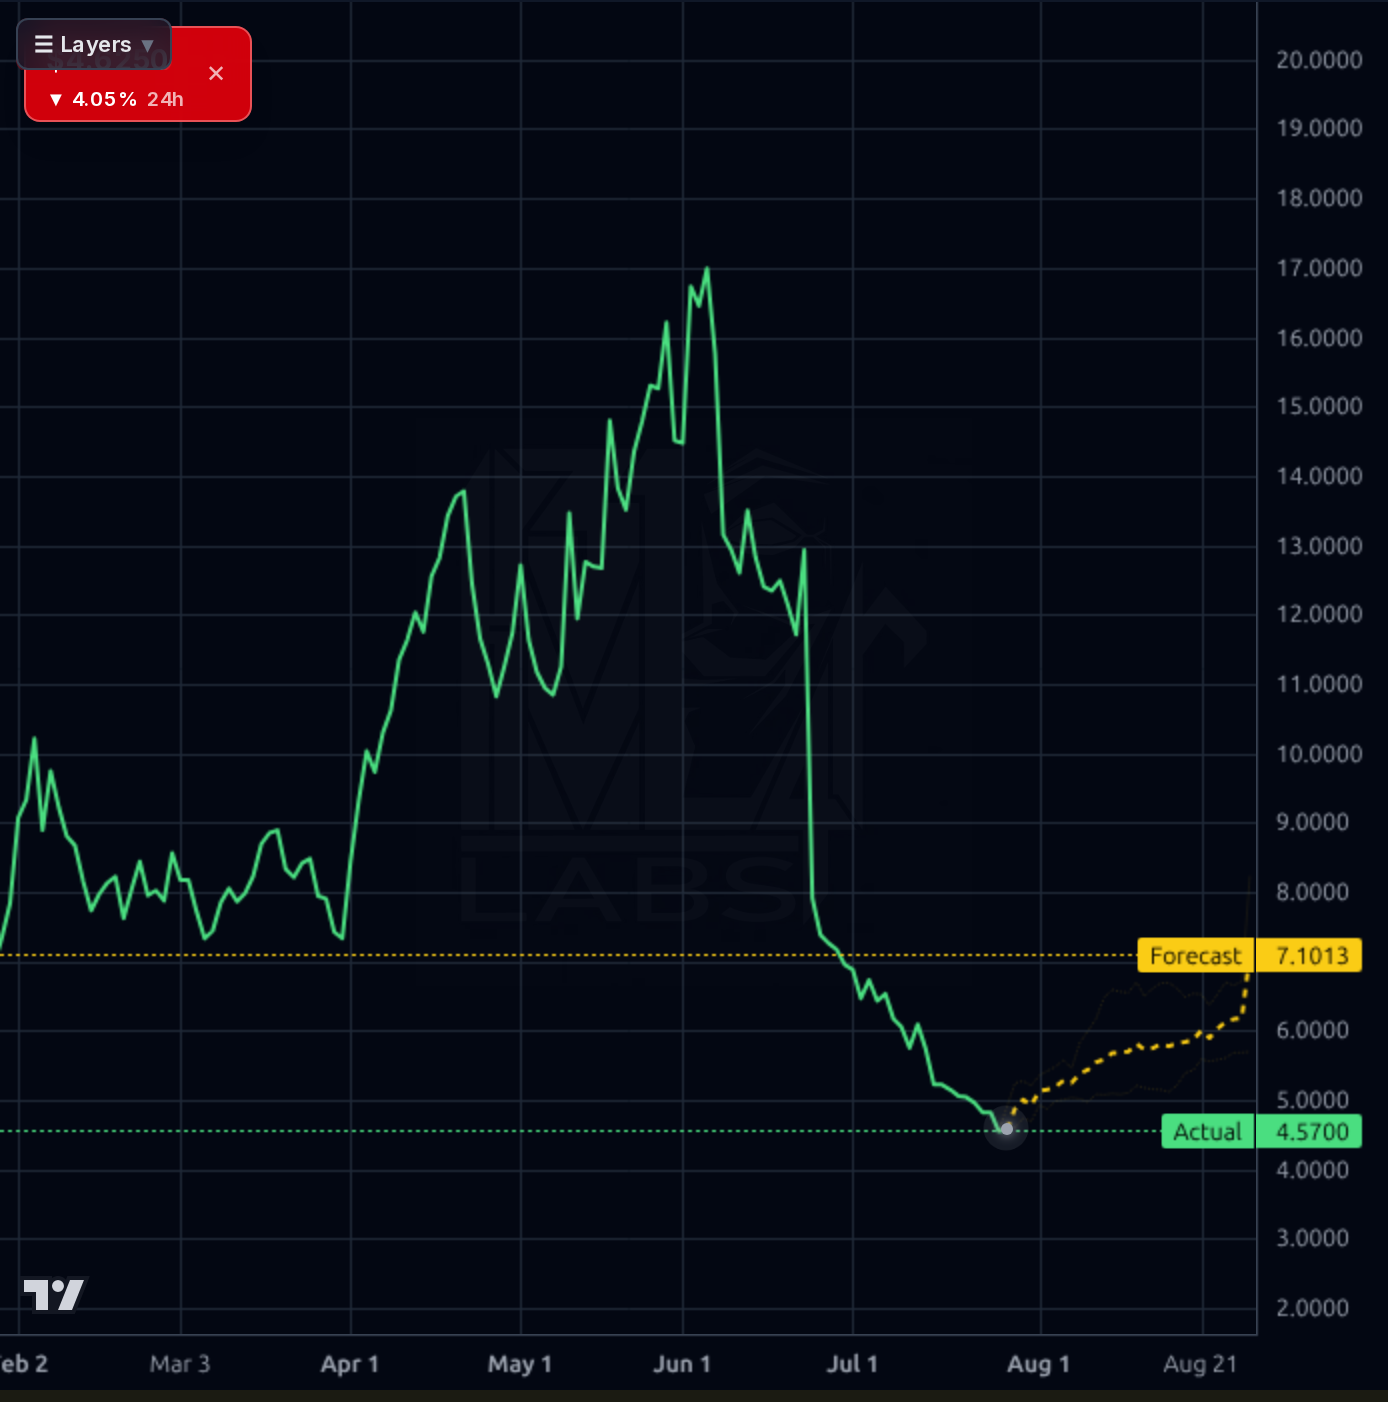
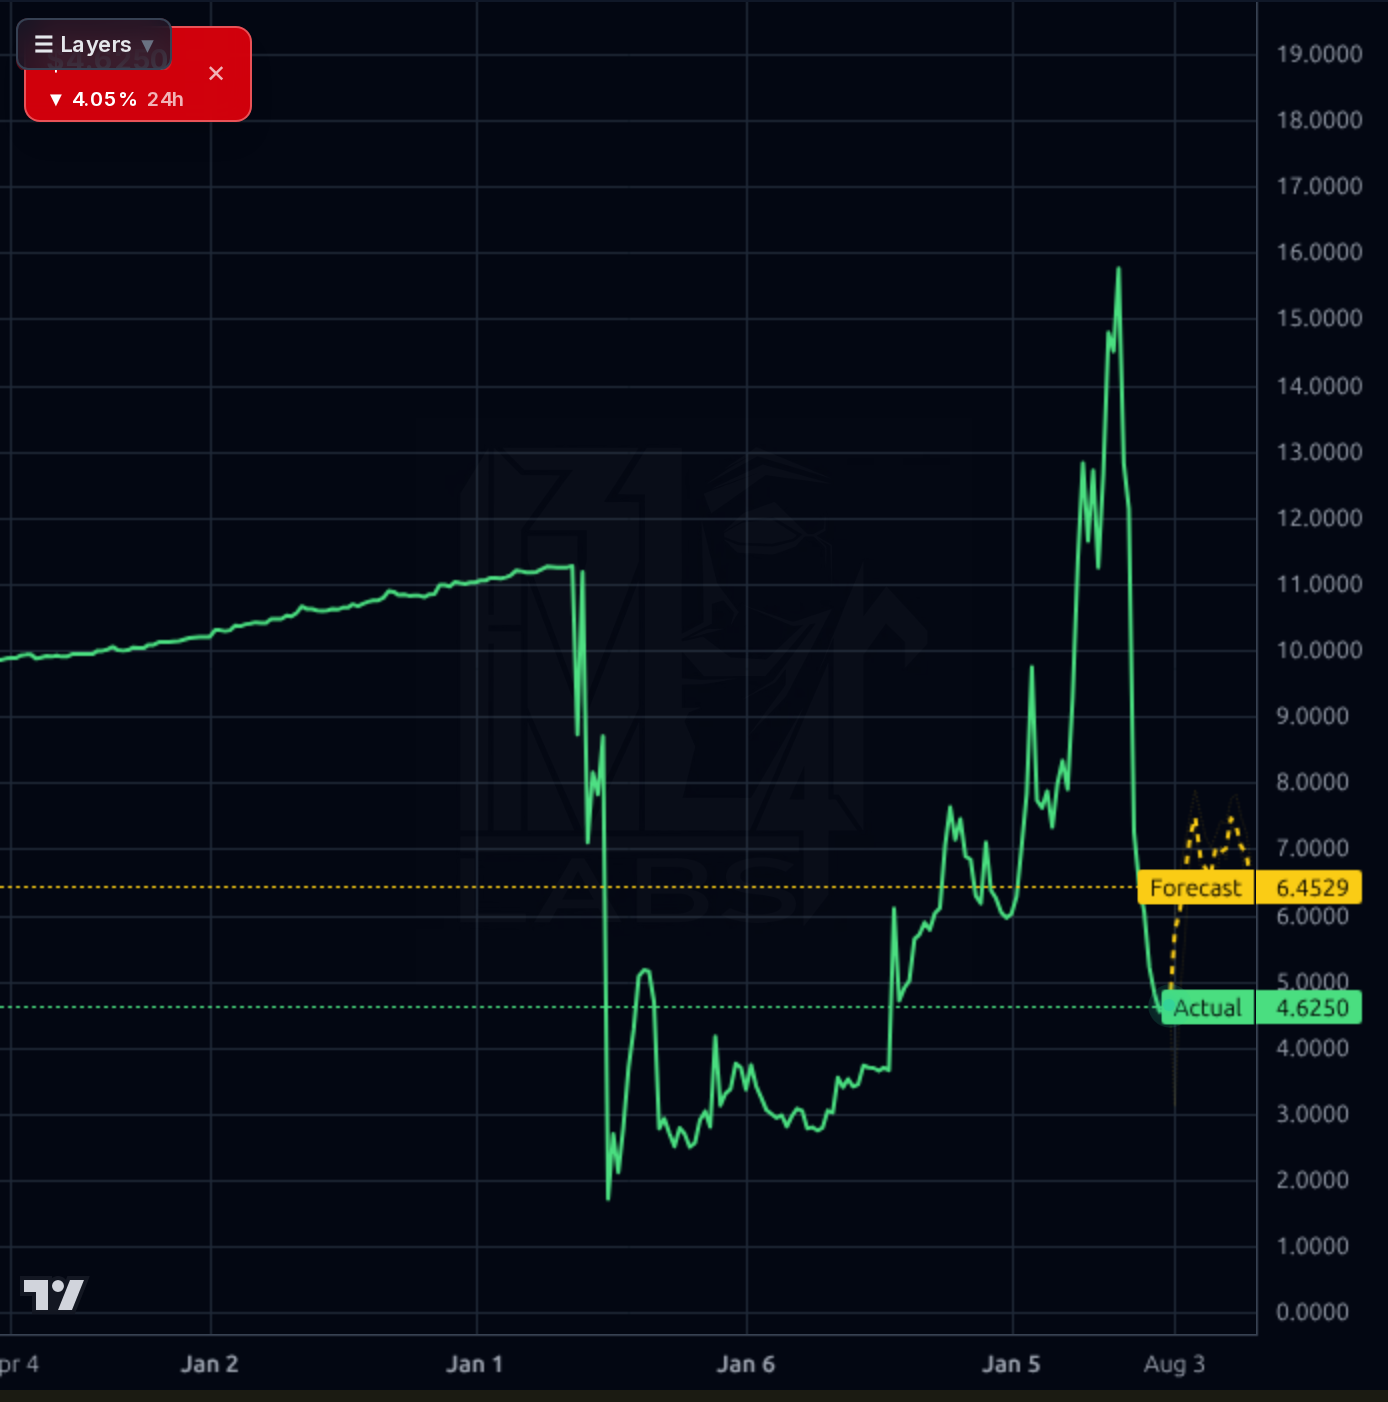
The chart shows a deep oversold condition with RSI at 24.5 and the price trading below both SMA20 (-17.8%) and SMA50 (-53.4%). The $4.50-$5.00 support shelf is critical, as prior collapses (e.g., from $17.43 to $3.88) suggest technical structure is fragile. Kronos AI's forecast band shows a narrow range ($4.57-$6.25), but the model's directional accuracy for 1d/1wk is poor (78% vs naive baseline), indicating high uncertainty. The recent short float unwinding from 63.9% to 24.6% suggests retail accumulation, yet the $3.88 52-week low remains a potential invalidation level.
The CFO appointment (Yasunari Harada) and Russell 3000 inclusion are positive catalysts for governance and indexing exposure, but they don't address core risks like margin durability or balance sheet fragility. The $4.82 current price is ~50% below the 52-week high ($17.43), reflecting extreme discounting despite strong Q1'26 metrics. Short float unwinding from 63.9% to 24.6% indicates retail accumulation, but the stock's technical structure remains fragile with $4.50-$5.00 as a critical support level.
- US manufacturing buildout under IRA incentives (announced in news) to drive capex growth
- Russell 3000 inclusion providing indexing exposure and liquidity access
- Binary Q2'26 earnings risk: Margin durability unproven, with prior quarter's 20.9% GM setting a low bar for confirmation
- Severe balance sheet fragility (current ratio 0.68) making the stock vulnerable to dilutive equity raises
- Secular industry headwinds from global solar ASP deflation and Chinese oversupply pressure capping terminal margins
Get AI analysis on any stock
This is one of hundreds of Kronos AI reports — scored fundamentals & technicals, bull/base/bear price targets, a multi-horizon plan, and continuously-updated forecasts across the market. Create a free account to explore them all.
Create your free account →Already a member? Sign in · Join our Discord