TOYO — AI Stock Forecast & Price Targets
Published 7/29/2026 · A free sample of K3vl4r’s AI-powered analysis.
Kronos price forecasts, scored fundamentals & technicals, and a multi-horizon plan.
View the live TOYO price forecast →
TOYO trades at $4.63 with extreme value optics (fwd P/E ~1.4, PEG 0.02, P/S 0.46) after a ~73% drawdown from $17.43, but the entire thesis now hinges on the August 17th Q2'26 print validating the Q1'26 margin inflection (GM 33.5%, net income $28.4M). Technicals remain deeply oversold (RSI 23.5, -54% vs SMA50) with short float unwound from 63.9% to 24.2%, yet the $4.50 shelf is being pressure-tested and balance sheet fragility (current ratio 0.68) leaves the stock highly exposed to another dilutive raise funding the $357M Houston HJT buildout.
Do not size a swing trade into the August 17 print — this is a binary catalyst 19 days out. If holding, treat $4.40 as the last-line support; a decisive break targets the $3.88 52-week low. Nibble-size starter positions ($4.40-$4.65) are defensible for those willing to underwrite earnings risk, but keep total exposure to a fraction of what you'd risk on a non-binary name. Invalidation: any 8-K signaling equity financing before earnings, or a close below $4.20 on volume. Do not chase into strength above $5.20 pre-print — the model's aggressive upside forecasts have historically failed to print here.
The 1-6 month view is a coin-flip weighted by the Q2'26 gross margin outcome. If GM prints >25% and management provides clarity on Houston financing without a massive equity raise, a re-rating toward $6.50-$8.00 is plausible (still deeply discounted vs 2026 EPS guide implying $2.40+). If GM reverts toward 20% or another dilutive placement is announced, the stock likely retests $3.88 and could break lower. Base case: $6.00 in 6 months, reflecting some margin confirmation plus continued dilution overhang. Mind-changer: proof of non-dilutive Houston financing (project finance, tax equity, Japanese parent support) would unlock meaningful upside.
The 1-3 year terminal thesis rests on whether TOYO can execute the transition from a Southeast Asian cell/module assembler to a vertically integrated US HJT manufacturer capturing 45X credits and premium domestic content pricing. If executed, revenue could scale toward $1B+ with sustainable mid-teens net margins, supporting a $12-18 stock even at conservative multiples. The biggest structural risk is Chinese solar oversupply crushing global ASPs before Houston reaches full capacity, combined with the near-certainty that reaching that end-state requires substantially more equity dilution at depressed prices — long-term holders should assume 30-50% additional share issuance in modeling upside.
The income statement shows a genuine inflection: Q1'26 revenue of $142.8M (+177% YoY) with gross margin expanding to 33.5% and net income of $28.4M vs a -$3.3M loss in Q1'25. TTM revenue of $518.6M, ROE of 69.5% and operating margin of 25.4% look extraordinary at a market cap of just $198M (fwd P/E 1.19-1.39, EV/EBITDA 2.67, P/S 0.46). Cash flow is corroborating — Q1'26 operating cash flow of $33.4M and FCF of $28.8M represent a real swing from Q1'25's -$12.3M FCF. However, the balance sheet is the Achilles heel: current ratio 0.68, quick ratio 0.31, working capital -$97M, and D/E at 83.5% on the fundamentals feed (Finviz reports 0.84 — the discrepancy itself is a red flag). Cash of $54.4M vs $116.8M total debt and a $357M Houston capex commitment implies more equity financing is coming — the June $50M raise at $11 already burned holders, and management just tapped again at lower levels. Capital allocation is essentially a bet-the-company US manufacturing pivot backed by Section 45X credits (up to $60M at full capacity), which is either transformative or a solvency risk depending on execution.
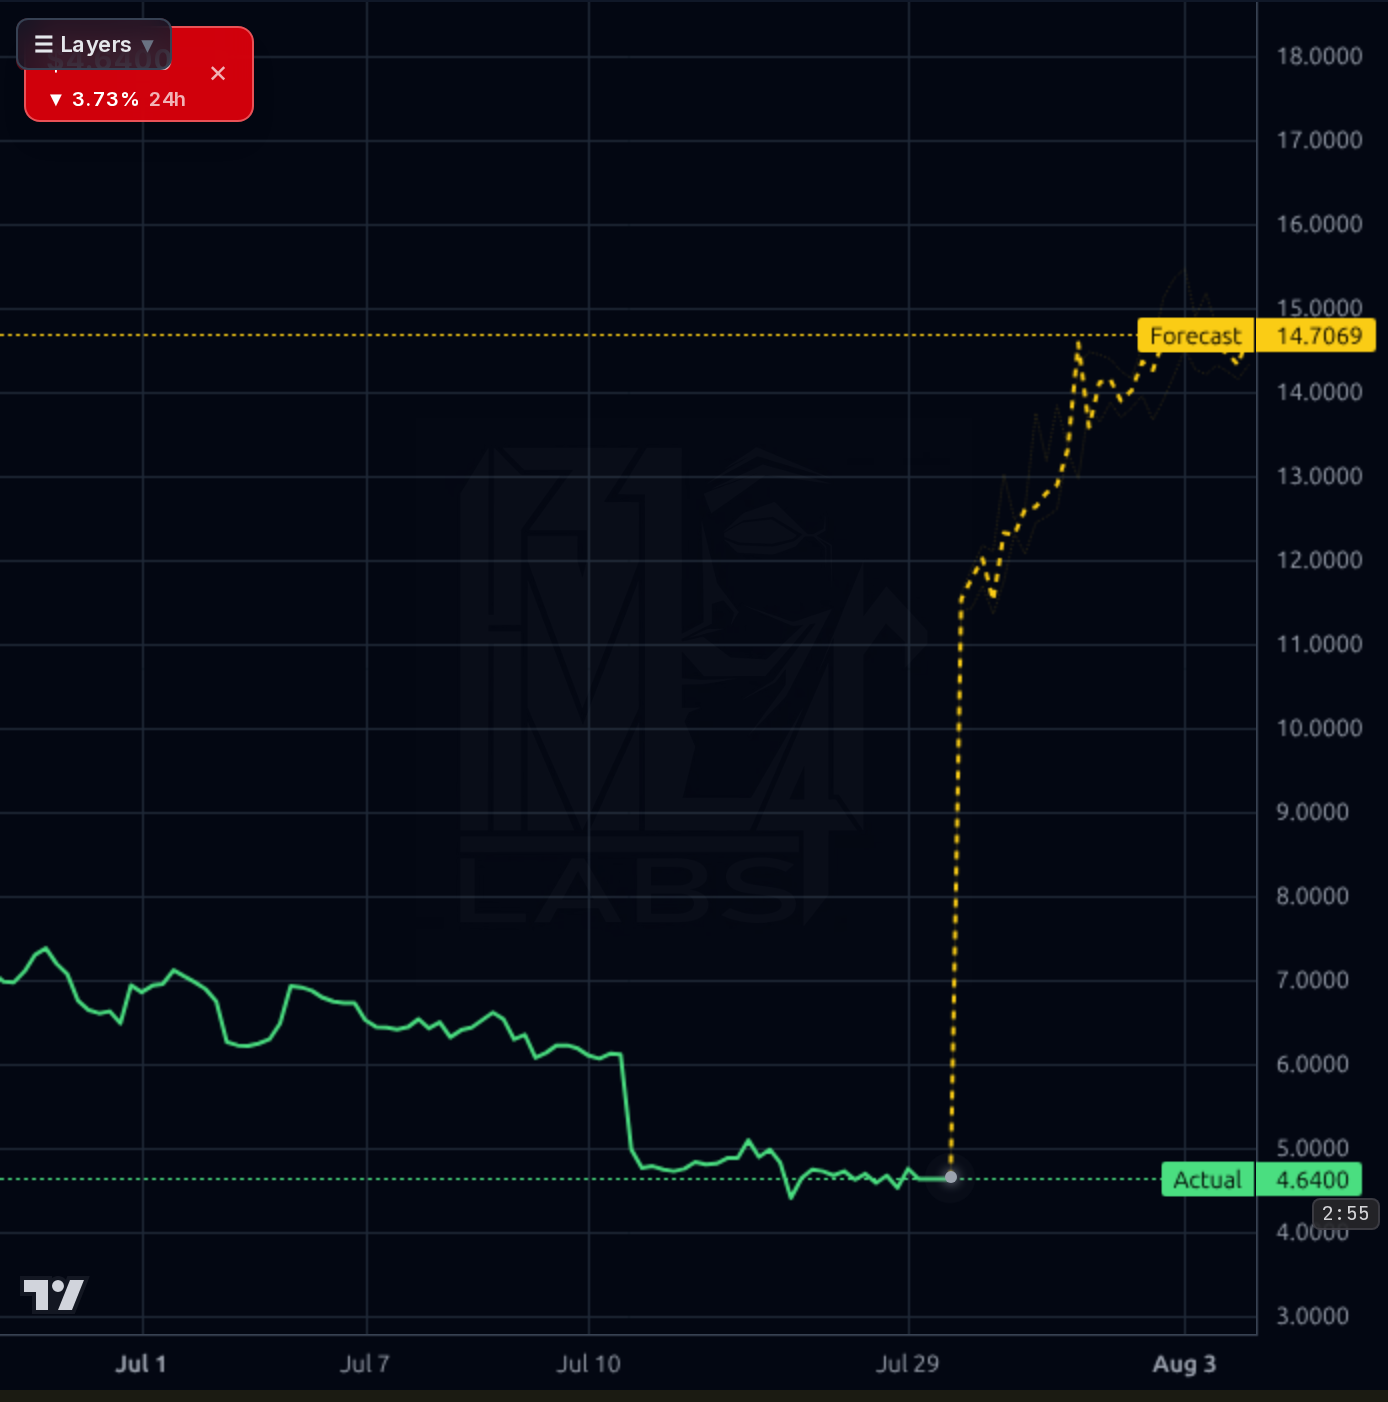
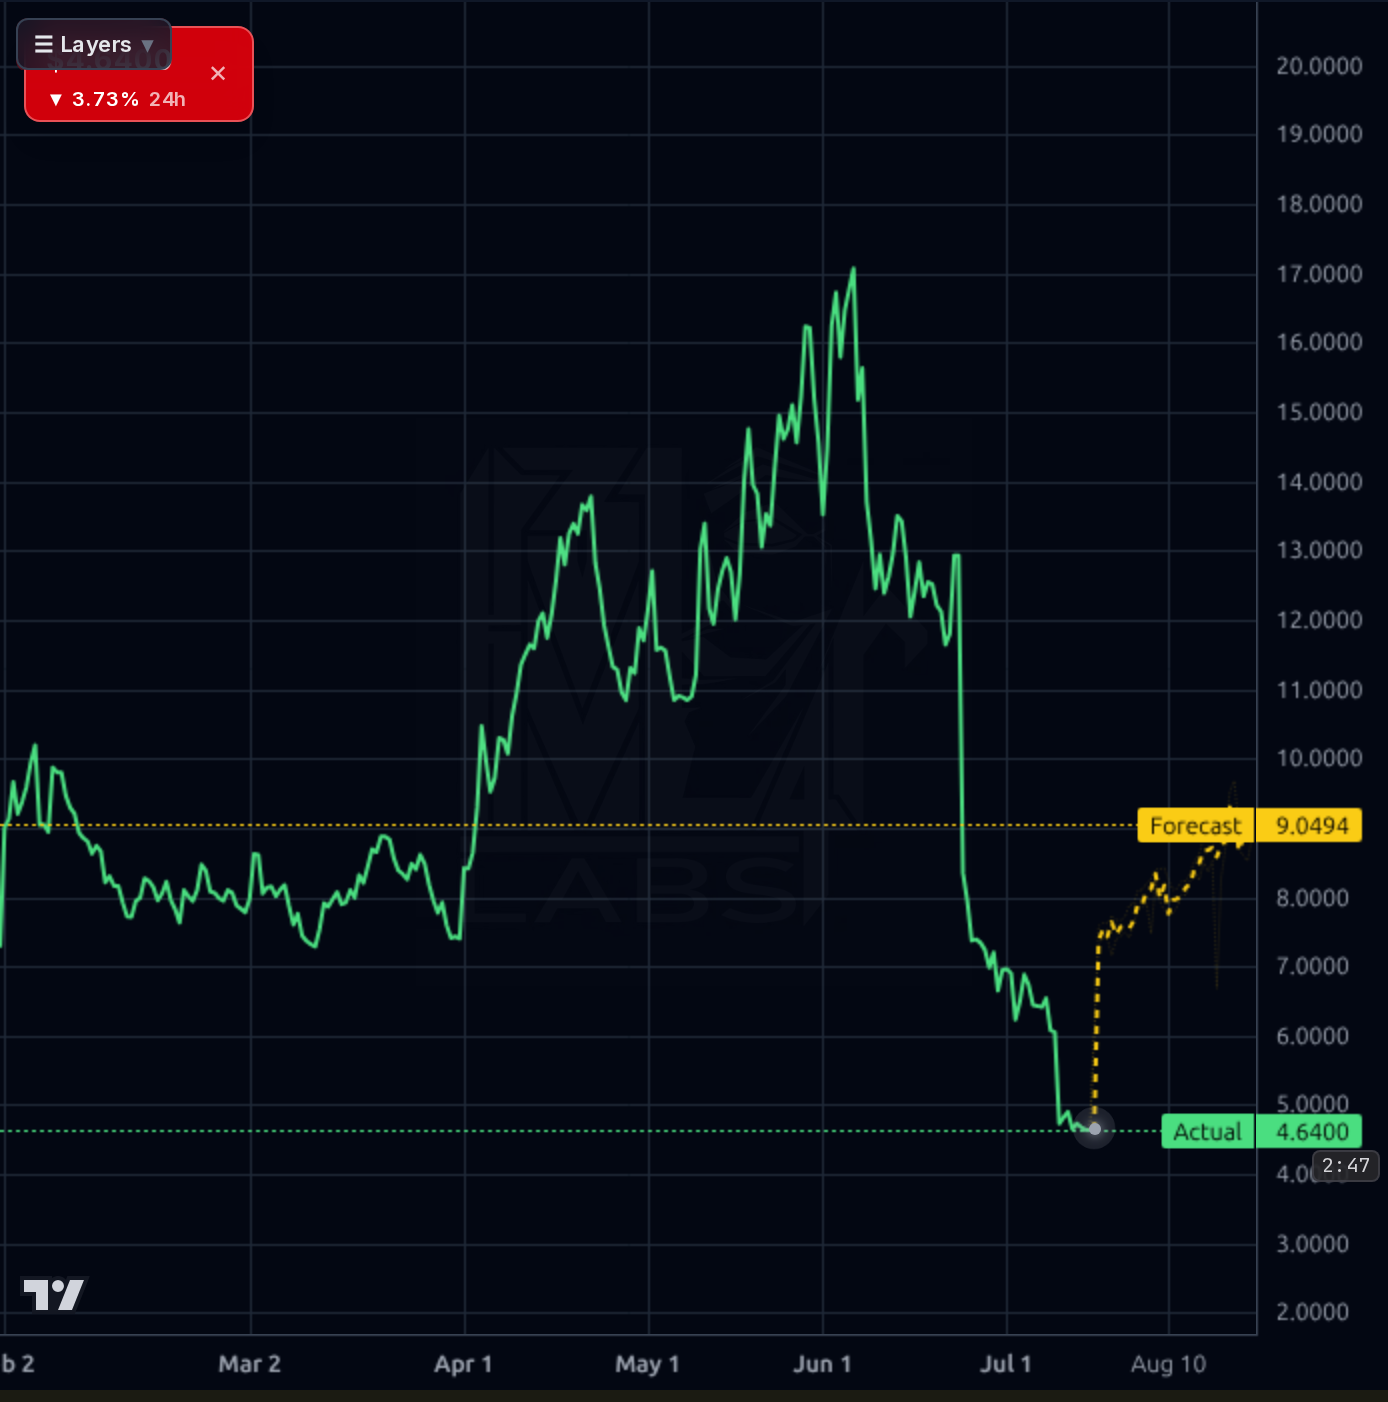
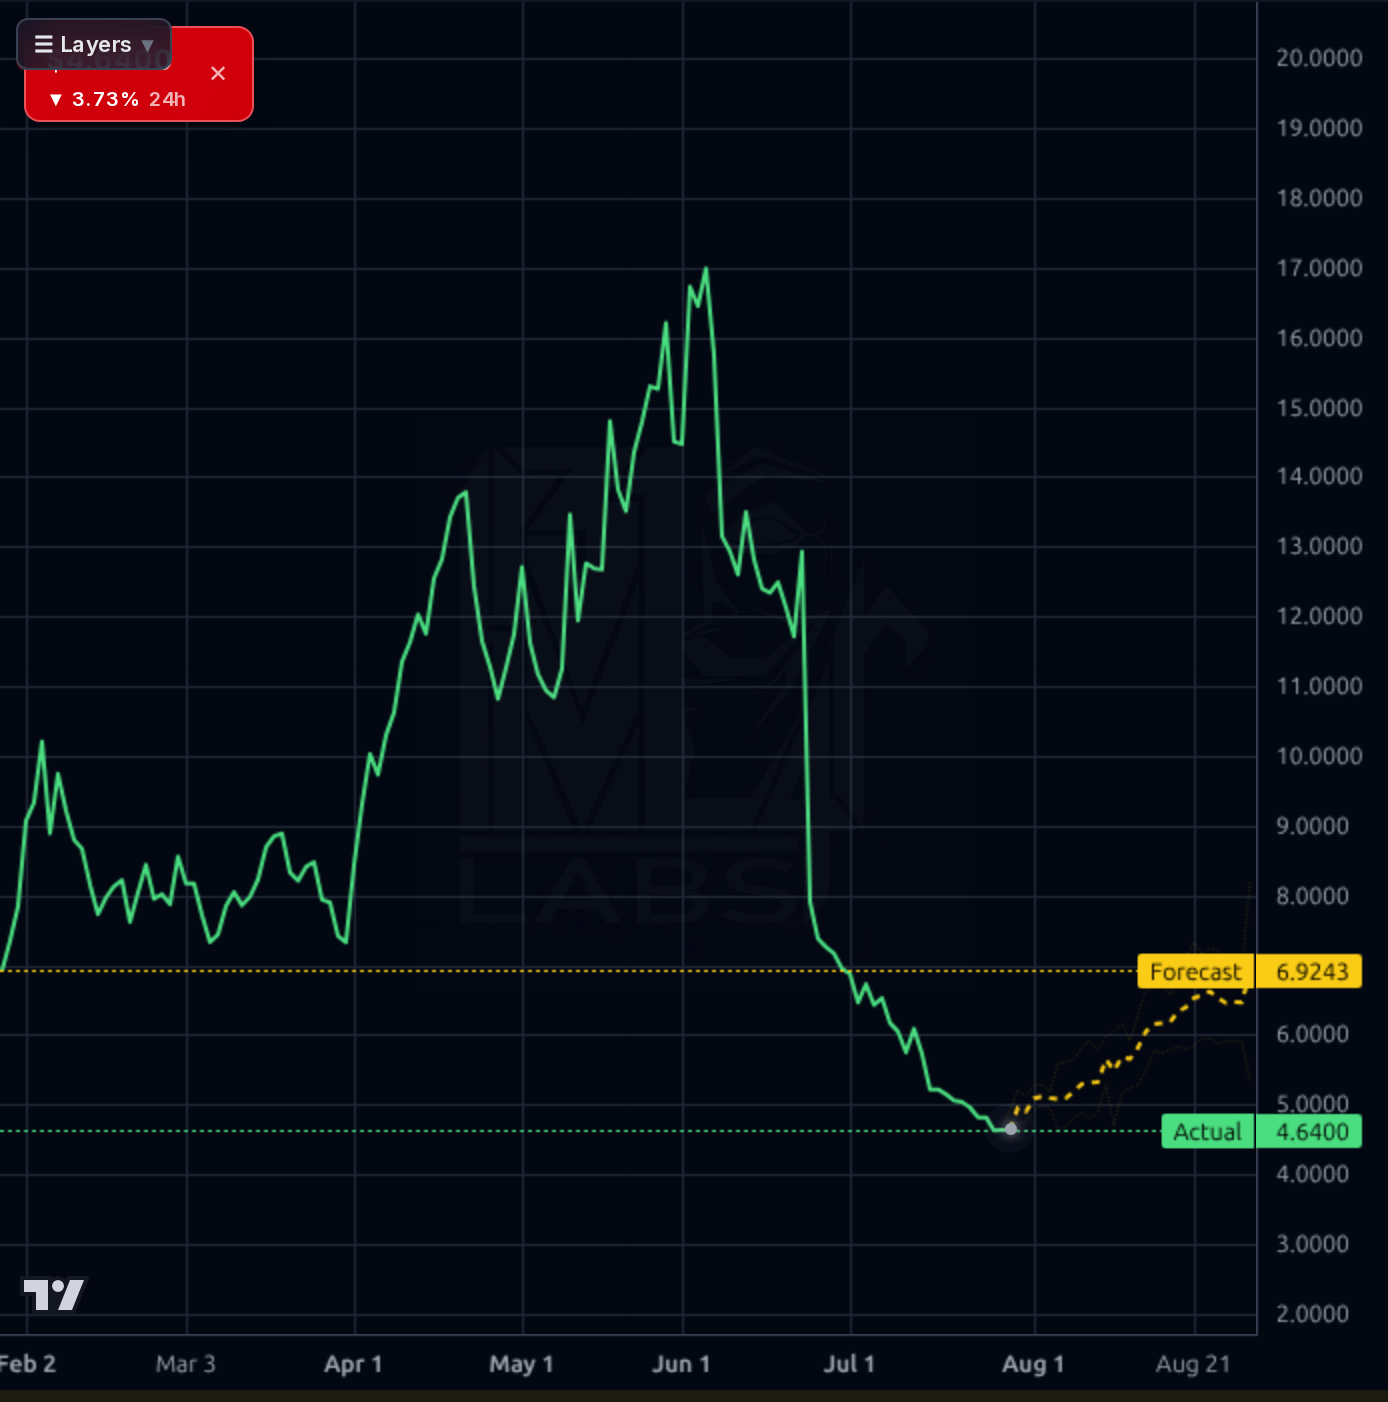
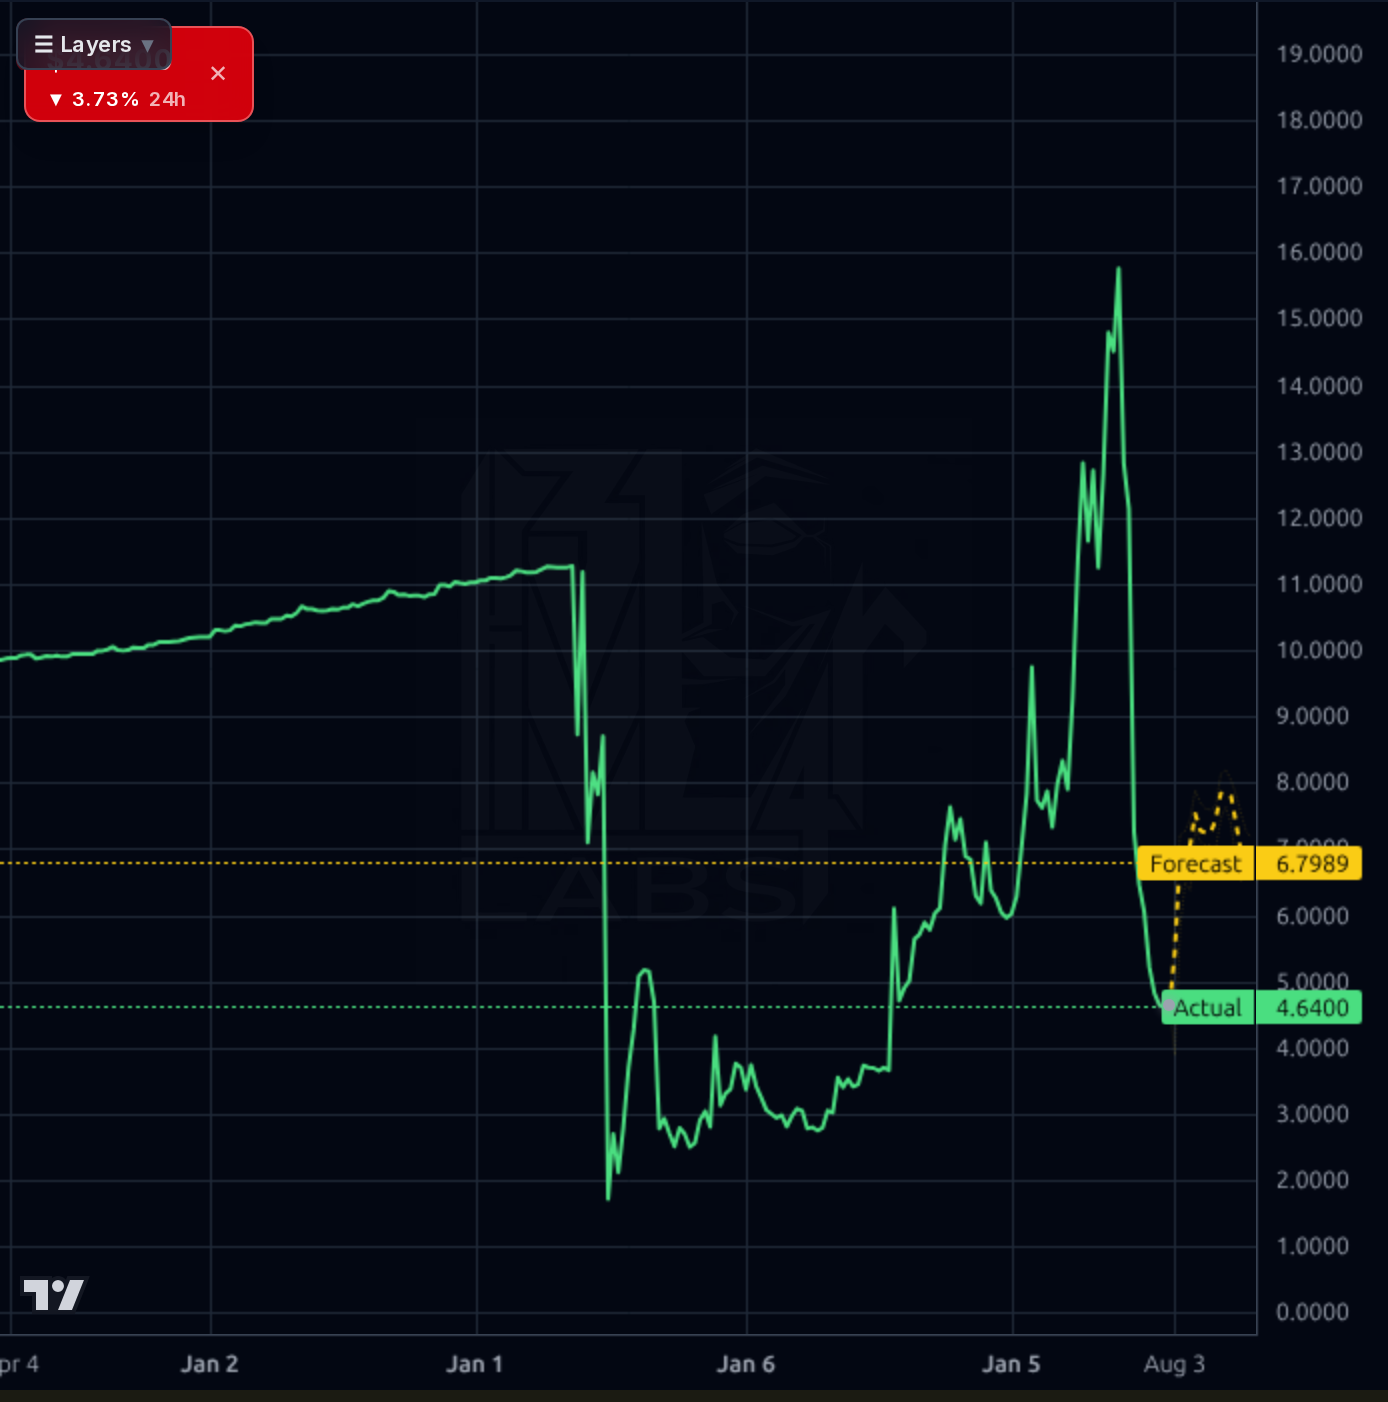
Every timeframe shows the same picture: a violent collapse from the $12-17 range in June to a $4.50-$5.00 shelf that is now being tested. The 1d chart shows price hugging the $4.64 level after failing to bounce; the 1h shows sideways consolidation between $4.40-$4.80 with no clear reversal structure. RSI at 23.5, SMA20 -19%, SMA50 -54%, SMA200 -47% — this is textbook capitulation, but capitulation without a base. Weekly context shows the current level is actually where the stock traded pre-June 2025 rally, suggesting the entire speculative premium has been reset. The model's forecast bands are aggressive to the upside ($14.7 on 1h, $9.05 on 4h, $6.92 on 1d) but its realized directional accuracy (72% at 1d vs 97% naive baseline; 33% at 1wk vs 100% naive) is worse than simply assuming no change — I heavily discount these projections. Key levels: $4.50 shelf support, $3.88 52-week low (bear target), $6.00 gap-fill resistance, then $8-9 as the pre-collapse consolidation zone.
The signal in the news is that TOYO's Q1'26 print was legitimately strong (revenue +177% YoY, $28.4M net income, EPS $0.75, 2026 adj. net income guide of $90-100M) and the company has secured $185.6M in US supply agreements plus Russell 3000/Microcap inclusion. The Houston 1.5 GW HJT facility ($357M, 20-month build, ~400 jobs, eligible for Section 45X credits) is a credible strategic pivot to onshore manufacturing aligned with IRA incentives. The noise/negative signal is the funding path: the June 24 $50M direct offering at $11 (now underwater ~58%) was dilutive and telegraphs that the Houston capex will require materially more equity — the market has been pricing that risk into the stock. The July 21 45X eligibility confirmation and the July 1 CFO succession are incremental positives but don't change the binary setup around the August 17 Q2'26 print.
- 1.5 GW Houston HJT solar cell facility ($357M) targeted for completion within ~20 months, generating up to $60M/yr in Section 45X tax credits at full capacity
- $185.6M in signed US master supply agreements for utility/commercial projects across Texas, New York, and Maine
- Full-year 2026 shipment guidance of 5.5-5.8 GW and adjusted net income guide of $90-100M vs current market cap of ~$198M
- Russell 3000 and Russell Microcap index inclusion (June 2026) providing passive demand tailwind
- US subsidiary confirmed eligible for Section 45X Advanced Manufacturing Production Credits for 2025 tax year
- Binary Aug 17 Q2'26 print — Q1'26's 33.5% GM must prove durable; the prior quarter's 20.9% GM sets a low validation bar
- Severe balance sheet fragility: current ratio 0.68, quick ratio 0.31, working capital -$97M against a $357M Houston capex commitment implies additional equity dilution is highly likely
- June $50M placement priced at $11 is now underwater ~58%, signaling limited appetite for follow-on issuance at depressed levels
- Chinese solar oversupply and global ASP deflation could compress margins before Houston capacity comes online
- Foreign currency exposure (JPY/USD) flagged in Form 20-F risk factors amid a rising-USD environment
- Short float still elevated at 24.2% — while down from 63.9%, further squeeze fuel is diminished and negative surprises could re-attract shorts
- Model forecast reliability is poor (1wk directional accuracy 33% vs 100% naive baseline) — do not lean on model upside projections
Get AI analysis on any stock
This is one of hundreds of Kronos AI reports — scored fundamentals & technicals, bull/base/bear price targets, a multi-horizon plan, and continuously-updated forecasts across the market. Create a free account to explore them all.
Create your free account →Already a member? Sign in · Join our Discord