TOYO— AI Stock Forecast & Price Targets
Published 7/2/2026 · A free sample of K3vl4r’s AI-powered analysis.
Kronos price forecasts, scored fundamentals & technicals, and a multi-horizon plan.
View the live TOYO price forecast →
TOYO is a fast-growing Japanese solar cell/module maker that screens extremely cheap (forward P/E ~2.1, PEG 0.03, EV/EBITDA 3.7) after a ~50% one-month collapse triggered by a dilutive ~$50M share-and-warrant offering priced at $11 on Jun 24. The setup is a classic value/volatility clash: strong income statement momentum (Q1'26 revenue $142.8M, net income $28.4M, ROE ~47-70%) against a fragile balance sheet (current ratio 0.68, negative working capital -$97M), a 42.8% short float on a 3.5M-share float, and a model whose own timeframes disagree (1h/4h forecasts point to $11-13, 1d points to $5.08, and the 1wk model has 0% realized directional accuracy). This is a high-risk, potentially high-reward mean-reversion candidate, not a core position.
1-4 weeks: no new swing position; the model's near-term bullish probability is 0.00 and the reliable 1d forecast points toward ~$5.08. If trading it, treat it as a squeeze lottery only above reclaimed $8.00 on volume (42.8% short float on a 3.5M float can produce violent rips — note the $156K Apr $12.5 call buy), with a stop below $6.40 (recent swing low). For holders, $6.40-6.50 is the invalidation; a close below opens $5.00-5.50. Size any position at 1% or less of book — ATR is $1.43 on a $6.88 stock (~21% daily range potential). Earnings Aug 10 is ~39 days out; any tactical long here is explicitly a PRE-earnings trade — I would be flat or hedged into the print given the binary gap risk and the 12-month record of post-event violence in this name.
1-6 months: the thesis is mean-reversion to a still-conservative multiple. If Q2 (Aug 10) confirms the Q1 run-rate (~$140M+ revenue, ~20% net margin), the stock at 2x forward earnings with a $16.50 street target offers 45-100% upside to $10-14; the offering proceeds plus $33M/qtr operating cash flow should repair the working-capital hole. Expected range: bear $4.50 (liquidity scare or earnings miss), base $10, bull $14-15. Catalysts: Aug 10 earnings, deployment of the $50M raise, Russell-driven passive flows, and short-covering from a 42.8% short float. I would change my mind on: another dilutive raise below $10, a Q2 gross-margin retreat toward the sub-10% levels of early 2025 (suggesting Q1 was tariff/pricing windfall, not structural), or auditor/governance red flags following the CFO change.
1-3 years: TOYO is a vertically integrated (wafer-to-module) solar manufacturer with US/Asia exposure; if it sustains even mid-teens net margins on $500M+ revenue, today's ~$294M market cap is a fraction of fair value. But solar cell/module manufacturing is a brutally cyclical, commoditized, policy-dependent industry — the 33.5% gross margin printed in Q1'26 is likely closer to peak than mid-cycle, and Chinese overcapacity plus US trade-policy shifts can compress it rapidly. The 91.9% insider ownership means minority holders have essentially no governance leverage. This is a trade/speculation on cycle position and re-rating, not a durable compounder; the biggest structural risk is margin normalization turning a 2x P/E into a 10x P/E on collapsed earnings without the price moving up at all.
The P&L trajectory is genuinely impressive: quarterly revenue scaled from $51.5M (Q1'25, net loss -$3.3M) to $87.6M (Q2'25) to $142.8M (Q1'26) with net income of $28.4M and margins expanding sharply — gross margin from 9.3% to 33.5%, operating margin from -2.5% to 25.4%. TTM sales are ~$518.6M with EBITDA of ~$141M, and Q1'26 produced $33.4M operating cash flow / $28.8M FCF as capex normalized ($4.6M vs $31.1M in Q2'25). Valuation is objectively cheap on every metric: trailing P/E 3.5-6.3, forward P/E ~2.1 on $4.06 forward EPS, P/S 0.69, EV/EBITDA 3.67, EV/Sales 0.82, versus an analyst strong-buy (Recom 1.00) and $16.50 target. The problems are structural: negative working capital of -$97M, current ratio 0.68 and quick ratio 0.31, total debt $116.8M against $54.4M cash, and debt/equity ~0.84. The Jun 24 ~$50M offering at $11/share+warrant confirms the liquidity need and cost the stock roughly half its value — capital allocation is being done from a position of weakness. Add 91.9% insider ownership (tiny 3.47M float), only 1.19% institutional ownership, and a July 1 CFO change, and quality-of-governance discounts are warranted despite the cheap multiples.
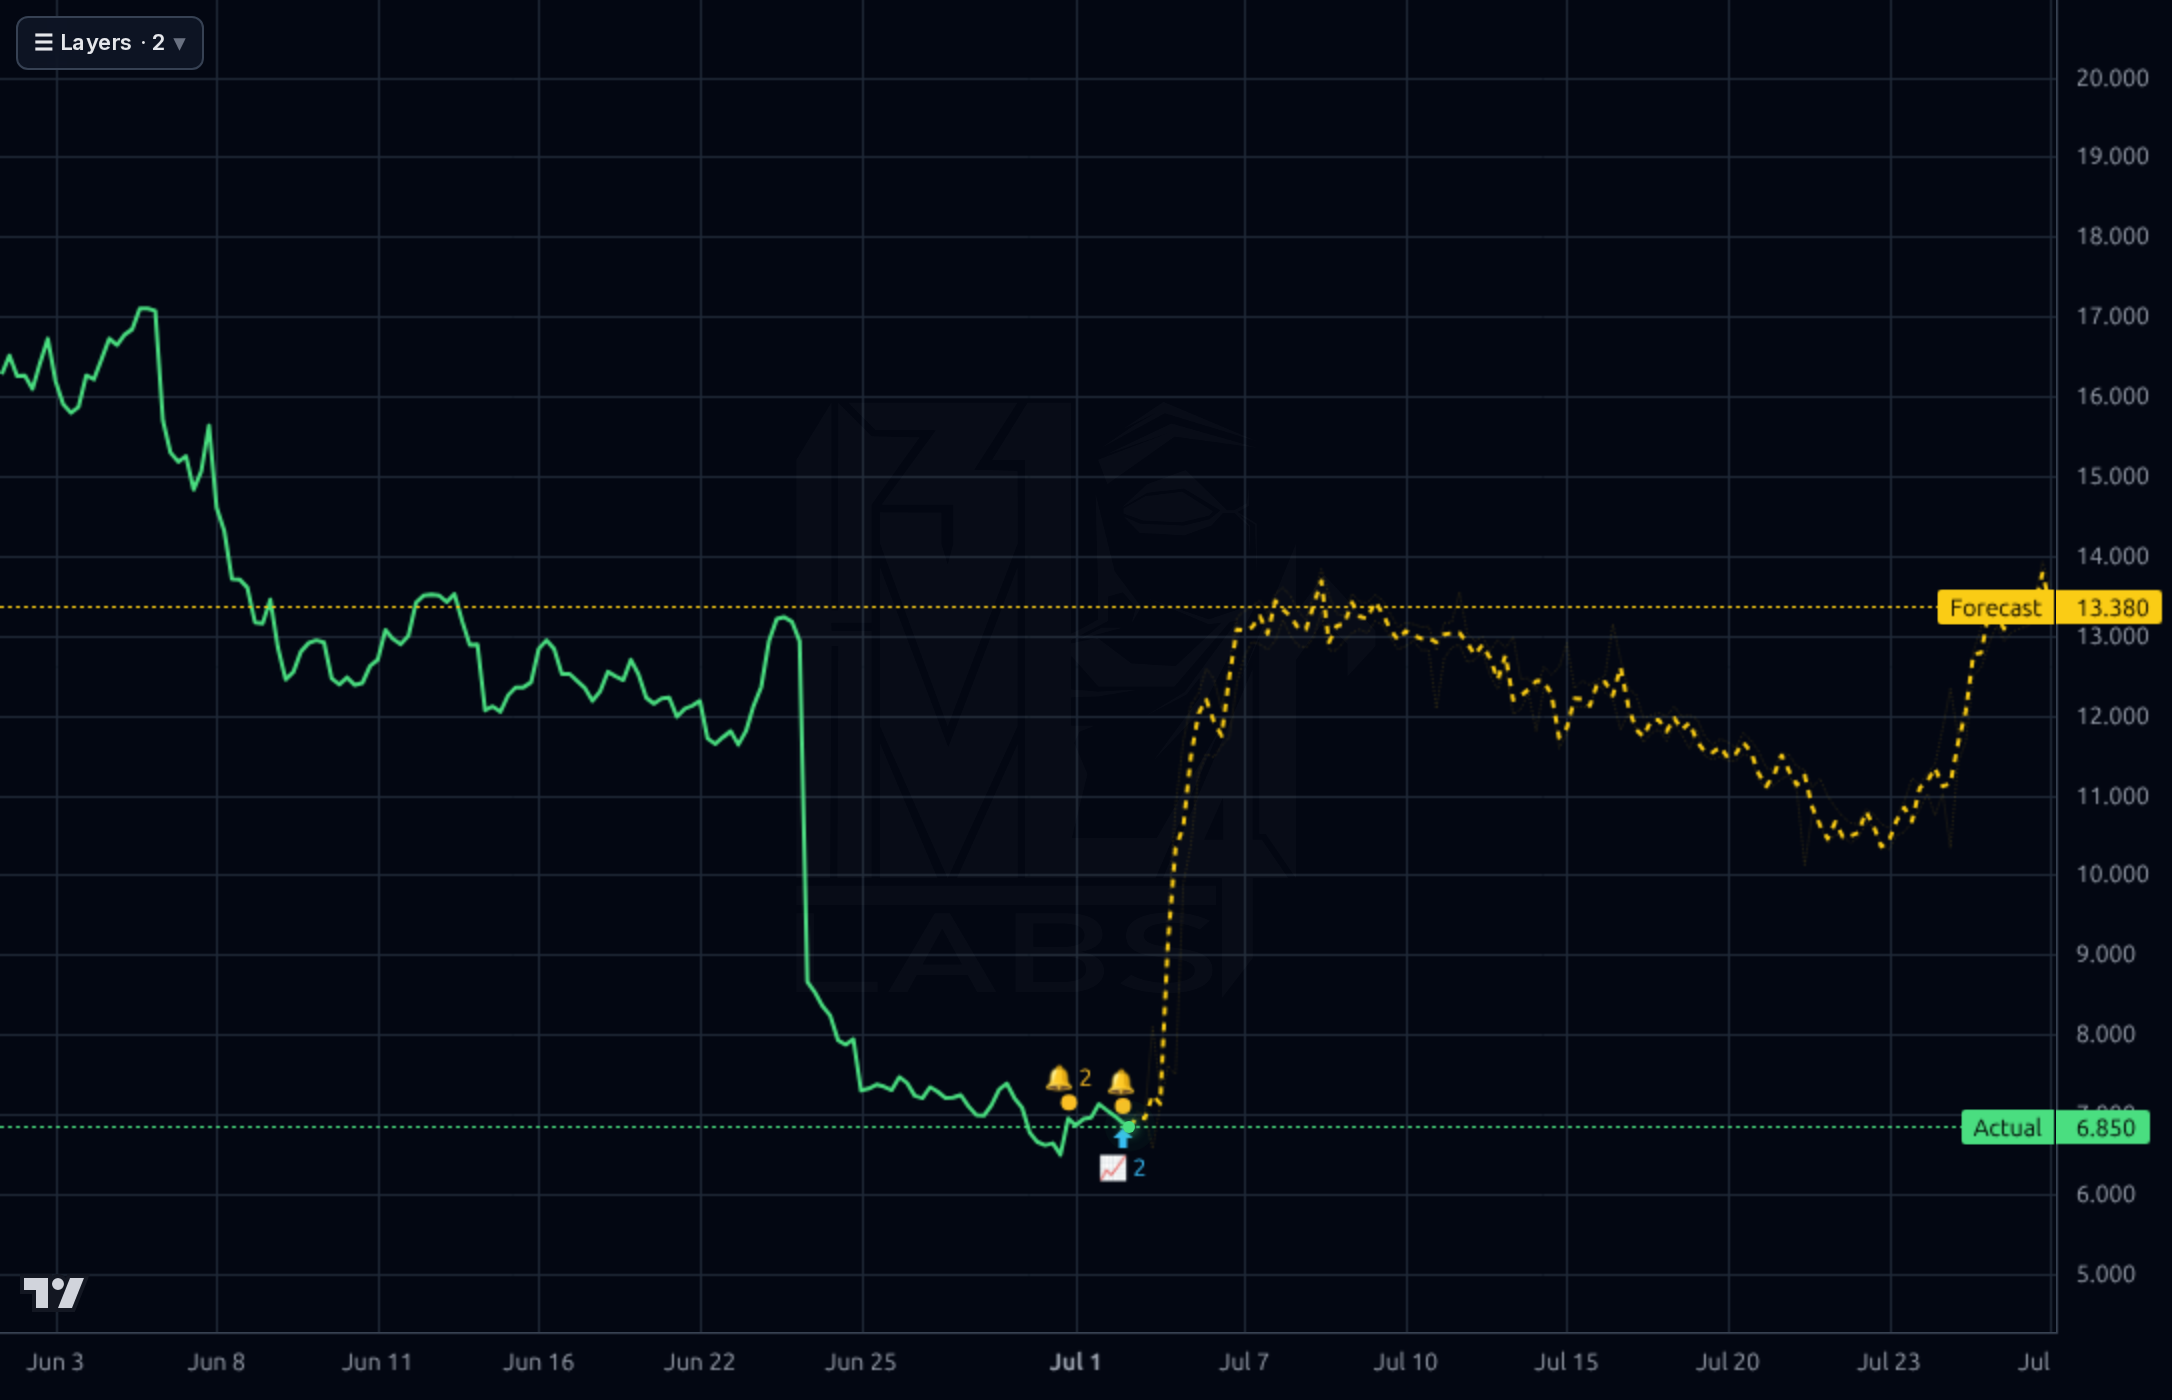
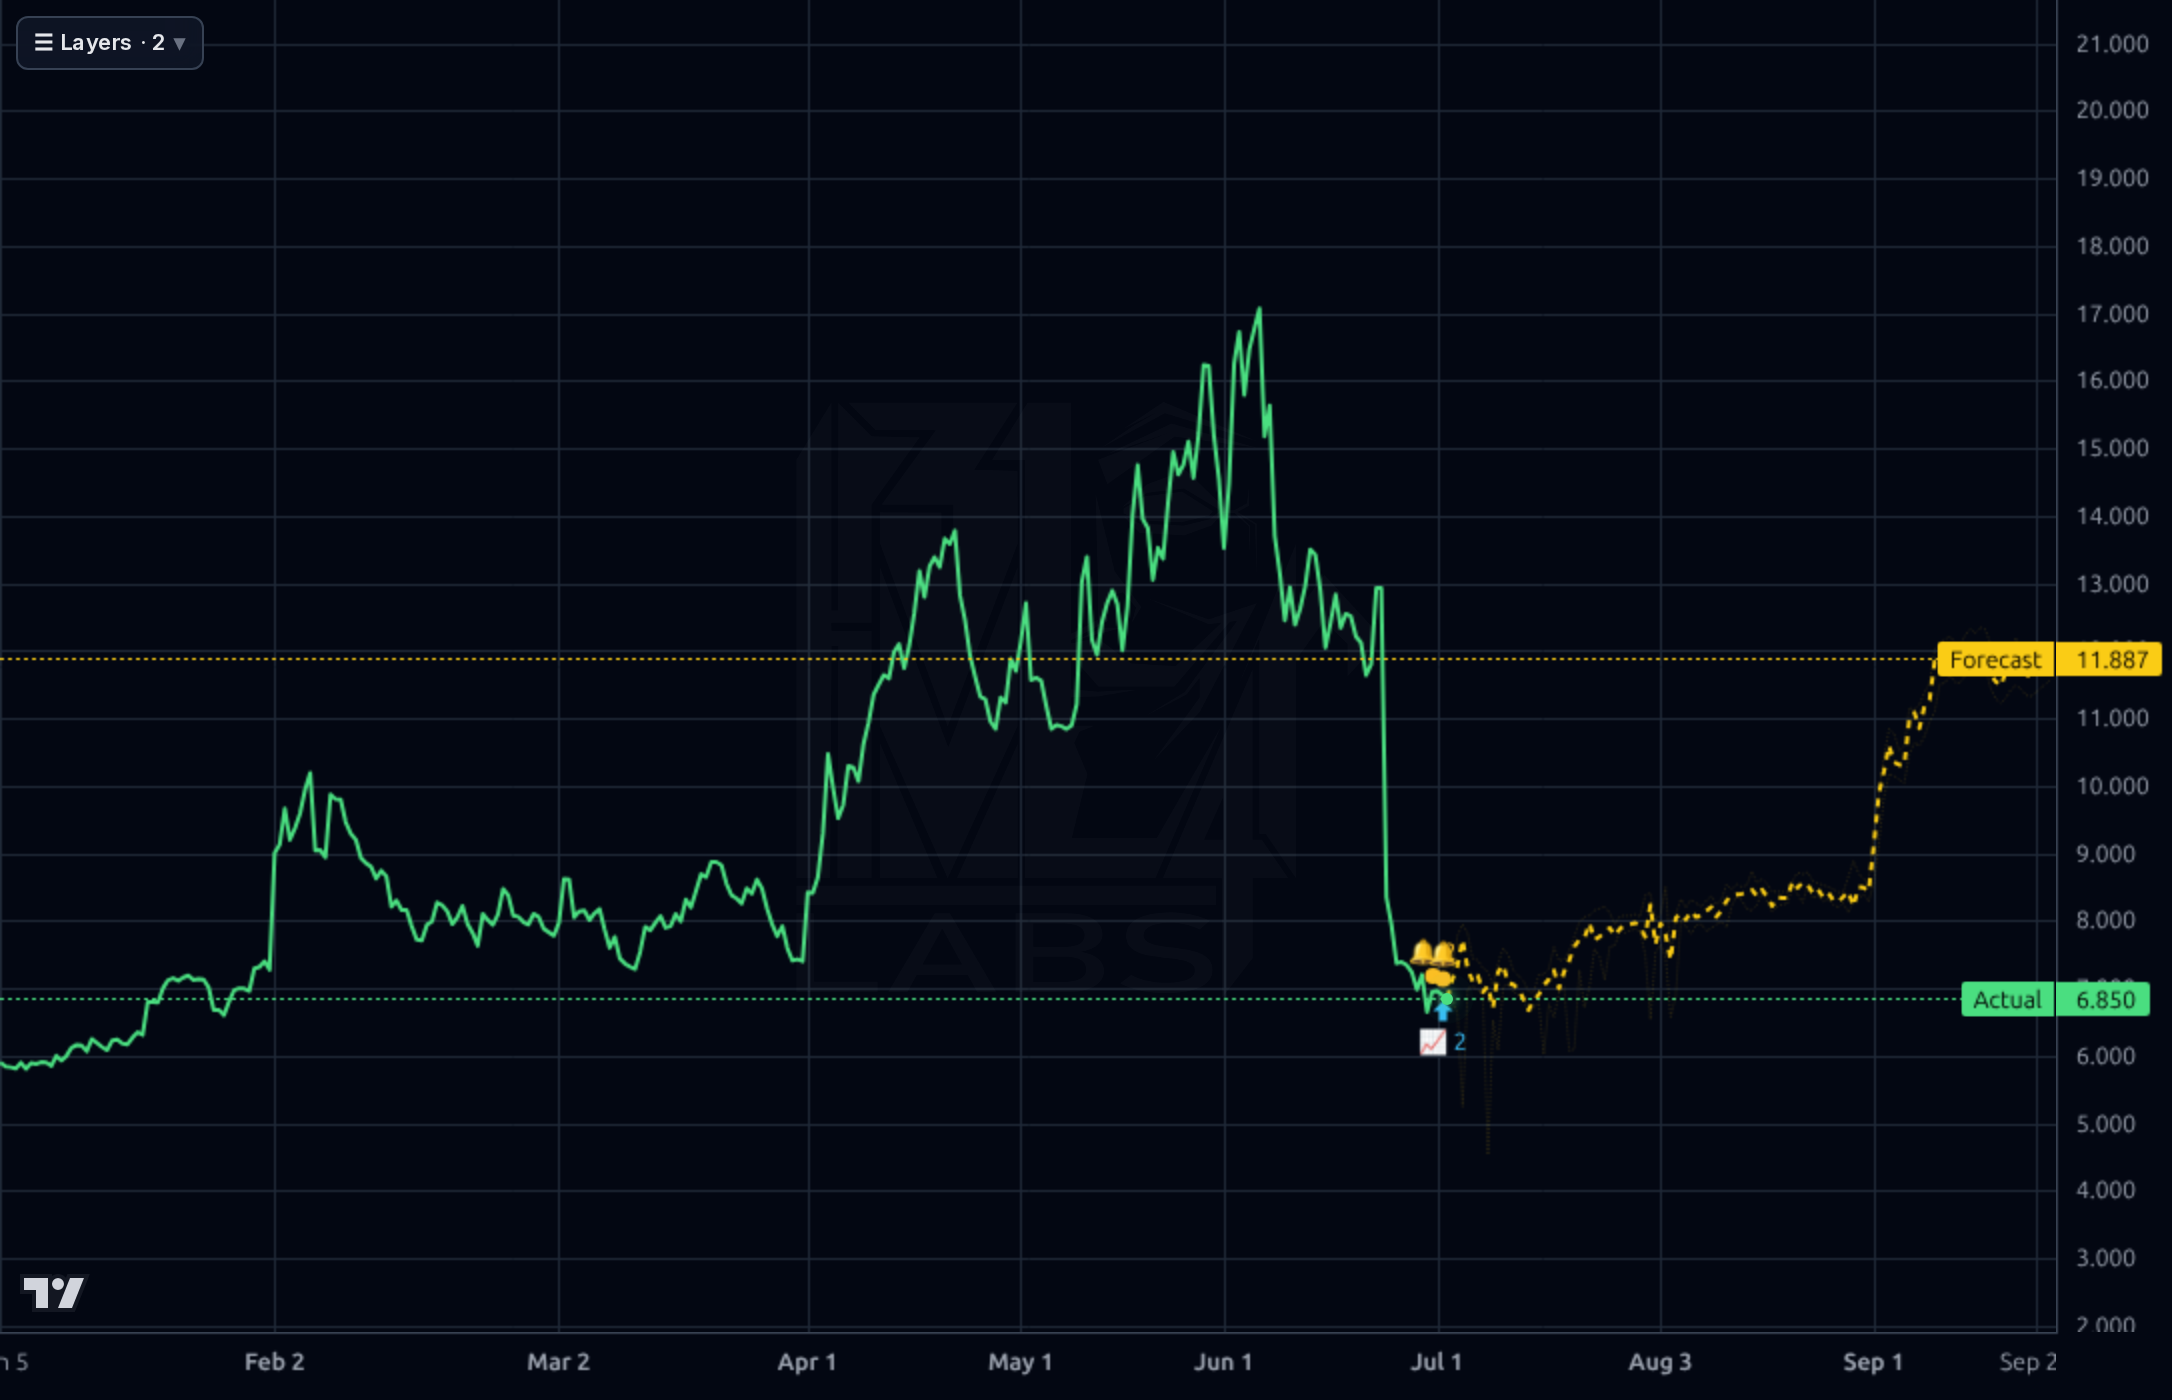
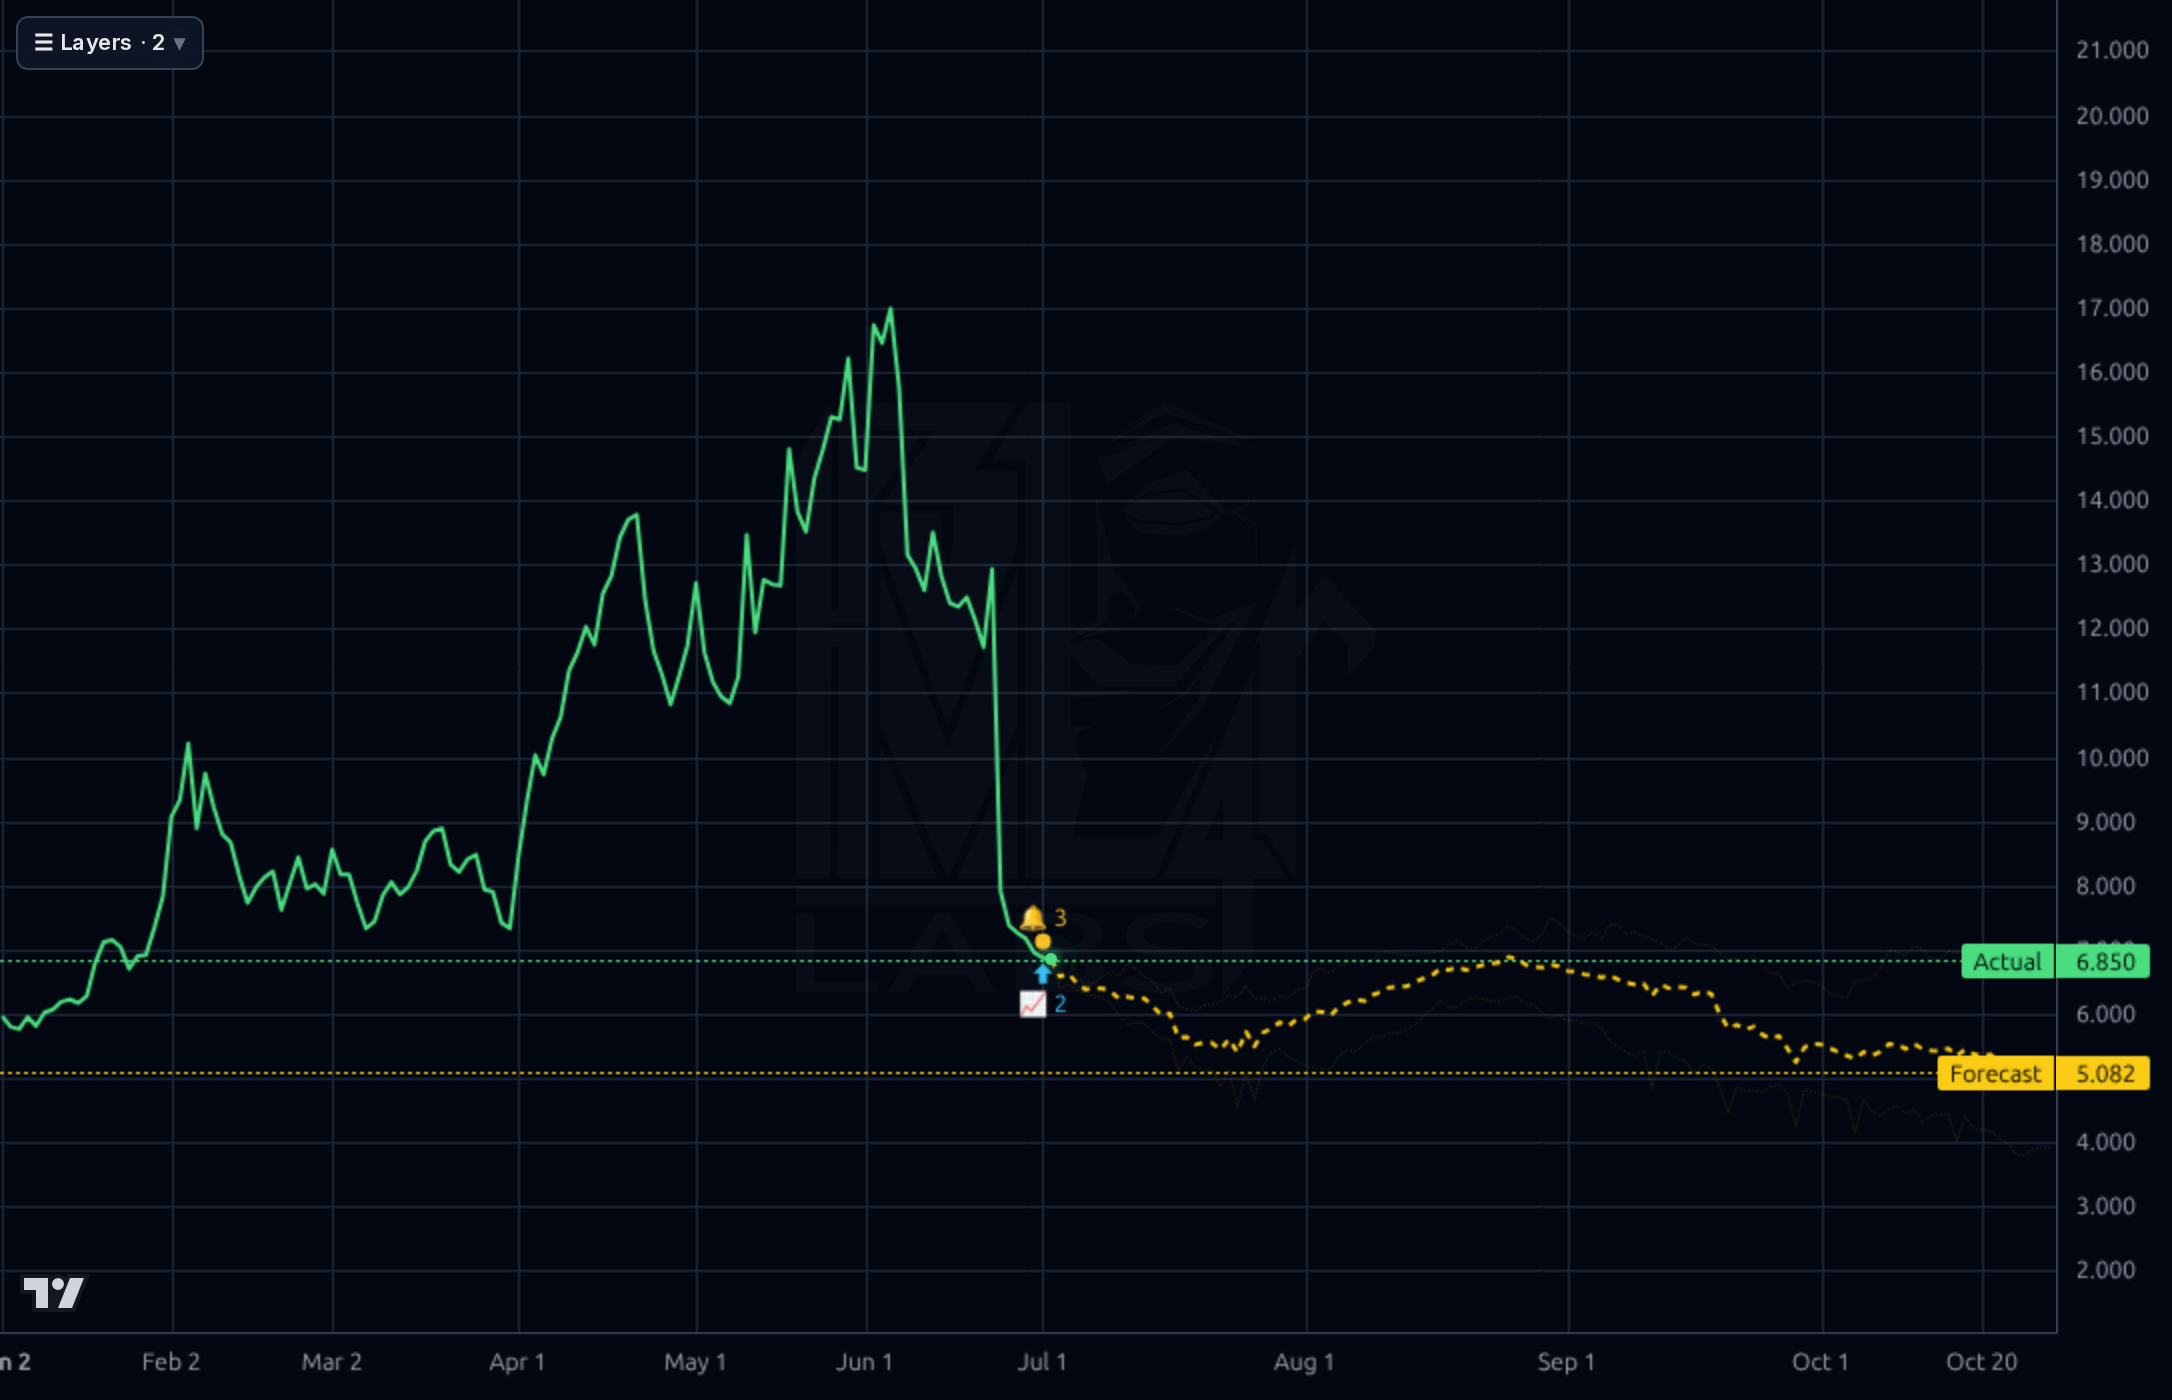
The tape is broken near-term. On the daily/weekly charts, TOYO ran from ~$3.5-4 to a $17.43 52-week high by early June, then collapsed in a near-vertical move to ~$6.5-6.9 after the Jun 24 offering — price sits -40.7% below the 20SMA, -44.9% below the 50SMA, and -21% below the 200SMA, with RSI(14) at 28.5 (oversold but not yet reversing). The $6.5-6.85 zone is the immediate support being tested; below that, the prior consolidation from mid-2025 around $5.50-6.00 and the 1d forecast's $5.08 level are the next shelves; overhead, $8 then the $11 offering price are heavy resistance (offering buyers and warrant holders create supply there). The Kronos forecasts are internally contradictory: the 1h band projects a recovery to ~$13.38 and the 4h to ~$11.89, but the 1d band projects further downside to ~$5.08 over ~3 months, and the 1wk band shows a deep flush toward ~$4 before recovering to ~$11.87 — while the model's own bullish probability is 0.00 on both horizons. Realized accuracy supports trusting the short daily horizon (100% directional, 2.6% MAPE, though only 2 samples) and heavily discounting the 1wk forecast (0% vs 100% naive baseline, 52% MAPE). Net read: oversold with capitulation characteristics, but no confirmed base; the path of least resistance short-term is sideways-to-lower until $7-8 is reclaimed.
The signal is the Jun 24 announcement of a ~$50M offering of common shares and warrants at a combined $11 — that is the proximate cause of the crash from ~$13 to ~$7 and it matters twice: it dilutes (shares outstanding ~37.8-42.7M, so ~10%+ dilution plus warrant overhang) and it validates the balance-sheet stress visible in the negative working capital. The Jul 1 CFO transition (Yasunari Harada replacing Taewoo Chung) immediately after a value-destructive financing adds governance uncertainty — retail chatter explicitly blames the deal structure. The Jun 26 Russell 3000/Microcap inclusion is a modest structural positive (index-fund demand into a 3.47M-share float) and may partly explain the short float declining from 49.7% to 42.8% over ~45 days, a graded L2 bullish signal.
- Q1'26 revenue of $142.8M (up ~177% from $51.5M a year earlier) with gross margin expansion from 9.3% to 33.5% — scaling of the vertically integrated wafer→cell→module chain into the US market
- ~$50M offering proceeds (Jun 24) available to fund capacity expansion and repair the -$97M working-capital deficit
- Russell 3000/2000/Microcap index inclusion effective Jun 26 driving incremental passive ownership into a 3.47M-share float (inst. ownership only 1.19% today)
- Street forward EPS of $4.06 (vs $1.09 TTM) and EPS-next-Y growth of 45% implying continued ramp; Aug 10 earnings is the proof point
- Short float already declining (49.7% → 42.8% in ~45d) — a covering cycle into good news is itself a price driver given float scarcity
- Dilution/overhang: $50M offering at $11 plus warrants caps upside near $11 and signals capital need; further raises possible given current ratio 0.68 and quick ratio 0.31
- Balance sheet: negative working capital -$97M, $116.8M total debt vs $54.4M cash — a demand or financing shock could force distressed actions
- Extreme volatility/crowding: 42.8% short float on a 3.47M-share float, 10.5-13% daily volatility, 91.9% insider ownership — price discovery is thin and violent in both directions
- Margin cyclicality: Q1'26's 33.5% gross margin vs 9.3% a year ago suggests peak-cycle pricing (tariff arbitrage); solar module ASPs are structurally deflationary under Chinese overcapacity
- Governance: abrupt CFO change (Jul 1) immediately after a value-destructive financing; near-zero institutional sponsorship to enforce discipline
- Model/forecast risk: Kronos timeframes contradict each other (1h/4h bullish to $12-13, 1d bearish to $5.08), 1wk model has 0% realized accuracy, and near-term bullish probability is 0.00
- Binary earnings event Aug 10 (~39 days) with EPS surprise history mixed (sales surprise -29.6%)
Get AI analysis on any stock
This is one of hundreds of Kronos AI reports — scored fundamentals & technicals, bull/base/bear price targets, a multi-horizon plan, and continuously-updated forecasts across the market. Create a free account to explore them all.
Create your free account →Already a member? Sign in · Join our Discord