UPST — AI Stock Forecast & Price Targets
Published 7/23/2026 · A free sample of K3vl4r’s AI-powered analysis.
Kronos price forecasts, scored fundamentals & technicals, and a multi-horizon plan.
View the live UPST price forecast →
UPST has broken the $31 structural support and now trades at $28.60 with RSI 37, below all major SMAs, heading into a binary Aug 4 earnings print with 31.5% short float. Revenue reacceleration (+58% TTM, +44% Q/Q) and funding wins (Neuberger $600M, Wafra $200M) are real, but -$133M Q1 OCF and 74x trailing P/E leave no cushion; the setup is a HOLD/AVOID pre-print with $23.97 52w low as the next real support.
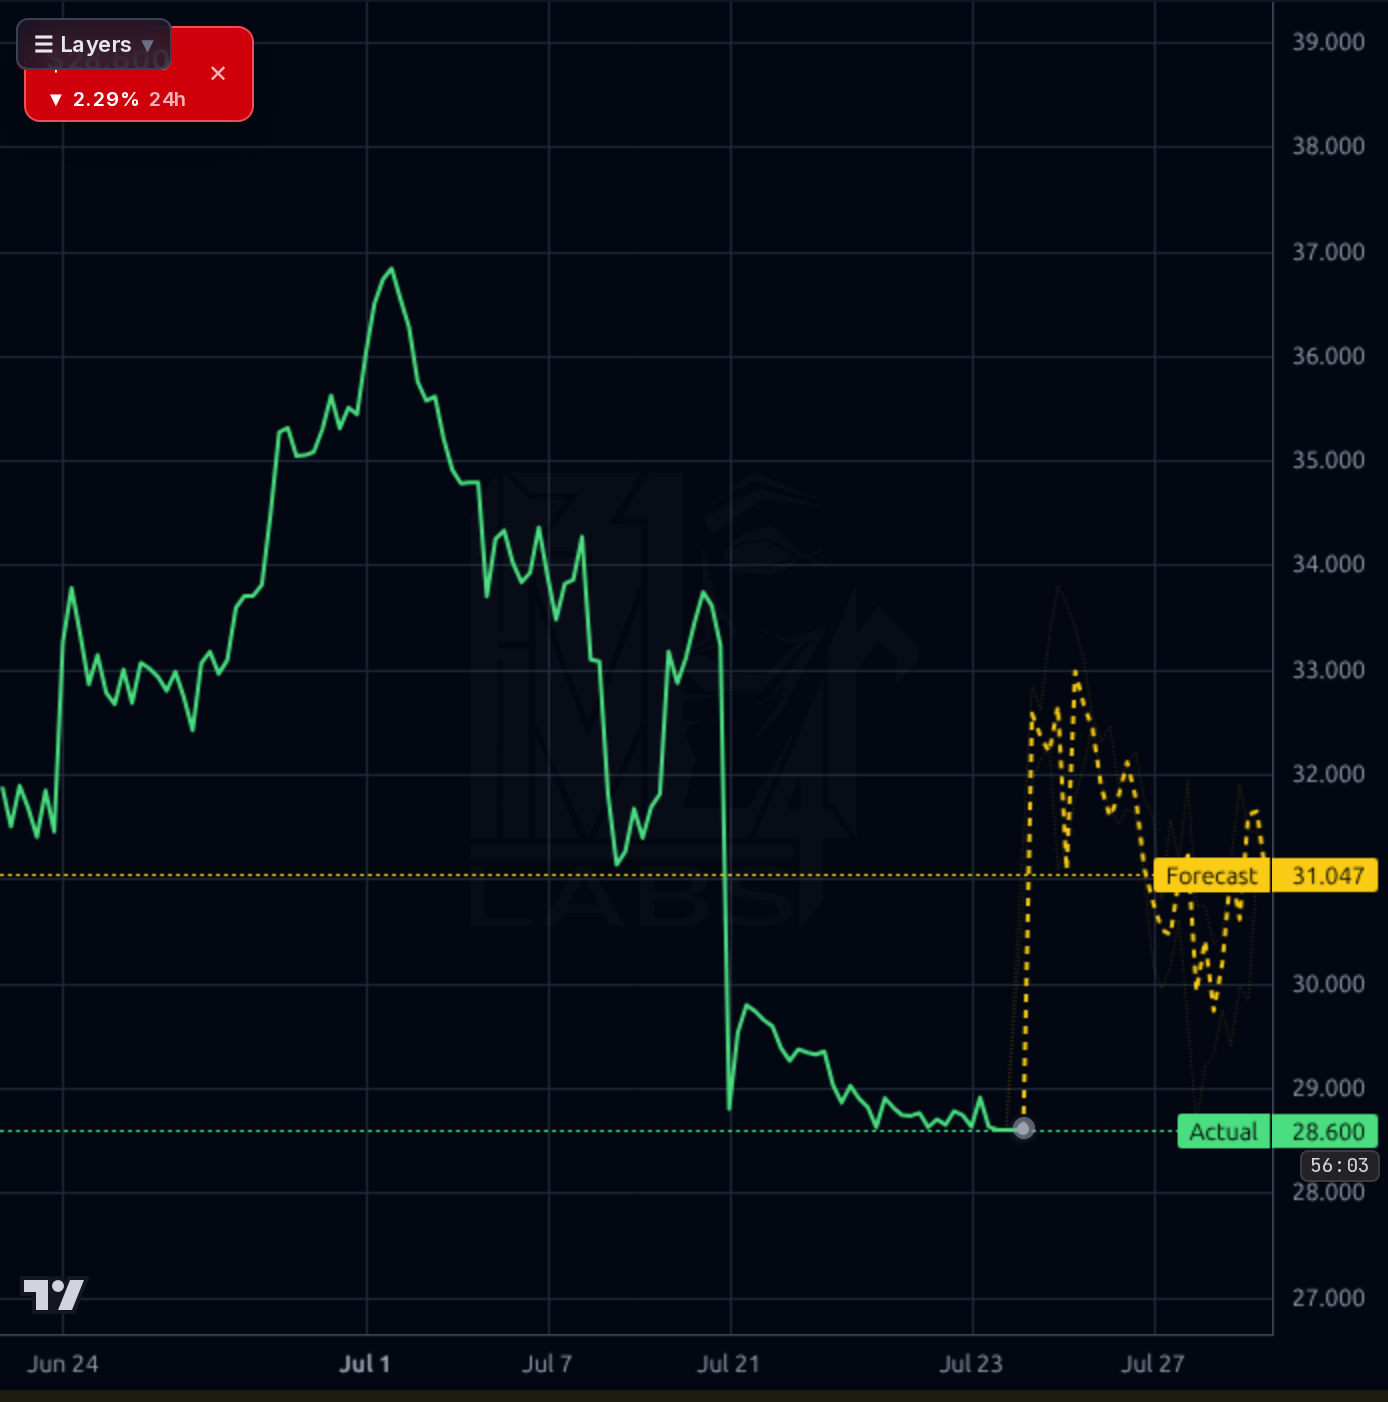
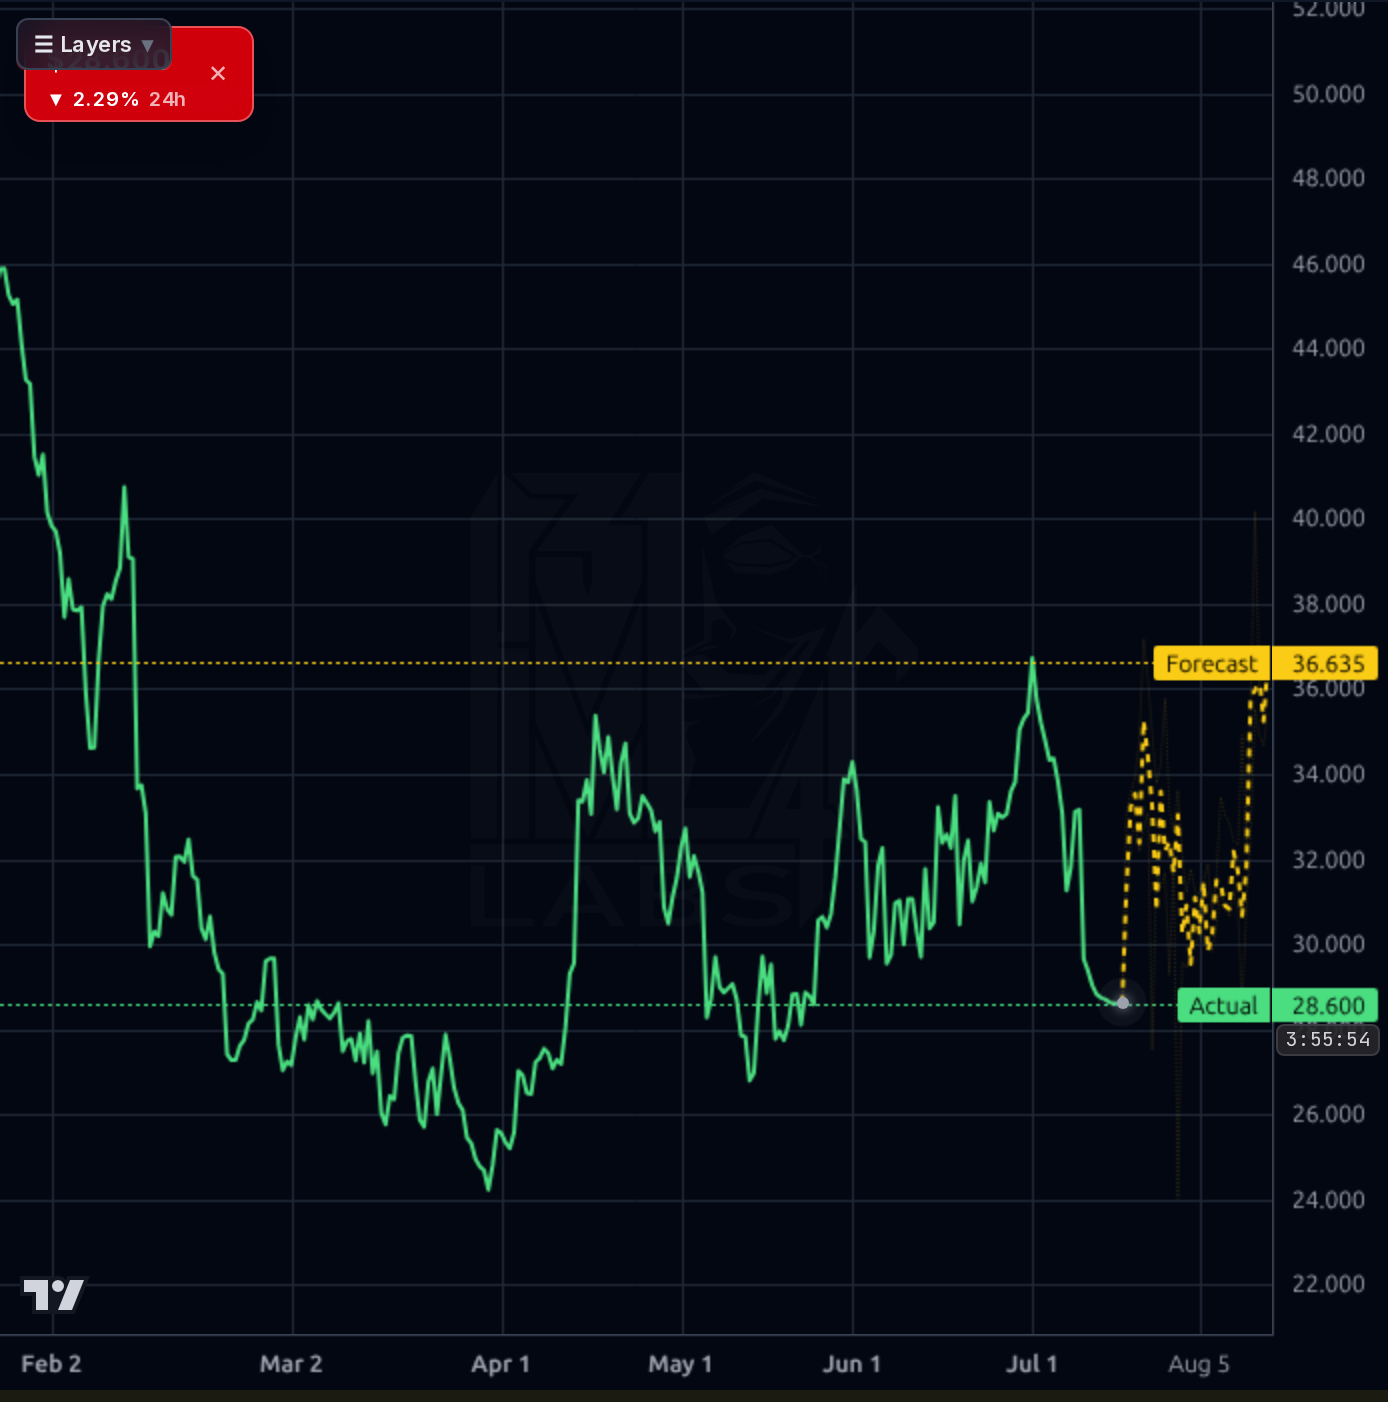
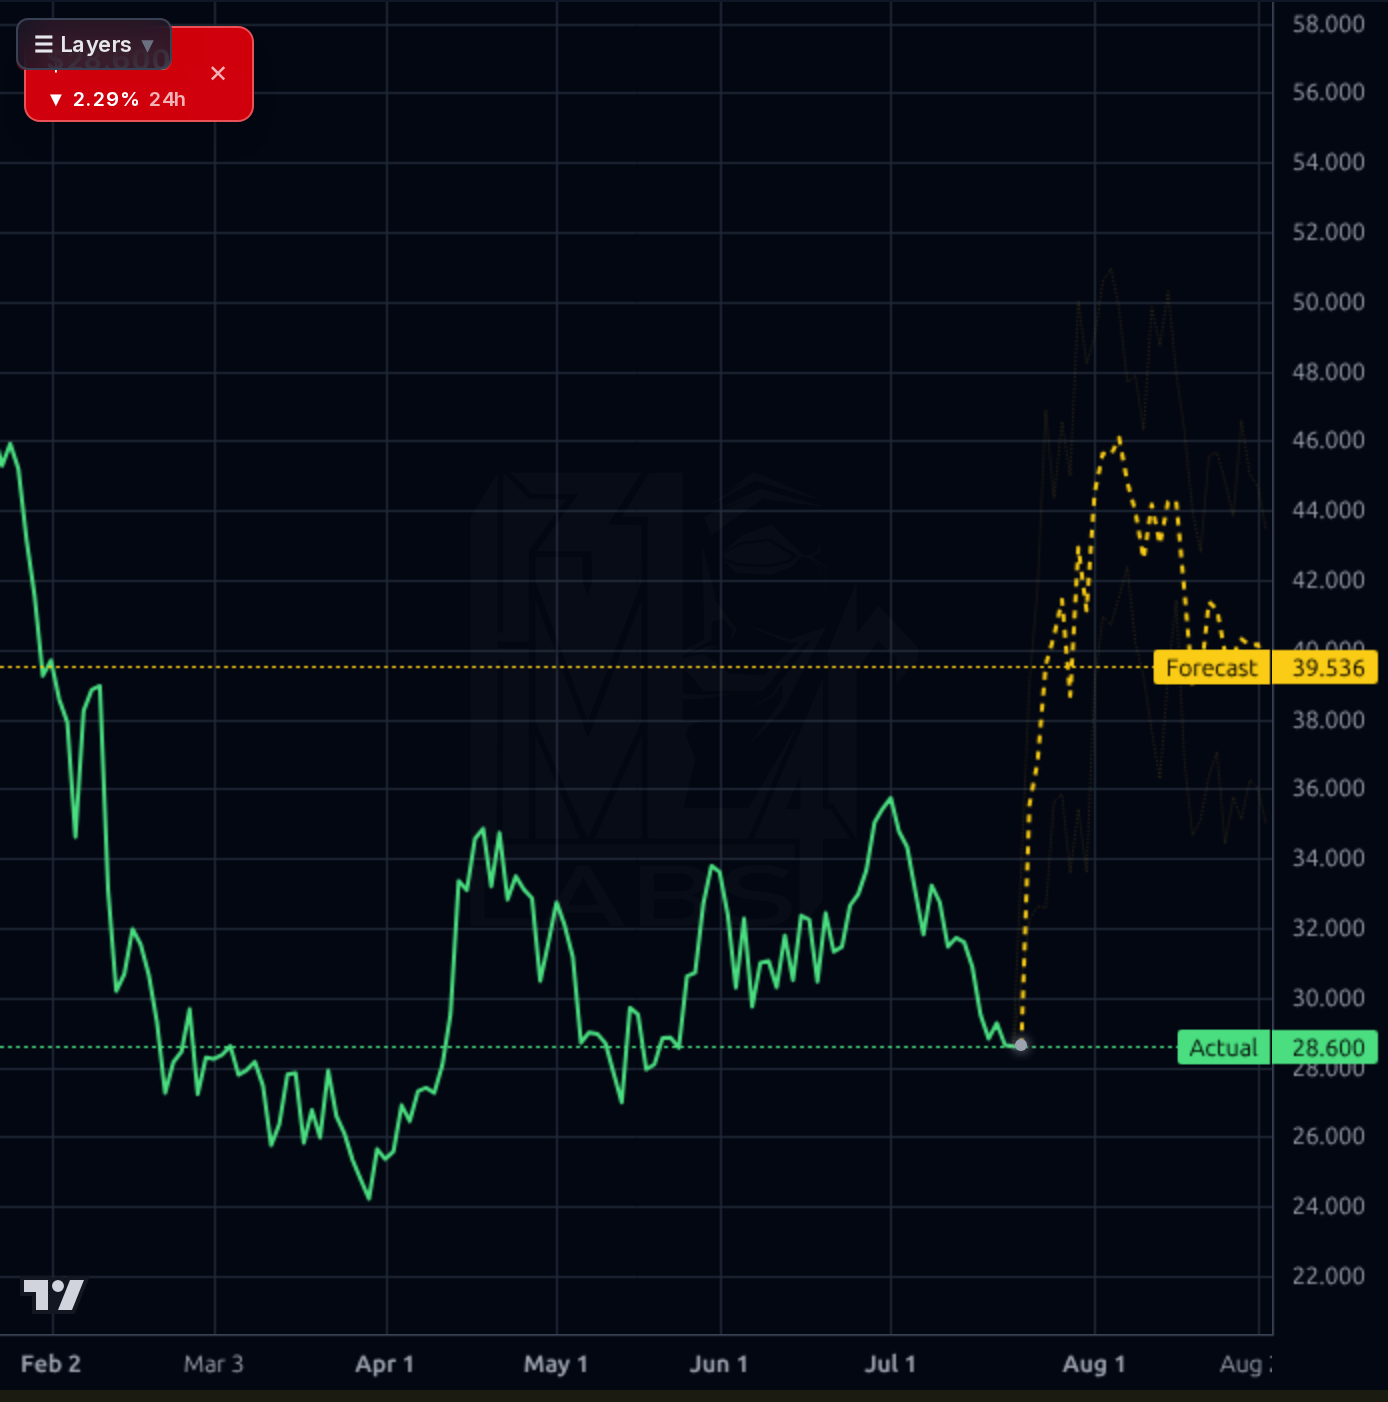
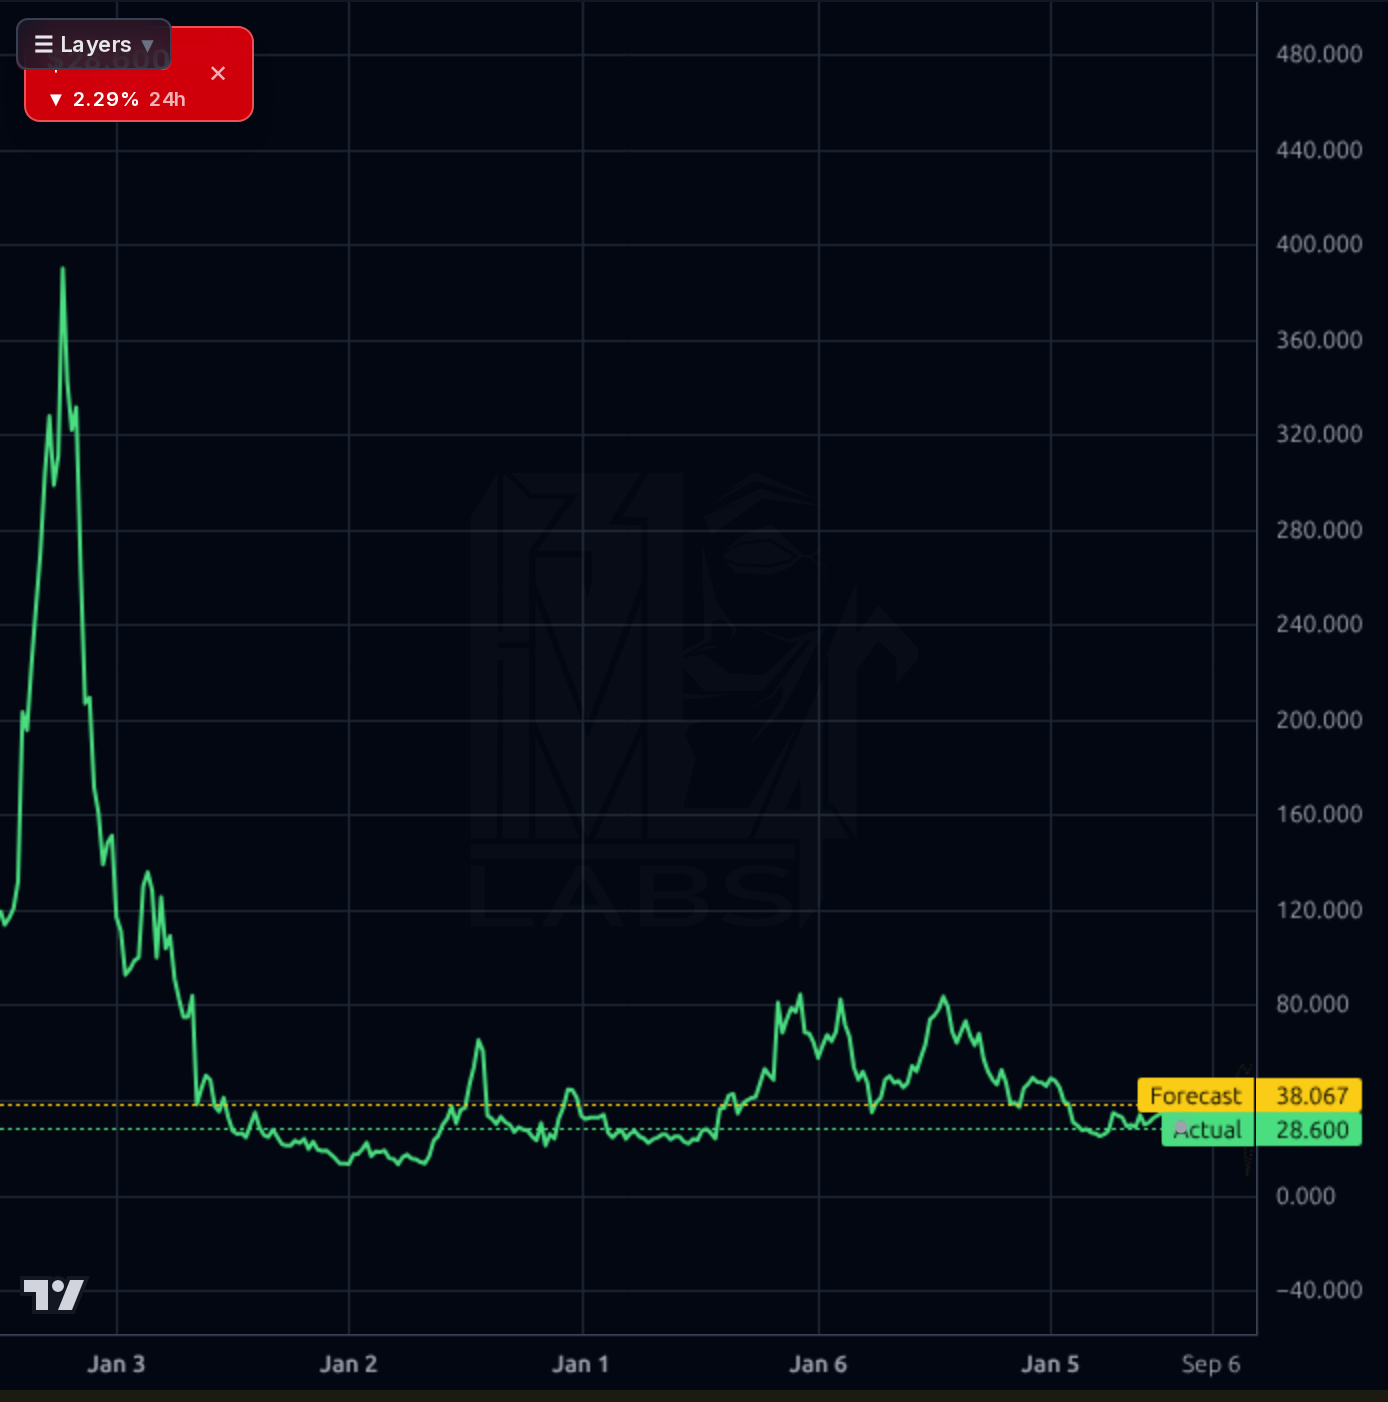
AVOID initiating new long exposure into the Aug 4 AMC print (~12 days out). Technical break of $31 support with RSI 37 and no reversal signal argues for continued drift toward $25-$27 pre-print. Key levels: resistance $31 (former support, now overhead), $33 (SMA50 area); support $25.50 (recent low pivot), $23.97 (52w low). Any pre-earnings swing target caps at $31 reclaim. Invalidation for shorts: reclaim of $31 on volume. Do NOT short — 31.5% short float and 5.78 short ratio create acute squeeze risk on any positive surprise or funding headline. If already long, exit-flag; if flat, wait for the print.
1-6 month thesis hinges entirely on the Aug 4 print: does OCF inflect from -$133M and does GAAP net income return positive? A clean beat + FY reaffirm + Aug 20 ABS 2026-3 pricing at tight spreads could re-rate the stock into the $36-$42 range (squeeze mechanics amplify). A miss or guide cut opens $20-$24 with high probability. Expected range: $22-$40 with fat tails. Catalysts: Aug 4 earnings, Aug 20 ABS pricing, bank charter progress. What changes my mind: two consecutive quarters of positive OCF, or a formal bank charter approval — either would justify a re-rate.
1-3 year terminal thesis: UPST is a call option on AI underwriting achieving a durable cost-of-capital advantage over legacy prime consumer credit. Bull case requires the bank charter to be approved (structurally lowering funding costs via deposits) and product expansion (Cashline revolving, HELOCs, auto-secured) to diversify beyond the personal-loan cycle. Bear case is that the platform remains a cyclical, capital-markets-dependent originator whose earnings power collapses in any credit downturn — with D/E 2.70x and beta 2.29, drawdowns will be severe. Biggest structural risk: a credit cycle turn combined with ABS spread widening would simultaneously compress originations, book-value marks, and multiple.
Revenue quality is the strongest line in this story: TTM revenue $1.17B with sales +57.7% Y/Y and Q1'26 revenue $308M (+44% Q/Q, +12% Q/Q sequentially over Q4). But profitability is fragile — Q1'26 flipped back to a $6.6M net loss after two profitable quarters ($18.6M Q4'25, $31.8M Q3'25), and operating cash flow was -$133M in Q1 vs +$108M in Q4'25, showing the extreme quarter-to-quarter volatility characteristic of a balance-sheet-light loan platform whose OCF depends on the timing of forward-flow sales. TTM FCF is -$313M. Balance sheet carries $1.94B total debt against $733M equity (D/E 2.70x) and $475M cash — a leverage profile that only works if ABS/forward-flow channels remain open. Gross margins are optically high (83-98% depending on source) but operating margin is only 0.9% and ROE 7.0% on a 74x trailing P/E — the valuation implies a return to and sustainment of 2021-era profitability that has not been demonstrated. Forward P/E of 8.5-15x is only credible if the $3.37 forward EPS actually prints; consensus expects +111% EPS growth next year, which is aggressive after the Q1 miss.
The technical picture is broken across every timeframe visible. On the 1h chart, price cascaded from ~$37 (early July) to $28.60 with a sharp gap-down through the ~$31 structural support that had held multiple times. The 4h and 1d views confirm this is a decisive break of a range that has contained UPST since April, with price now sitting 11.5% below SMA20, 8.4% below SMA50, and 22.3% below SMA200. RSI 37 is weak but not yet oversold. The weekly chart shows the stock back at the lower end of its 2024-2026 base ($24-$80 range), with the 52w low at $23.97 as the next real support. The model's forecast bands are notably bullish across all horizons ($31-$39 range vs $28.60 spot), but the realized directional accuracy on this name is 17% (1d) and 33% (1wk) vs naive baselines of 85% and 100% — the forecast is materially worse than assuming price stays put, so I discount it heavily. Momentum is negative into a binary event, which historically is a bad setup on this name.
The news flow is bifurcated. Positive: renewal of the $600M Neuberger forward-flow agreement (June 24) is a genuine funding-channel signal, and Citi maintained Buy at $61 while Goldman raised to $39 (Neutral) — sell-side is not capitulating. Analyst target of $38.88 sits 36% above spot, and EPS estimates for next year have been revised up materially (+20.9pp on June 25, +7.4pp on July 9). Negative: multiple Zacks pieces flagging the stock's underperformance versus the market, Citi lowering its target from $80 to $61, and Simply Wall St calling the stock "fully valued" even after a 75% five-year decline. The core signal is that capital-markets news is supportive but operating/valuation commentary is skeptical — consistent with the historical lesson that funding announcements move UPST more reliably than earnings themselves. Retail sentiment is 100% bearish in the small sample available.
- $600M Neuberger forward-flow renewal (announced June 24, 2026) restores institutional take-out capacity
- $200M Wafra auto forward-flow agreement broadens funding beyond personal loans
- UPST Securitization Trust 2026-3 (Aug 20) — 51st ABS issuance, near-term pricing catalyst
- Cashline revolving credit product (launched May 2026) expands TAM beyond installment loans
- National bank charter application (filed March 2026) — if approved, deposits lower cost of funds structurally
- Model 22 AI underwriting upgrade (+1.4pp accuracy improvement) improves approval/loss rates
- EPS estimates for next year revised up +28pp cumulatively over 45 days
- Aug 4 binary earnings print with 31.5% short float — gap risk in either direction of 15%+
- Q1'26 OCF of -$133M with no confirmed path to sustained positive cash generation
- 74x trailing P/E and 59x EV/EBITDA leave zero valuation cushion for any operating miss
- $1.94B total debt vs $733M equity (D/E 2.70x) — highly dependent on open ABS/warehouse channels
- Technical break of $31 support opens path to $23.97 52w low if earnings disappoint
- Model's own directional forecast is beaten by naive baseline (17% vs 85% at 1d) — its bullish tilt should be discounted
- Beta 2.29 amplifies any broader risk-off move; -34.5% YTD, -64% YoY show the vulnerability
- Credit cycle turn would simultaneously hit originations, gain-on-sale margins, and loan marks
Get AI analysis on any stock
This is one of hundreds of Kronos AI reports — scored fundamentals & technicals, bull/base/bear price targets, a multi-horizon plan, and continuously-updated forecasts across the market. Create a free account to explore them all.
Create your free account →Already a member? Sign in · Join our Discord