UPST — AI Stock Forecast & Price Targets
Published 7/21/2026 · A free sample of K3vl4r’s AI-powered analysis.
Kronos price forecasts, scored fundamentals & technicals, and a multi-horizon plan.
View the live UPST price forecast →
UPST has broken through the $31 structural support flagged in prior work and now sits at $28.82 with RSI 36.9, below all major SMAs, and 13 days from a binary Aug 4 earnings print. The core tension is unchanged — reaccelerating revenue (+57.7% TTM, +44% Q/Q) and improving funding channels (Neuberger $600M renewal, upcoming ABS 2026-3) versus -$133M Q1 OCF, 74x trailing P/E, and 31.54% short float — but the tape is now confirming the bearish side, and the model's own directional accuracy (38% vs 63% naive baseline) says its bullish forecast should be discounted.
Stance into earnings: HOLD/AVOID new size. With the print 13 days out, RSI 36.9, price below all SMAs, and structural $31 support already broken, the tape is telling you longs are exhausted and the model's 1.00 bullish probability is unreliable (beaten by naive baseline). Do not initiate a swing long here. For existing holders, tighten stops below $27; a decisive break of $27.50 targets the $23.97 52w low. For traders, no short — 31.54% short float + 5.70 short ratio into a binary event is a squeeze trap (the roundtable context specifically flagged this). Reduce or defer sizing until either (a) a reclaim of $31 on volume pre-print, or (b) post-earnings clarity on Aug 4. Invalidation for any bullish tactical view: failure to hold $27.
1-6 month base case is range-bound $27-38 with the earnings print as the pivot. Bull path requires OCF turning positive, GAAP net income holding, and management reaffirming the $1.4B FY26 revenue guide — that reopens $38-42 and eventually the analyst consensus around $40. Bear path is OCF stays negative or credit disclosures show delinquency creep — that likely takes the stock to $22-24 with 15.21x forward P/E offering only modest support given the debt load. Expected return range from $28.82: roughly -20% to +35% skewed by the earnings gap. Would change mind bullishly on: (1) OCF inflection to positive, (2) confirmed ABS 2026-3 pricing at tight spreads Aug 20, (3) bank charter progress. Bearishly on: rising delinquencies, forward-flow funding wobble, or a guide-down.
1-3 year terminal thesis: UPST is a call option on AI underwriting displacing traditional FICO-based lending. If Model 22 (+1.4pp accuracy) and the coming bank charter deliver, unit economics improve materially and the platform can compound at the ~35% revenue CAGR the deep research cites. If they don't — or if the credit cycle rolls before profitability inflects — the 2.70x D/E and 2.29 beta make this a serial multi-compressor like it's been since 2021 (-75.5% 5Y). Biggest structural risk is dependence on capital markets: the business is a capital-markets-conduit disguised as a tech platform, and ABS spread widening or warehouse pullback can kneecap origination volume overnight. Multi-year drivers to watch: bank charter approval, auto/HELOC penetration, and durable positive OCF.
Top-line is genuinely reaccelerating — TTM sales +57.69% Y/Y, Q1'26 revenue growth cited at 64% with 86% origination growth and $4B of new committed capital — and gross margin remains at 97.87% given the platform model. But quality metrics are thin: operating margin only 3.48%, profit margin 4.34%, ROE 7.01%, ROIC 1.83%, and EPS Q/Q -163.85% shows how volatile the bottom line is. The balance sheet carries D/E 2.70 and LT D/E 2.69, though liquidity is adequate (current/quick 4.03, cash/share $9.73). The most important negative remains negative operating cash flow (-$133M in Q1'26) — you can't underwrite 15x forward P/E on a name that is burning cash while revenue accelerates unless the next few prints show OCF inflecting. Capital allocation shows a $100M buyback in Feb'26, which is defensible at these prices but modest against the cash burn. Forward P/E 15.21 and PEG 0.62 look attractive on paper, but only if forward EPS estimates (which have been rising — next Y +110.88% and repeatedly upgraded) actually print.
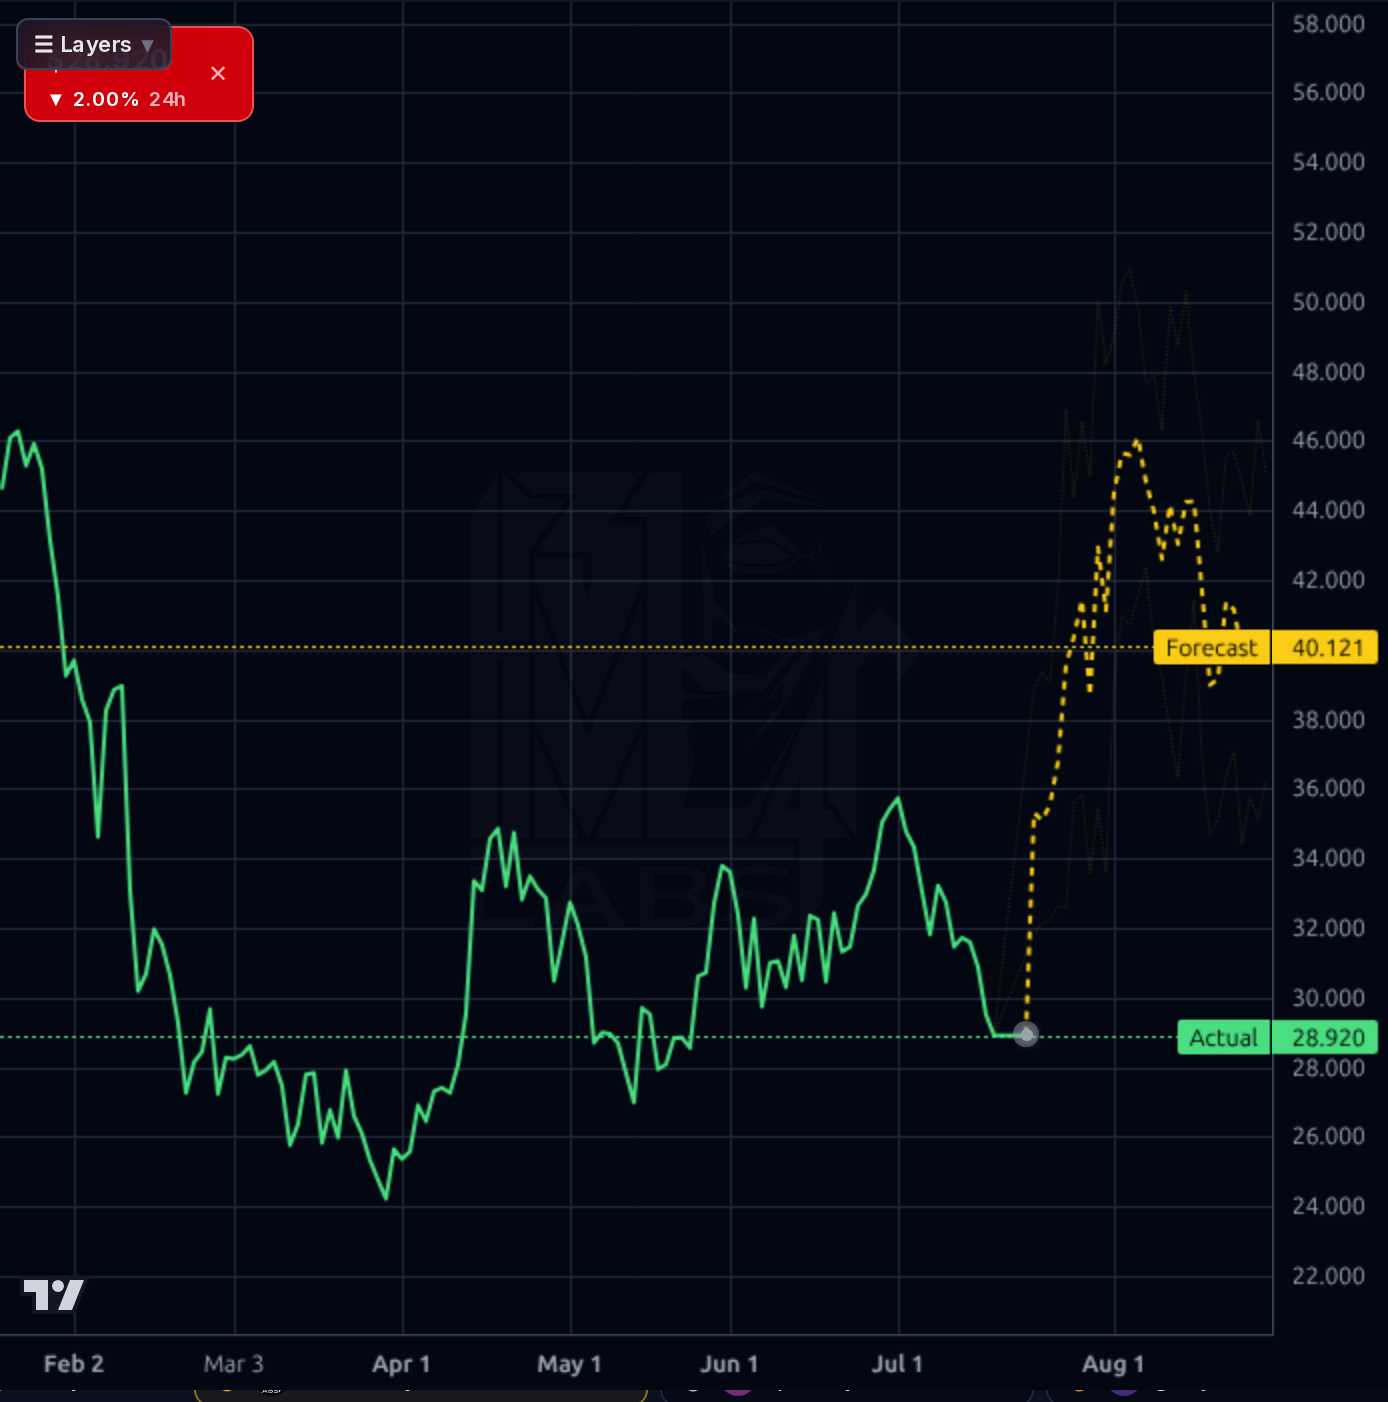
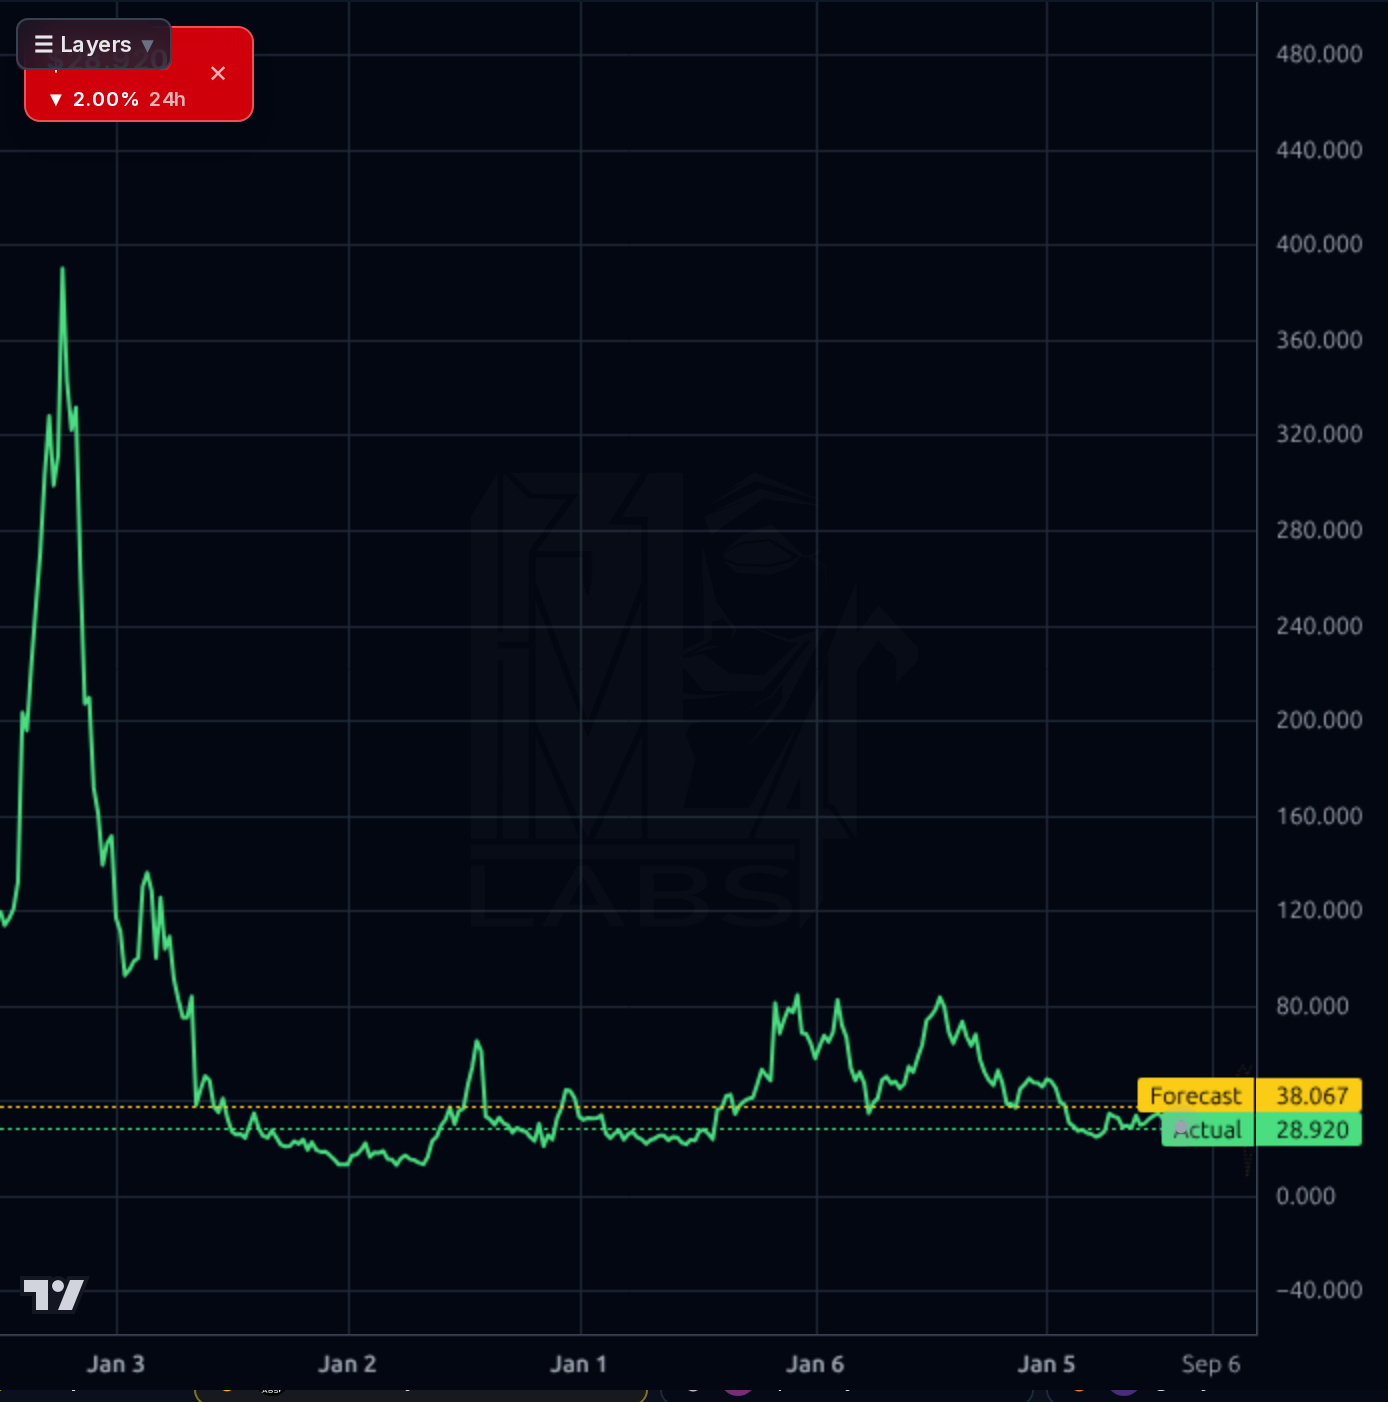
The chart is broken in the short/intermediate term. Price at $28.82 is -11.62% below SMA20, -7.83% below SMA50, and -22.35% below SMA200 — a full downtrend stack. RSI 36.9 is weak but not yet washed out. The 1d chart shows a clean rejection from the ~$46 area with a rapid slide to fresh short-term lows, and the forecast band's 40.12 print is now ~40% above spot — the model has been systematically too bullish here (its 1d directional accuracy 38% is below the 63% naive baseline, and 1wk 67% vs 83% naive). The weekly view frames why longs are fatigued: -75.5% over 5Y, -63.22% YoY, -34.10% YTD. Key levels: immediate support at the 52w low $23.97 (only 20% away, and realistic given -8.39% weekly momentum), overhead resistance stacks at $31 (prior support flip), $33 (SMA50 zone), then $35-38. ATR 1.99 on a $28 stock is ~7% daily range — position accordingly. The setup into earnings is bearish drift with squeeze risk given 31.54% short float and 5.70 short ratio.
Signal: the fundamental catalyst path is legitimate — Neuberger renewed a $600M forward-flow deal (June 24), BTIG raised its target to $39 (July 9), Needham raised to $40 (July 7), and management is pursuing a national bank charter that could structurally lower cost of funds. Deep research also flags a planned UPST 2026-3 ABS on Aug 20 and 'Cashline' unsecured revolving credit as product expansion. EPS-estimate revisions have been running L2 bullish (+15-21pp on next-Y estimates) for weeks, which normally leads price. Noise: TV mentions are incidental (an ETF reference, unrelated 'upstart' phrasing). Retail sentiment is 50/50 with one alarming individual message that should not influence positioning. The consensus 'Buy' anchor at $40 target implies ~39% upside, but consensus has been consistently late on this name, and analyst upgrades have not been enough to offset the -34% YTD drawdown. The dominant near-term signal is the Aug 4 print: it will decide whether Q1's OCF hole was a working-capital blip or a structural break, and any 1-4 week trade is ultimately a bet on that binary.
- Aug 4 Q2'26 earnings — sole near-term catalyst; consensus expects EPS 61% Y/Y increase and reaffirmation of ~$1.4B FY26 guide
- UPST Securitization Trust 2026-3 scheduled Aug 20 — 51st ABS issuance; pricing/spread will validate institutional funding health
- $600M Neuberger forward-flow renewal (June 24) restoring take-out capacity for personal loans
- National bank charter application (filed March 2026) — if approved, structurally lowers cost of funds via low-cost deposit access
- 'Cashline' unsecured revolving credit product launched May 8 — first product expansion beyond installment lending, expands TAM
- Model 22 AI underwriting engine — cited +1.4pp accuracy improvement, supports approval rate and loss performance narrative
- Auto lending scale-up backed by $200M Wafra forward-flow agreement — diversification off personal loans
- Negative operating cash flow (-$133M Q1'26) with no confirmed path to inflection — earnings Aug 4 is the binary test
- Trailing P/E 74.4x and EV/EBITDA 59.6x leave zero cushion if guide or credit metrics disappoint
- D/E 2.70 with a business model dependent on ABS spreads and warehouse appetite — funding-cycle risk
- Beta 2.29 in a risk-off tape with breadth deteriorating (49.7% >200dMA) amplifies drawdowns
- Short float 31.54% + 5.70 short ratio into earnings = binary gap risk in either direction
- Broken technicals: below SMA20/50/200, structural $31 support failed, -34.1% YTD momentum
- Model 22 accuracy claims and Q1 origination growth have not yet translated to GAAP profitability durability
- Bank charter approval timeline is uncertain — competitive/regulatory approval risk
- Prior-cycle history: -75.5% over 5 years shows how brutally multi-compression can play out on this name
Get AI analysis on any stock
This is one of hundreds of Kronos AI reports — scored fundamentals & technicals, bull/base/bear price targets, a multi-horizon plan, and continuously-updated forecasts across the market. Create a free account to explore them all.
Create your free account →Already a member? Sign in · Join our Discord