UPST — AI Stock Forecast & Price Targets
Published 7/14/2026 · A free sample of K3vl4r’s AI-powered analysis.
Kronos price forecasts, scored fundamentals & technicals, and a multi-horizon plan.
View the live UPST price forecast →
UPST sits at critical structural support ($31-32) after a 4.4% drop, three weeks ahead of an August 4 earnings print that will decide whether Q1's swing to a $6.6M loss and -$133M OCF was a blip or a trend. Revenue reacceleration (+58% TTM Y/Y, +44% Q/Q sales) and forward-flow renewals are real positives, but at 81x trailing P/E with 31.5% short float and negative FCF, the stock is priced for execution it hasn't proven. Prior optimistic base targets in the $38-39 range have failed to print; a more realistic setup is range-bound $28-38 into the print with binary risk beyond.
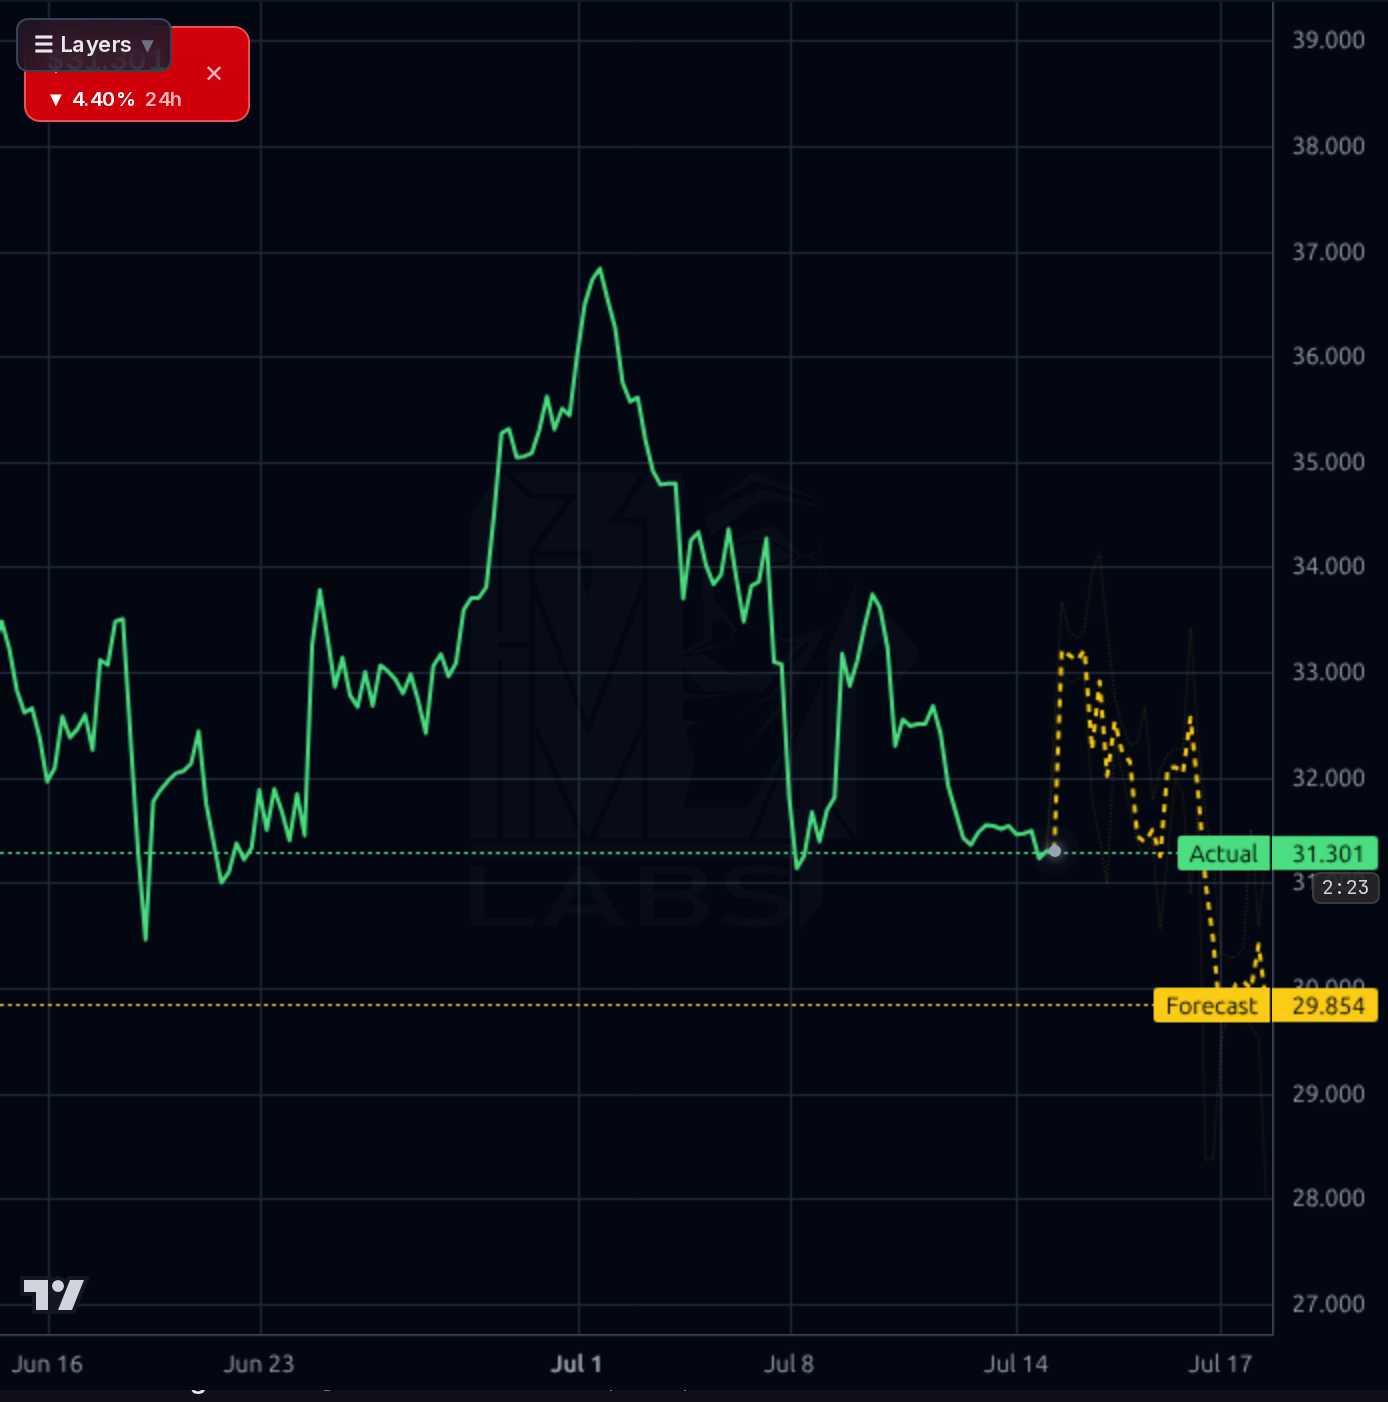
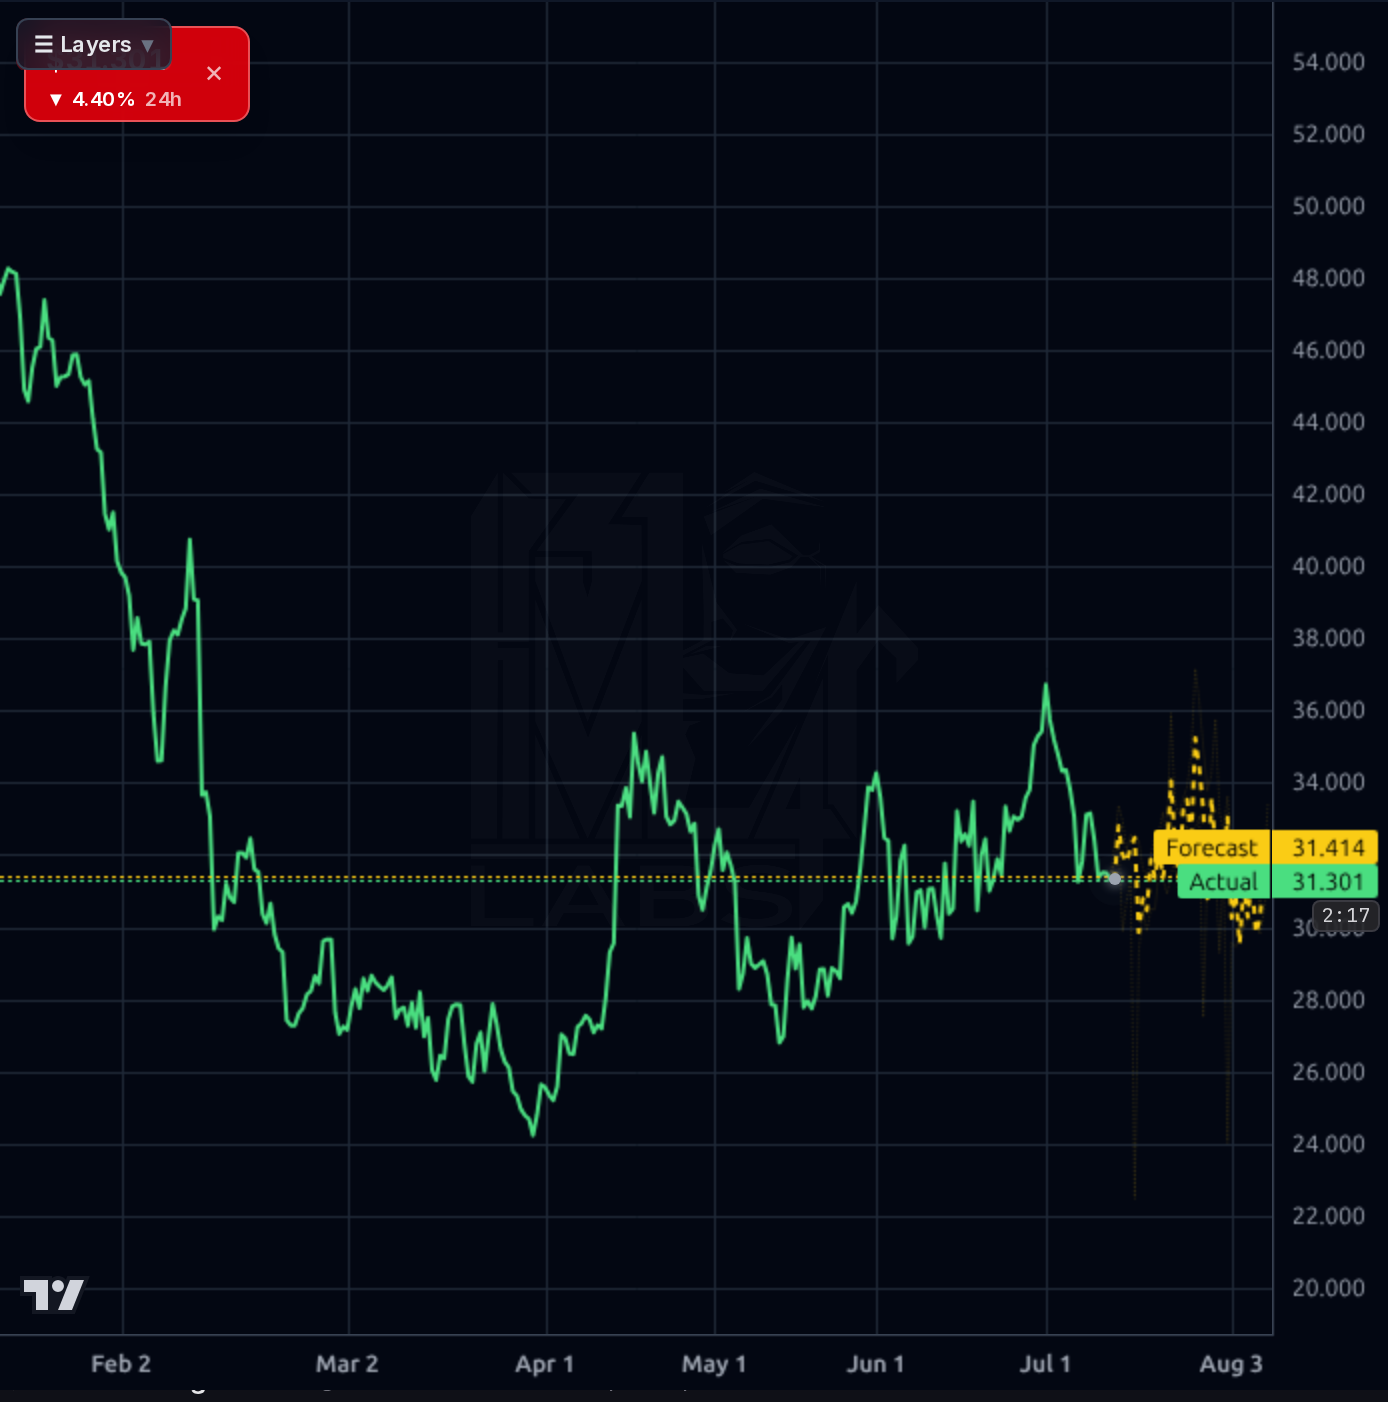
HOLD/DO NOT initiate new swing positions with earnings 21 days out. Price is on structural $31-32 support with the 1h forecast pointing lower to $29.85. If you must trade, a tactical long only works ABOVE $32.50 reclaim with a stop at $30.80, targeting $34-35 into the print — but size it as a lottery ticket (0.5-1% risk), not a swing. Below $30.80 the setup breaks toward $28. Do NOT hold size through the print — IV crush plus a ~30% short float sets up violent two-way risk. Invalidation for any bullish tactical read: close below $30.
HOLD, with a bias to accumulate on weakness below $28 IF Aug 4 delivers OCF improvement and a return to GAAP positive net income. Expected 6-month range $28-42 with a base case around $34. Catalysts: earnings print (binary), any additional ABS securitization or forward-flow announcements post-print, Fed rate trajectory. What would change my mind to BUY: OCF turning meaningfully positive AND delinquency data stable — signaling the funding flywheel is durable, not sponsored. What would flip me to SELL: OCF stays worse than -$50M, or credit performance deteriorates, or forward guidance cuts.
The 3-year thesis rests on Upstart proving its AI underwriting can deliver superior loss-adjusted returns through a full credit cycle — something it has NOT yet done. If the model works, TAM expansion into auto, HELOC, and small-dollar lending justifies a much higher revenue base and eventual GAAP earnings power that could support $60-80. If it doesn't, the platform is a capital-markets-dependent originator with 2.7x leverage and no moat vs banks who now use similar ML underwriting. Biggest structural risk: a credit cycle downturn that widens ABS spreads and causes institutional take-out capacity to evaporate — a scenario UPST has never navigated as a public company at scale. Position sizing should reflect binary long-term outcomes.
Revenue is genuinely reaccelerating — TTM sales +57.7% Y/Y, Q1 2026 revenue of $308M (+44% Q/Q vs $257M in Q2'25), and gross margin remains structurally high at ~83% (Finviz shows 97.9% on a different definition). But the profitability picture is deeply lumpy: quarterly net income went $5.6M → $31.8M → $18.6M → -$6.6M, and Q1 2026 operating cash flow collapsed to -$133M (vs +$108M in Q4). TTM free cash flow is -$313M. Balance sheet shows $475M cash against $1.98B total debt (D/E 2.70x, LT D/E 2.69x), though this debt is largely warehouse/loan-related rather than corporate. The 81x trailing P/E and 16.5x forward P/E look punchy against just 4.3% profit margin and 7% ROE, but the PEG of 0.67 and +110% next-year EPS estimate (which just got upgraded from 103% to 110%) show the market is anchoring to a forward earnings ramp. What's working: revenue growth, funding channels (Neuberger $600M forward-flow renewal), analyst EPS revisions. What's broken: cash generation, GAAP consistency, leverage.
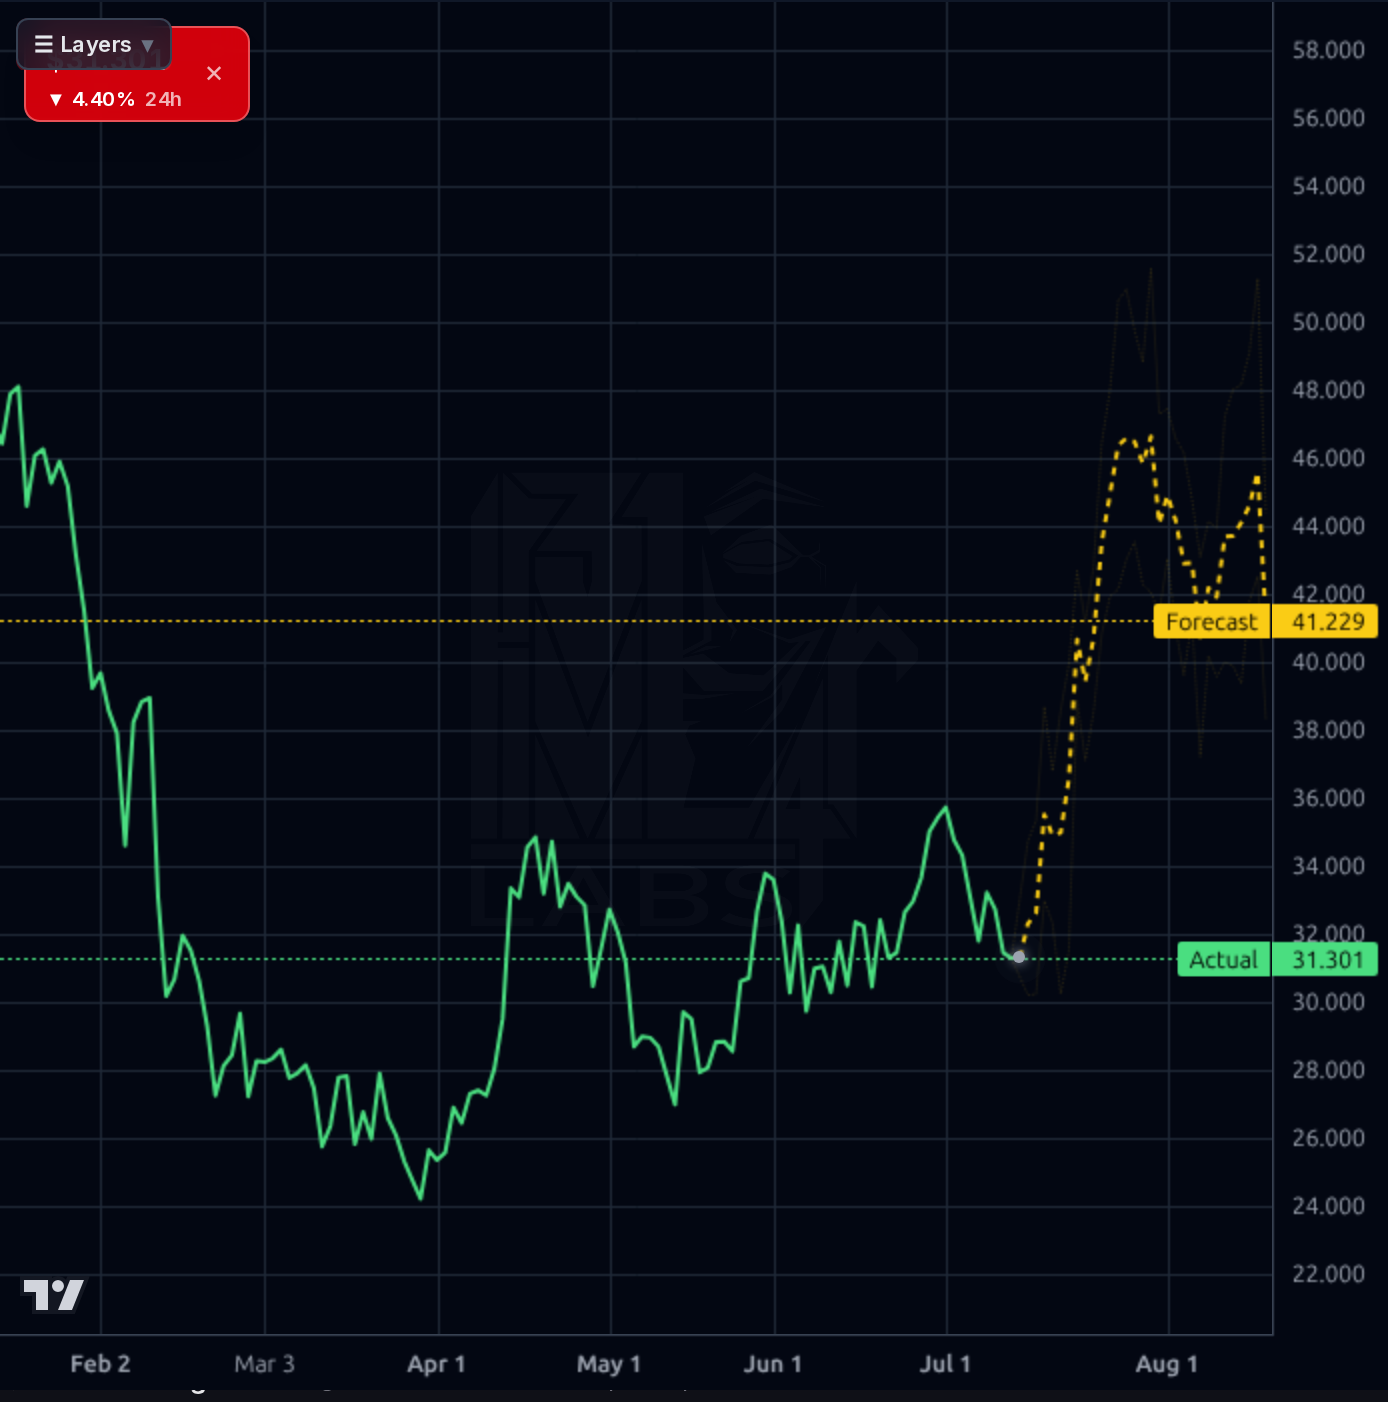
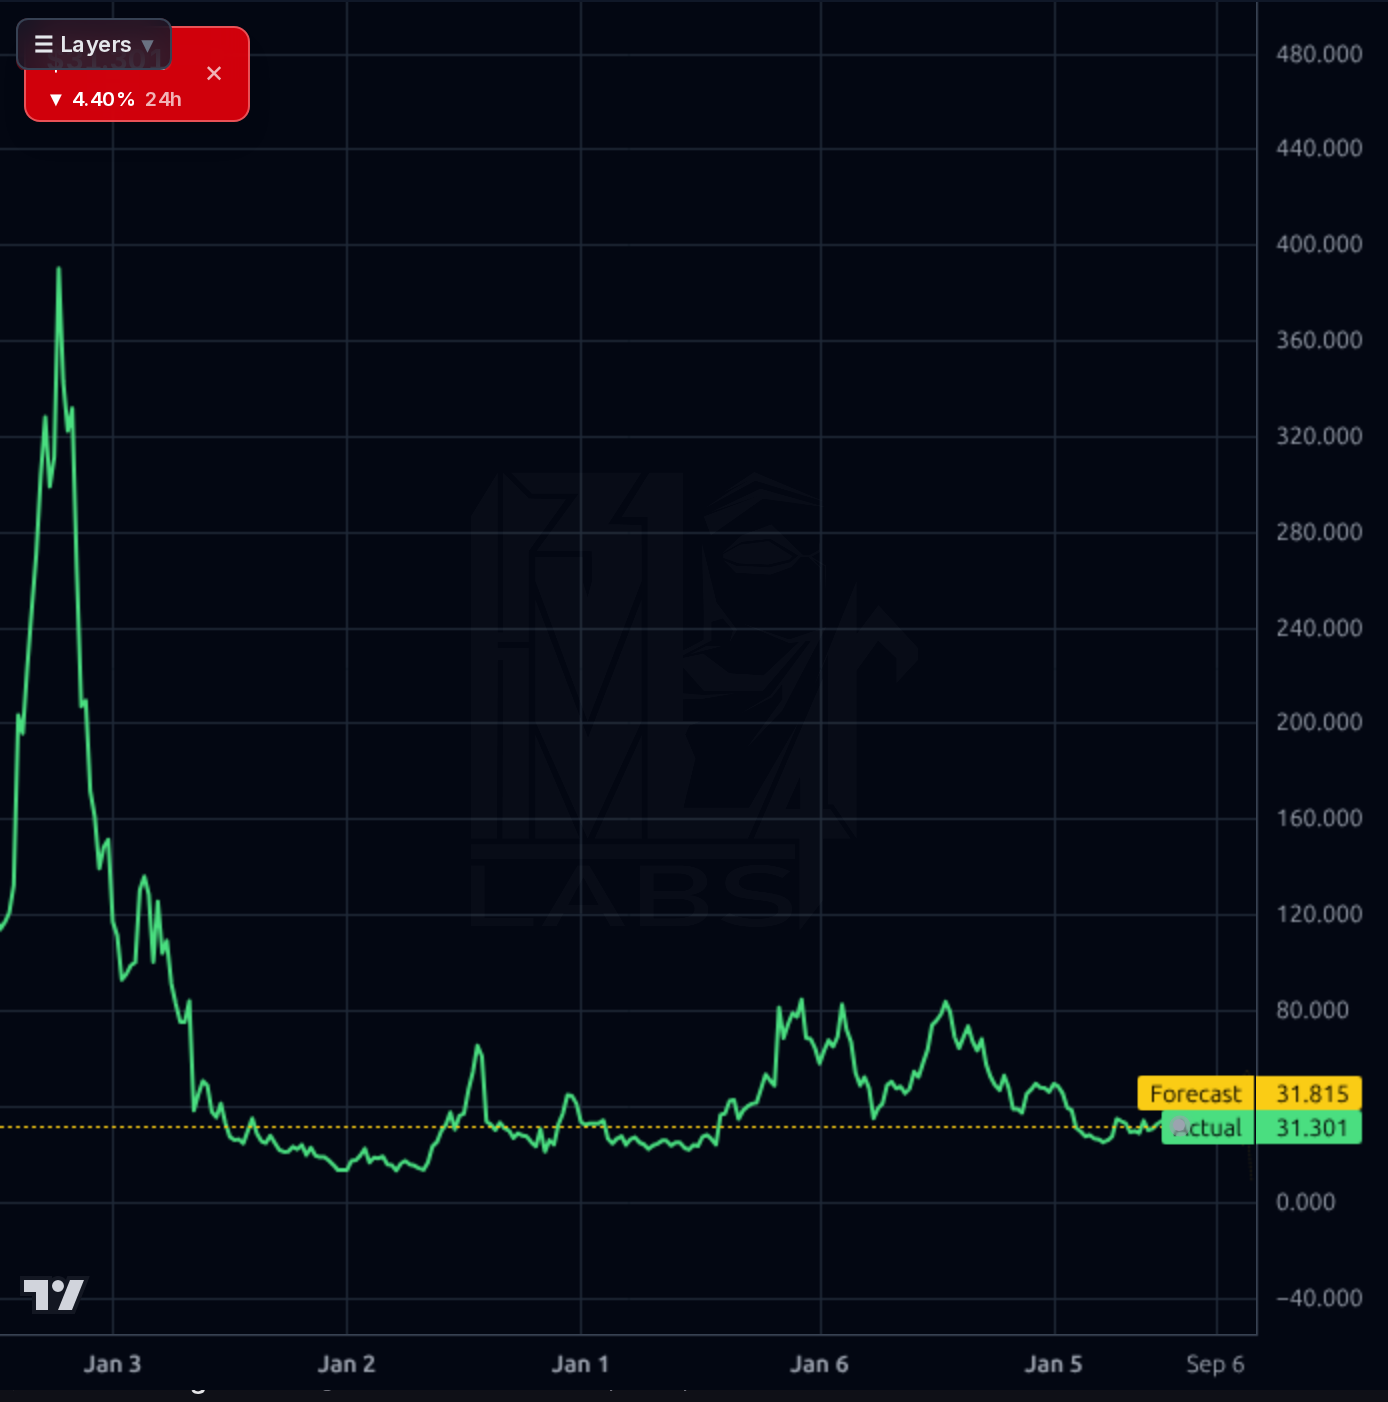
Across timeframes the picture is deteriorating short-term within an improving intermediate structure. On the 1h and 4h charts, price broke down from the ~$37 early-July peak and is now testing $31.30 — the exact prior support shelf from late June/early July. The 1h Kronos forecast points DOWN to $29.85 (below current), and 4h forecast band widens to $30-35 around $31.41 — essentially flat with a downward skew. The 1d chart shows the aggressive symmetrical triangle breakout that Simply Wall St flagged, with the model projecting $41.23 over ~3 weeks — but that's an outlier vs the shorter timeframes and the 1wk directional accuracy (67%) is actually BELOW the naive baseline (83%), so I discount it heavily. RSI 45.9 is neutral, price is -4.3% below SMA20 and -16.7% below SMA200 but +0.4% above SMA50 — a market losing its short-term momentum but not yet broken. Perf Week -8.4% shows sellers have taken control into earnings. Key levels: $31 hard support (must hold), $30 (yellow forecast floor + psychological), $28 next shelf, $24 = 52w low. Upside: $34 recent resistance, then $37 recent high, then $40 (analyst target cluster).
The news flow is genuinely constructive on the funding/capital-markets side that the dossier identifies as the most reliable positive catalyst: Neuberger renewed a $600M forward-flow agreement (June 24), and analyst price targets have been raised (Goldman $32→$39 Neutral, Needham $37→$40 Buy, BTIG reiterated $43 Buy). Simply Wall St highlighted the technical breakout from a symmetrical triangle. SeekingAlpha's July 3 note explicitly warned of a 'potentially lumpy Q2 2026,' which is consistent with the Q1 OCF collapse. Signal vs noise: the analyst upgrades and forward-flow deal are real fundamental improvements to the funding stack. The Zacks 'trending stock' pieces are noise. Retail sentiment (33% bull / 67% bear on Stocktwits/X) is contrarian-supportive but low volume. Notably absent from news: any credit-performance disclosure ahead of the August 4 print, which is what actually matters.
- Neuberger $600M forward-flow renewal (June 24) — directly increases personal loan take-out capacity
- Multiple analyst PT hikes in July (Goldman $39, Needham $40, BTIG $43) reflecting improved forward earnings visibility
- Next-year EPS estimate revised UP twice in 45 days: 45.4% → 60.8% → 81.7% → and now 110.5% (July 9)
- Q1 2026 revenue $308M sequential from $276M — 44% Q/Q sales growth reflects platform reacceleration
- Product expansion into auto secured loans and HELOCs broadens TAM beyond core unsecured personal
- Reported June loan originations ~50% higher Y/Y (social/retail chatter, unconfirmed but consistent with trend)
- Q1 2026 operating cash flow of -$133M and TTM FCF of -$313M signal continued capital consumption
- 81x trailing P/E and 16.5x forward P/E leave zero cushion for any earnings miss or credit deterioration
- 31.5% short float and 5.4 short ratio create violent two-way risk into the Aug 4 print
- D/E of 2.70x means any tightening in ABS/warehouse markets hits liquidity fast
- Q1 swung back to a $6.6M net loss after Q4's $18.6M profit — profitability has NOT proven durable
- Beta of 2.27 means macro/rate shocks and geopolitical risk (Iran headlines) amplify drawdowns
- 1wk model forecast has been BEATEN by naive baseline in accuracy — the bullish $41 projection is unreliable
- Prior analyst calls on this name have systematically anchored to bullish targets ($38-48) that have failed to print
Get AI analysis on any stock
This is one of hundreds of Kronos AI reports — scored fundamentals & technicals, bull/base/bear price targets, a multi-horizon plan, and continuously-updated forecasts across the market. Create a free account to explore them all.
Create your free account →Already a member? Sign in · Join our Discord