UWMC — AI Stock Forecast & Price Targets
Published 7/23/2026 · A free sample of K3vl4r’s AI-powered analysis.
Kronos price forecasts, scored fundamentals & technicals, and a multi-horizon plan.
View the live UWMC price forecast →
UWMC sits at $1.84, a fresh 52-week low, with a mathematically stressed capital structure ($16.5B debt vs $229M equity, 329% dividend payout on -$2.23B Q1 OCF) heading into a binary Aug 6 earnings print in ~14 days. Strong Q1 origination volume (+39% YoY) and 20.9% short interest offer squeeze optionality, but sell-side cuts (PT $4.22→$3.98), rising short float, and a broken chart argue for standing aside; the forecast model has been beaten by a naive baseline and should be heavily discounted.
Stand aside into the Aug 6 print (~14 days). This is a binary event with high IV crush risk; sizing a directional swing here is a coin flip on dividend policy. If forced to act, only a tactical, tight-stopped long is defensible near $1.81-$1.85 with a hard stop below $1.79 (52-week low invalidation) targeting a mean-reversion to $2.05-$2.20; risk/reward is not compelling given trend. Do not chase any pre-earnings squeeze above $2.20 — 20.9% short float can cause spikes but they've faded repeatedly. Earnings stance: NO position through the print unless you accept ±30% gap risk.
1-6 months hinges almost entirely on the Aug 6 guidance. Base case: dividend is cut or suspended, stock gaps down initially but the removal of the payout overhang plus a credible balance-sheet plan allows a grind back to $2.10-$2.35 as short covering meets fundamental repair. Bear case: management defends the dividend without a credible OCF path, ratings/warehouse pressure builds, and the stock breaks $1.80 toward $1.40-$1.60. Bull case (lower probability): dividend suspension + upside origination guide + Fed rate-cut path drives a squeeze to $2.85-$3.20. What changes my mind: (a) suspension announcement with concrete deleveraging plan → constructive; (b) dividend maintained with continued negative OCF → decisively bearish.
1-3 year terminal thesis is a leveraged bet on the U.S. mortgage cycle. If rates normalize lower and refi volumes reflate, UWMC's dominant wholesale channel share, AI cost structure ('Mia' at 12M+ calls), and operating leverage could drive material earnings recovery, potentially back to $4-6 territory. However, the biggest structural risk is that the capital structure is so thin that a single adverse cycle event (warehouse pull, MSR mark-down, litigation) can wipe common equity before the cycle turns. This is a survival-first name — you can only own it if you underwrite the balance sheet, not the multiple.
Revenue is directionally healthy — TTM $3.61B with Q1'26 at $504M and Sales Y/Y TTM +37.1% — and Q1 origination volume of $44.9B (+39% YoY) confirms channel share gains. However, quality of earnings is poor: reported net margin is razor-thin (1.97% TTM), and cash generation is deeply negative with Q1'26 operating cash flow at -$2.23B and TTM FCF -$1.09B. The balance sheet is the core problem: total debt $16.5B against stockholders' equity of just $229M (D/E >1000%), quick and current ratios at 0.42, and cash of only $424M. On top of that, the trailing dividend yield of 21.7% represents a 329% payout ratio funded by financing, not operations — arithmetically unsustainable. ROE optics (33-40%) are flattered by minimal equity. Capital allocation is the central overhang: management must credibly address the dividend on Aug 6 or lose the last narrative prop. What's working: volume, gross margin (87%), AI-driven cost leverage via 'Mia'. What's broken: leverage, OCF, and payout math.
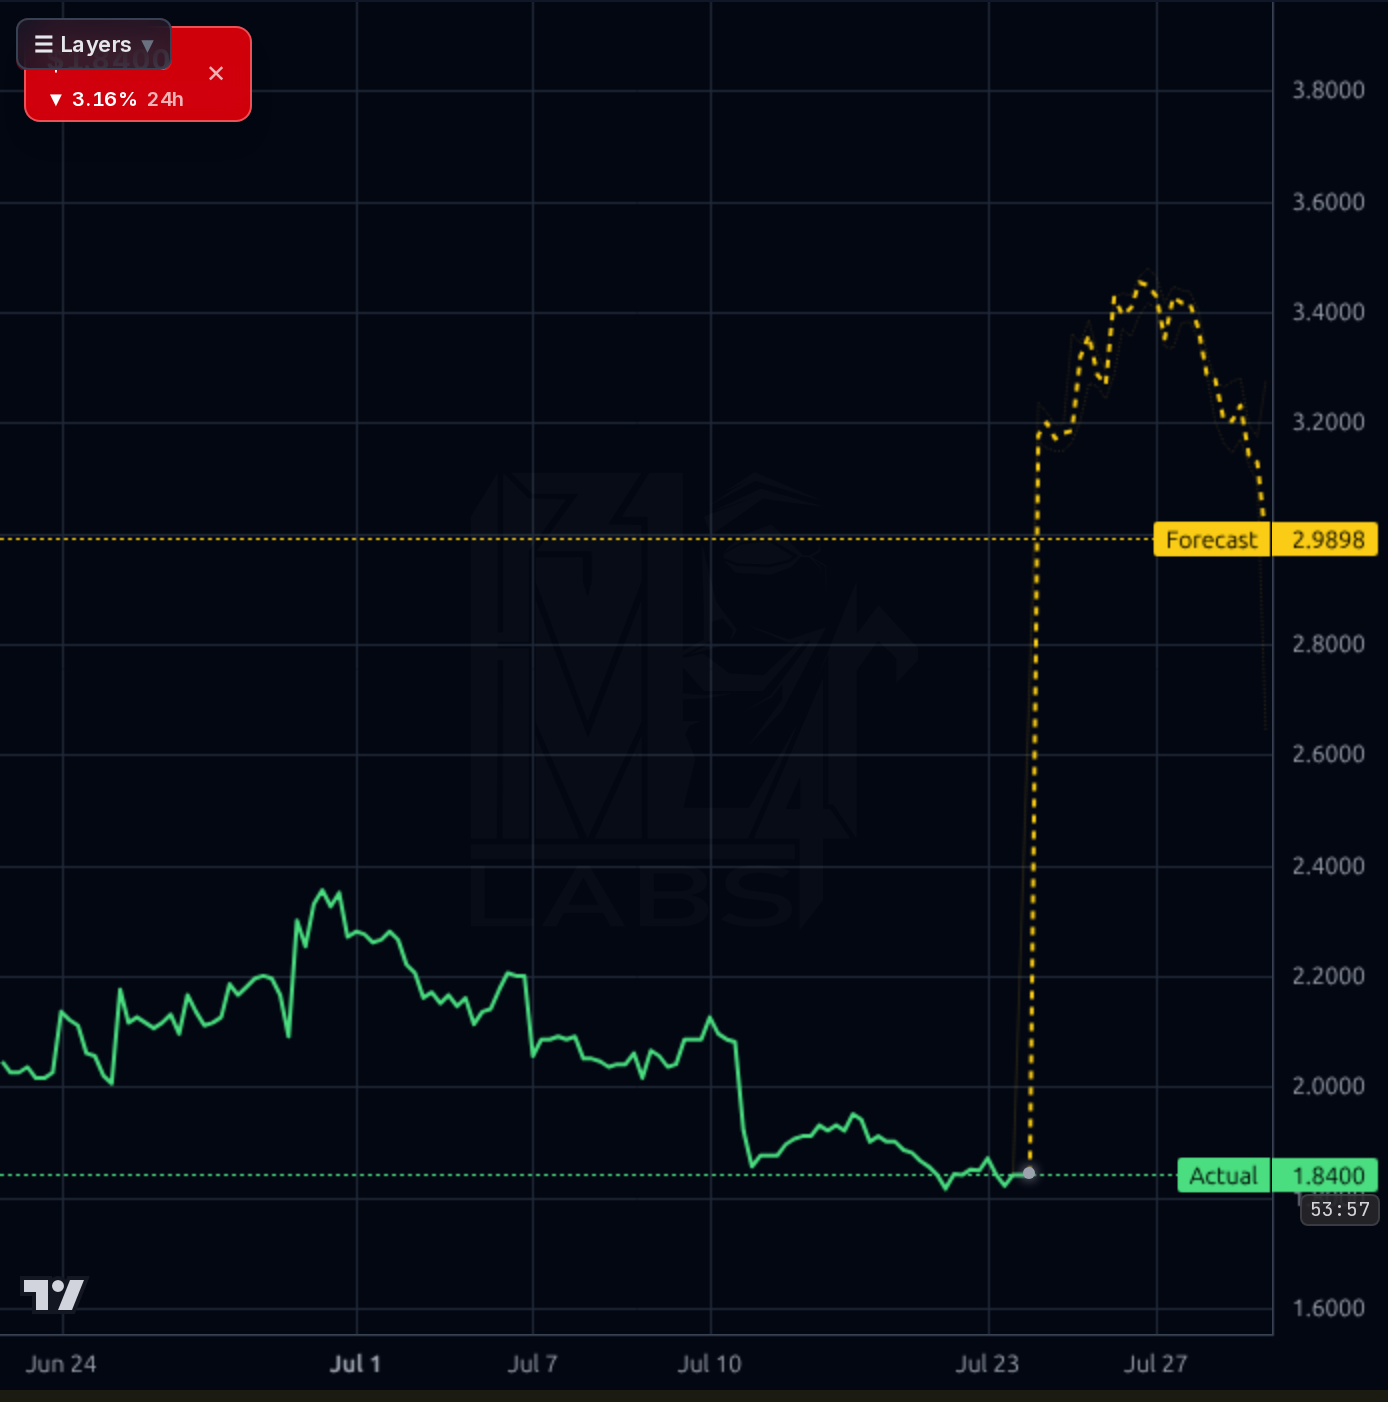
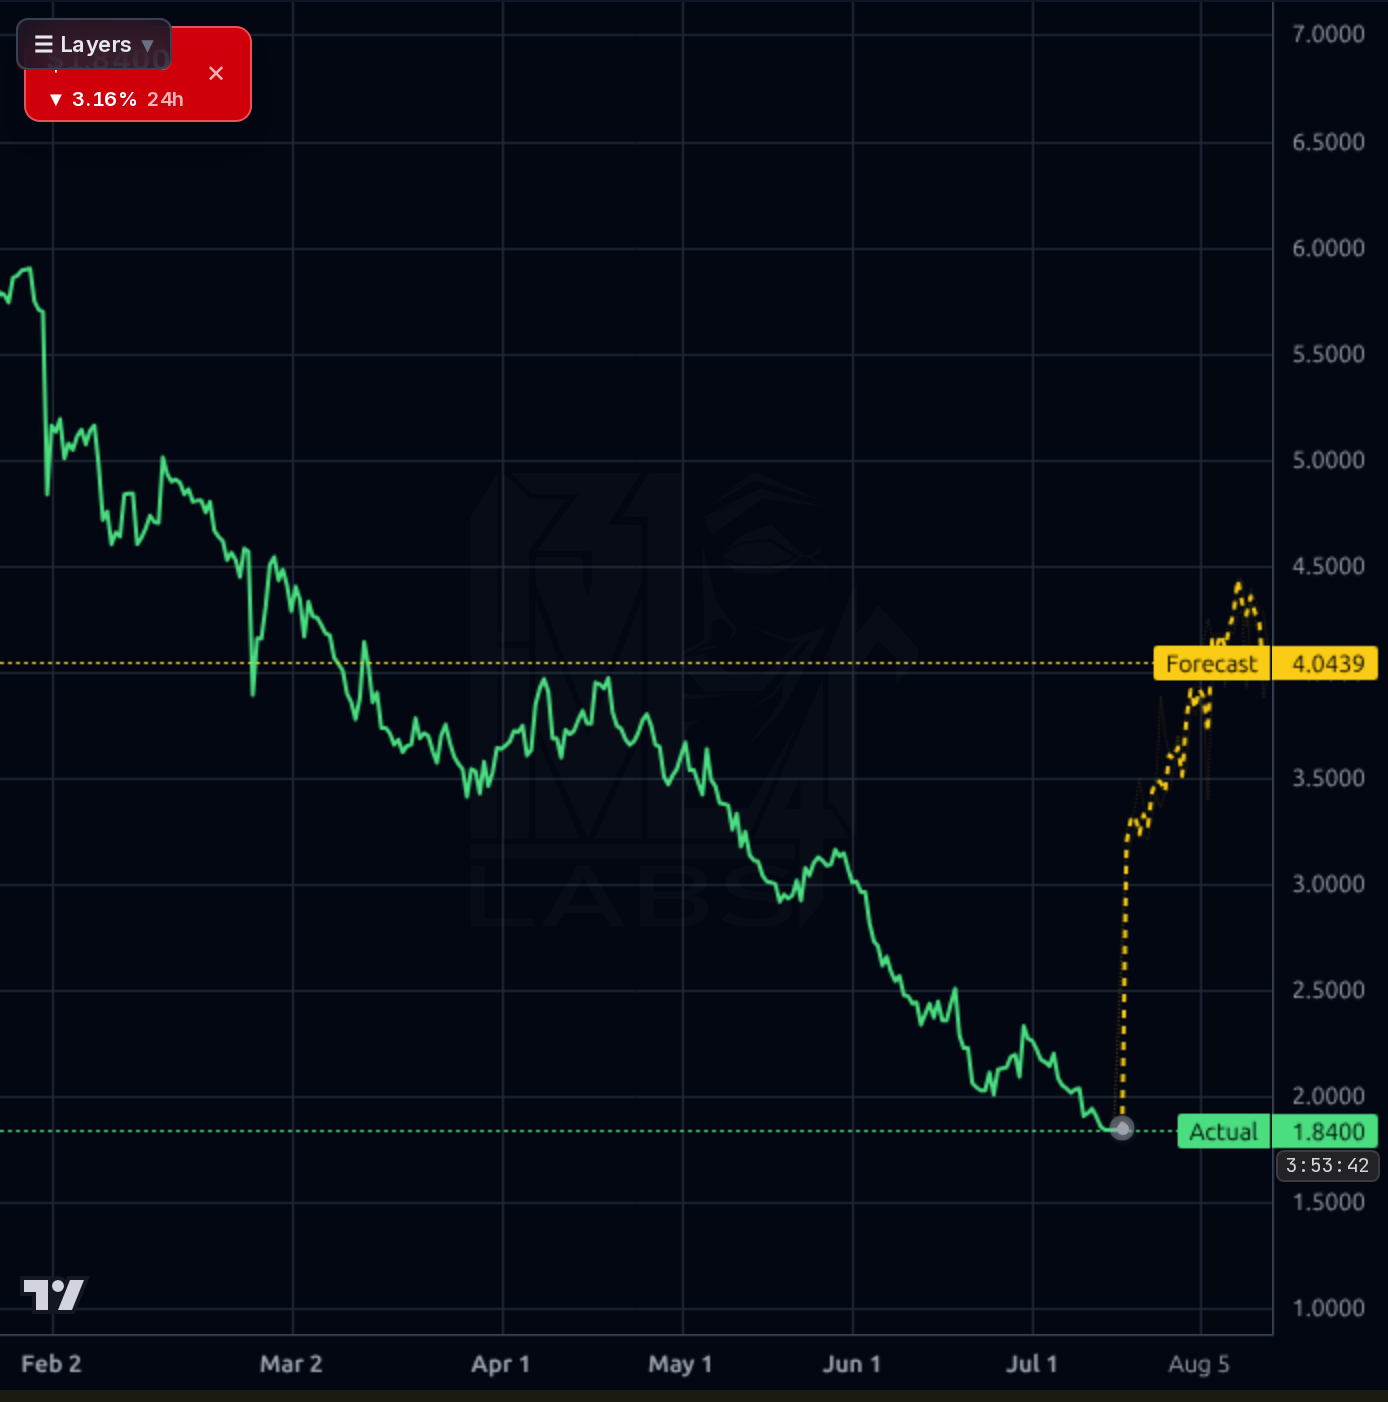
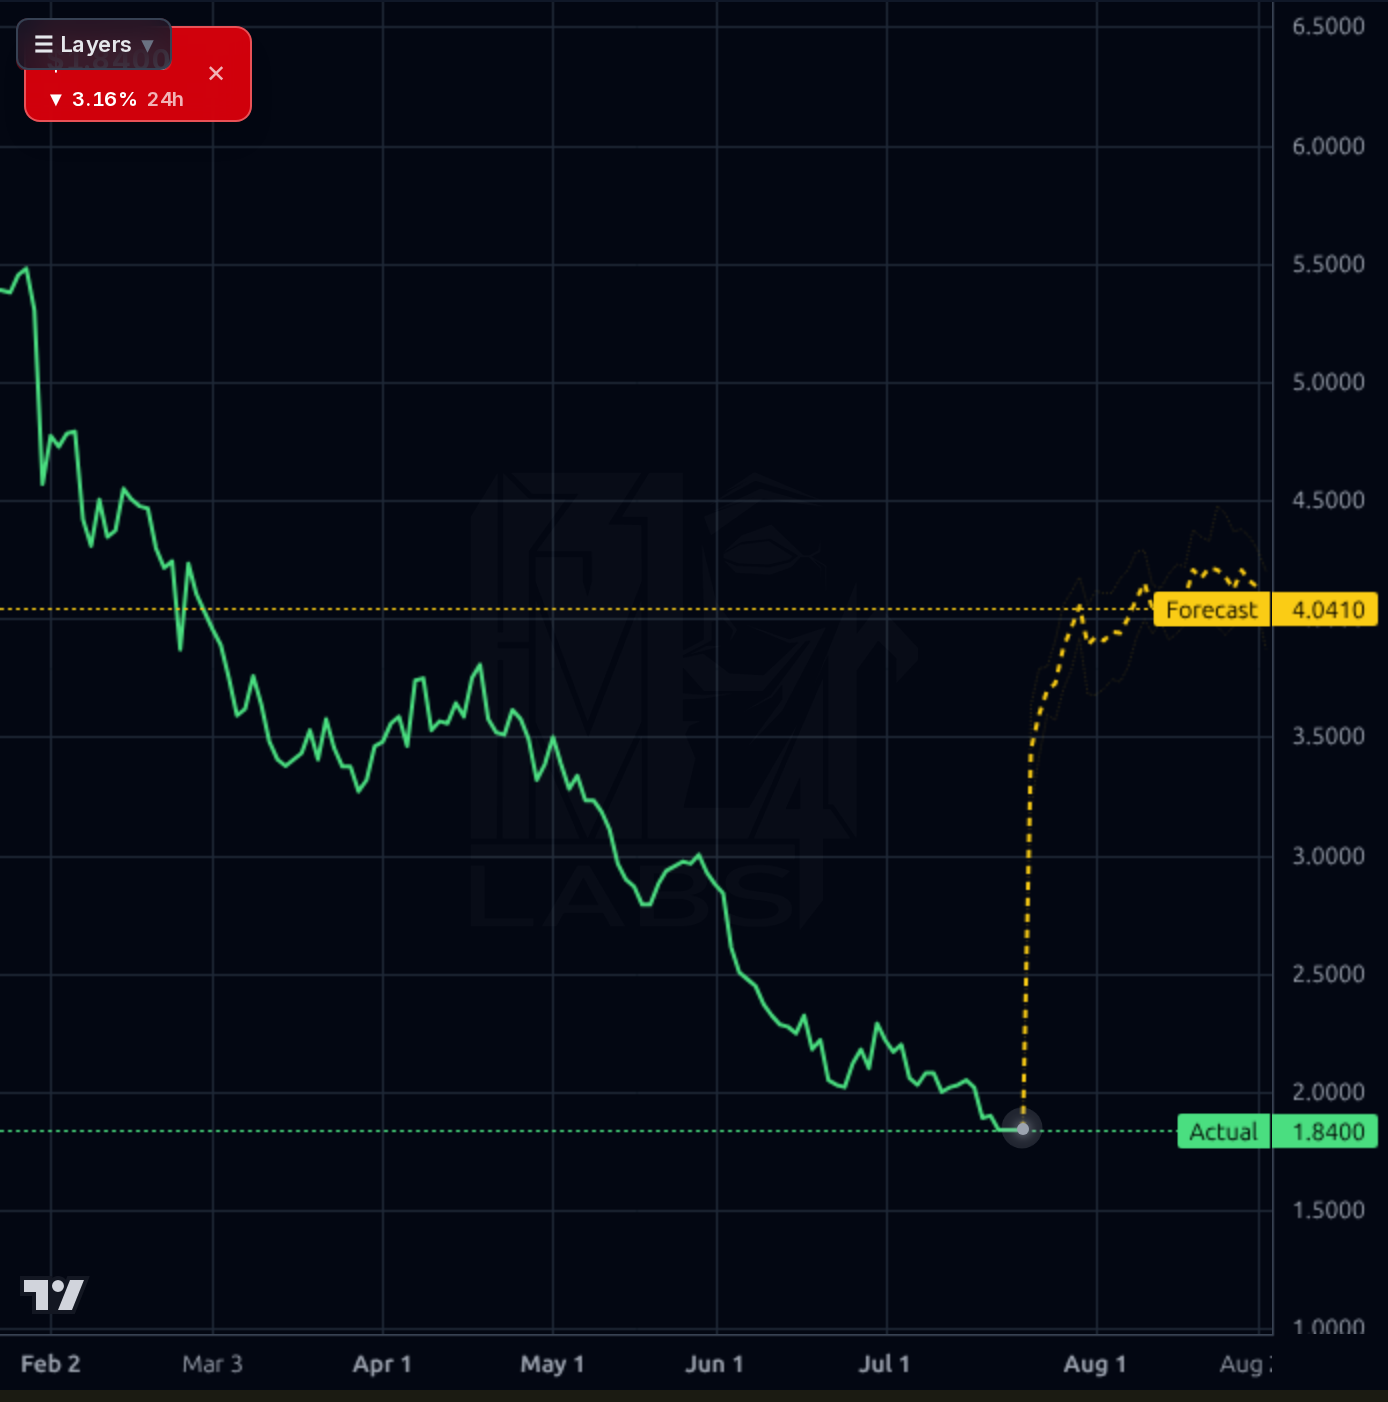
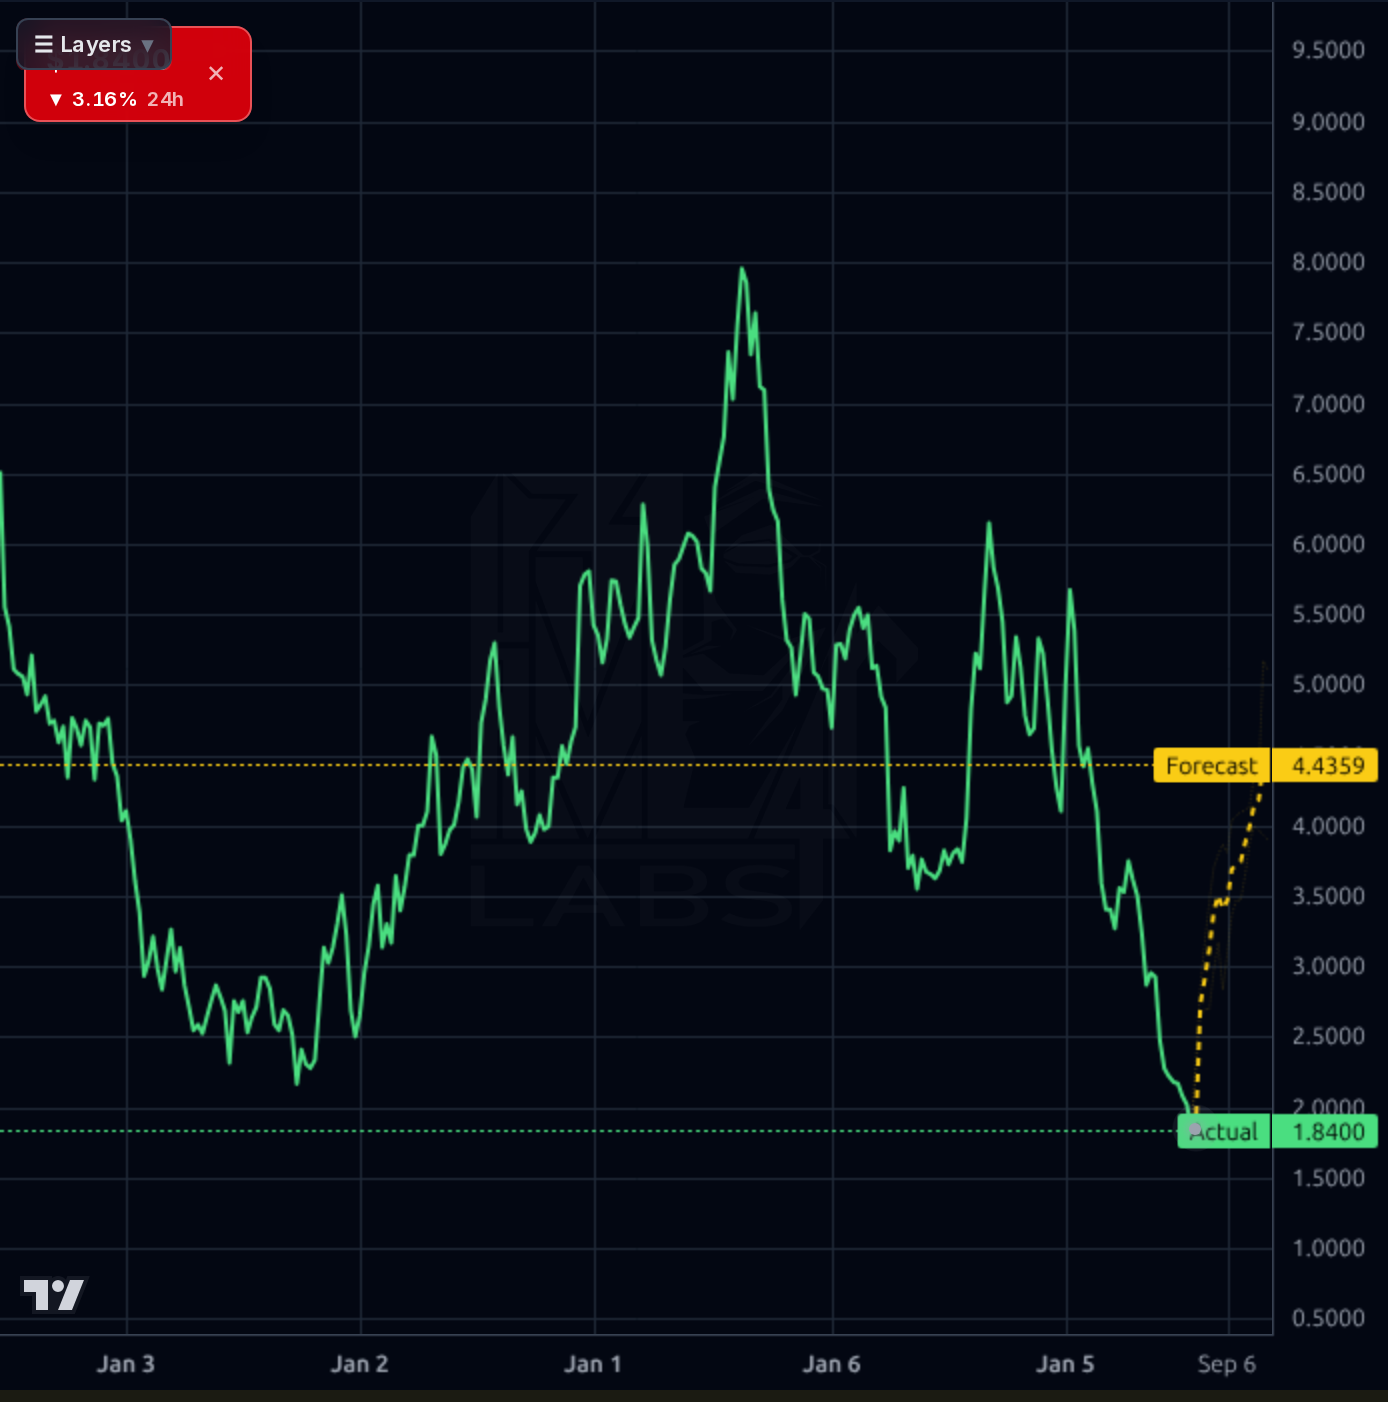
All four timeframes are structurally bearish. On the daily and weekly charts price sits at $1.84, essentially on the 52-week low ($1.815) after a multi-quarter downtrend from ~$7.14. SMA distances are punitive: -10.9% vs 20DMA, -25.8% vs 50DMA, -56.0% vs 200DMA, with YTD performance -58% and 6-month -68%. RSI(14) at 27.9 is oversold but oversold in a strong downtrend is not a reversal signal. The 1h chart shows a capitulation leg from ~$2.35 into $1.84 with no basing action yet. The model's forecast bands project sharp mean-reversion snap-backs (1h $2.99, 4h/1d ~$4.04, 1wk $4.44) — but realized directional accuracy for this name is 22% vs a 78% naive baseline at 1d and 0% vs 100% at 1wk, so the yellow bands should be treated as unreliable. Key support is the $1.81-$1.87 zone; a decisive break opens $1.50-$1.60. Resistance is $2.05 (recent shelf), then $2.20 and the 50DMA area near $2.45.
Signal: Morgan Stanley cut PT to $3 (from $5) on Jul 20 while maintaining Equal-Weight; Barclays trimmed PT to $4 (from $5) while keeping Overweight; KBW upgraded to Outperform in late June. The sell-side is bifurcated but consensus target has been steadily grinding lower ($4.22→$3.98 in ~45d). The Motley Fool piece explicitly frames the 19%+ yield as a 'warning, not a gift,' consistent with the payout math. The failed Two Harbors bid removed a potential MSR-scale catalyst and appears to be part of the June-July drawdown. Simply Wall St. notes a 60% five-year decline framing the discount narrative. Noise: Generic penny-stock chatter on social channels, broad-market earnings recaps (RTX, Comcast, Nasdaq) unrelated to UWMC. TV crawl airtime with no on-air discussion is pure attention, not information. Net: news flow is modestly bearish on price targets and dividend sustainability, with one contra upgrade — nothing changes the binary nature of the Aug 6 print.
- Q1'26 origination volume $44.9B, +39% YoY — highest Q1 in company history, evidencing durable wholesale channel share
- 'Mia' AI assistant scaling to 12M+ inbound/outbound calls in 2026, structurally lowering per-loan cost basis
- H2'26 Fed rate-cut optionality could unlock higher-margin refi volume on an already-scaled origination platform
- 20.94% short float with rising trend creates asymmetric squeeze setup if Aug 6 print removes the dividend overhang
- Forward EPS $0.47 vs trailing $0.30 implies analyst expectation of ~57% EPS growth (fwd P/E 3.9x if delivered)
- Dividend at 329% payout on -$2.23B Q1 OCF is arithmetically unsustainable — cut/suspension is near-certain and will drive gap volatility
- D/E >1000% with only $229M equity vs $16.5B debt — any warehouse funding disruption or MSR mark reversal is existential
- Sell-side consensus PT has fallen from $5.59 → $3.98 over 45 days; Morgan Stanley cut $5→$3 on Jul 20
- Technical breakdown risk: price at $1.84 is <2% above 52-week low $1.815; break opens $1.50-$1.60
- Forecast model unreliable on this name (22% directional accuracy 1d vs 78% naive; 0% vs 100% 1wk) — bullish model bands should be discounted
- Two Harbors deal failure removed a potential balance-sheet de-risking catalyst
- Short float rising (13.2%→16.6%→20.9%) reflects deteriorating institutional confidence, not just squeeze fuel
- Aug 6 earnings is a binary catalyst with high IV crush and gap risk
Get AI analysis on any stock
This is one of hundreds of Kronos AI reports — scored fundamentals & technicals, bull/base/bear price targets, a multi-horizon plan, and continuously-updated forecasts across the market. Create a free account to explore them all.
Create your free account →Already a member? Sign in · Join our Discord