UWMC — AI Stock Forecast & Price Targets
Published 7/15/2026 · A free sample of K3vl4r’s AI-powered analysis.
Kronos price forecasts, scored fundamentals & technicals, and a multi-horizon plan.
View the live UWMC price forecast →
UWMC at $2.02 sits pinned near its 52-week low ($1.98) with a mathematically stressed capital structure ($16.5B debt vs $229M equity, 329% dividend payout on -$2.23B Q1 OCF) heading into a binary Aug 6 earnings print in ~22 days. Short interest has escalated to 20.9%, sell-side price targets have been cut (Barclays $5→$4, KBW $4.5→$3.75), and the forecast model's V-reversal is contradicted by its own realized 0% 1wk directional accuracy on this name — making the bull case unreliable. This is a HOLD/AVOID for new capital: solvency signaling from the print (dividend policy + OCF trajectory) is the only real driver, and pre-positioning long into a broken payout ratio is not favorable risk/reward.
Do not initiate new long exposure into the Aug 6 earnings print (~22 days). Existing holders: consider trimming into any rally toward $2.20-$2.35 to reduce binary risk. Key levels: $1.98 hard stop (52wk low break invalidates any bounce thesis and opens $1.60-$1.75); $2.20 first resistance; $2.35 second resistance. If forced to trade tactically, small speculative long only if $2.00 holds with declining short-interest print, targeted at $2.20-$2.30 with a $1.95 stop. Earnings stance: FLAT into the print — the dividend decision and OCF trajectory are binary and the IV crush will punish long-premium hedges. Sizing: minimal.
1-6 month view is HOLD with negative skew. Base case: the Aug 6 print reveals a dividend trim (from $0.40 annualized toward $0.20-$0.24), a gap-down of 10-20% to $1.65-$1.85, then a gradual re-rating toward $2.10-$2.30 once solvency fears fade — net-net range-bound with downside asymmetry. Bull case requires (a) dividend maintained AND (b) OCF trajectory improving AND (c) Fed cut signal in H2'26 — under that combination the stock can revisit $2.80-$3.00. Bear case: dividend cut to zero + Q2 OCF still deeply negative = sub-$1.50. What would change my mind: sustained close above $2.60 on volume with short-interest decline, or a hard 8-K confirming dividend policy sustainability with organic (not warehouse-funded) OCF.
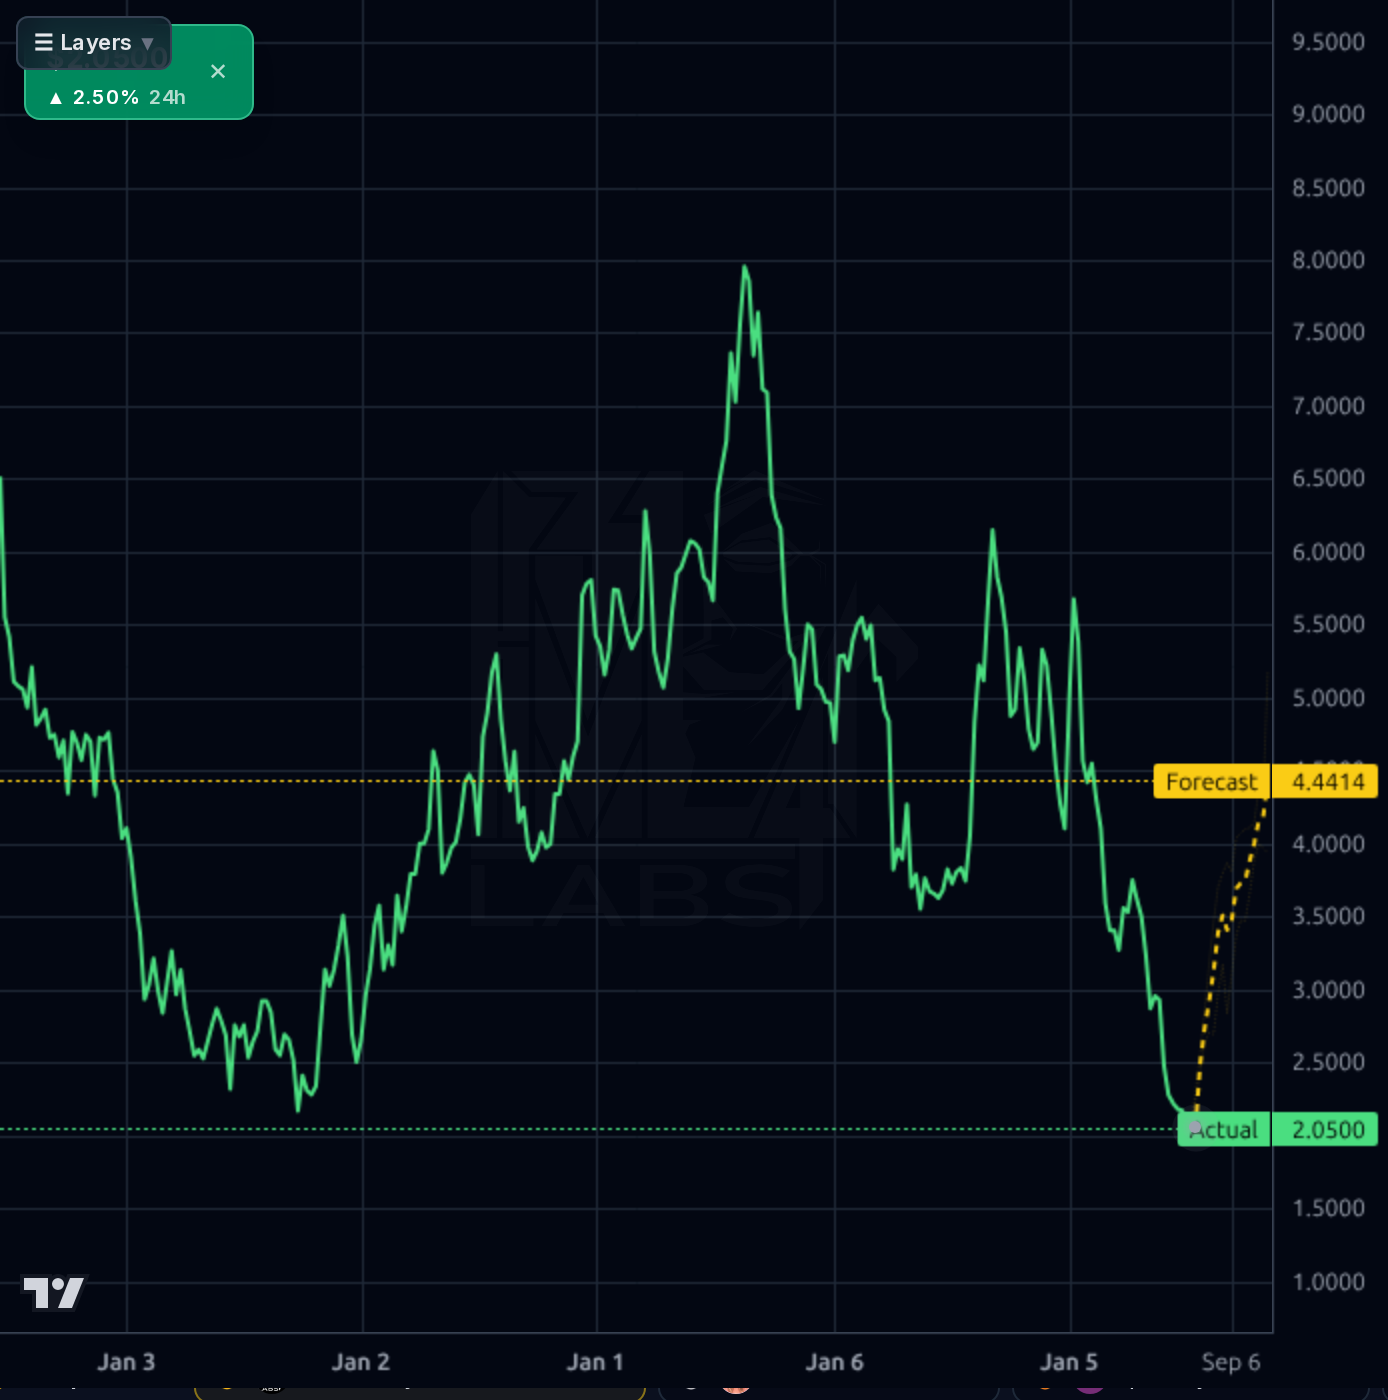
1-3 year view is structural AVOID unless leverage compresses materially. UWMC is a wholesale-channel mortgage originator with real scale advantages (Ishbia network, in-house servicing by Oct 2026, Mia AI on servicing) but the equity is a residual claim on an over-levered originator whose cycle economics require Fed cuts to sustain volumes. Terminal thesis: even in a rate-cut refi wave, the market has repeatedly refused to value UWMC above ~$7 (2024 highs) and the share count has drifted higher. Biggest structural risk: leverage. A funding-market dislocation (warehouse lender pull, MSR mark reversal, credit-rating action) is a wipeout scenario given $229M of equity supporting a $19B balance sheet. Unless dividend is right-sized and OCF turns durably positive, this is not a compounder — it's a levered cyclical option.
Revenue is recovering sequentially (Q1'26 $504M vs $339M Q3'25 trough; TTM sales $3.37B, +37% Y/Y), and reported net income turned positive ($25.3M in Q1'26, EPS TTM $0.27). Reported gross/operating margins are optically strong (87%/57%) and ROE is 33.6% — but these are misleading in a mortgage originator context. The balance sheet is the binding constraint: $16.5B total debt vs $229M stockholders' equity implies leverage >1000x per Yahoo's calc (Finviz shows Debt/Eq 70.65, still extreme), while Q1'26 operating cash flow was -$2.23B and FCF -$2.25B — meaning the origination ramp is entirely warehouse-debt-funded, not organic. The dividend is arithmetically broken: 329% payout ratio with a ~19-20% yield, paid out of debt/gain-on-sale accounting rather than cash flow. Current ratio 0.42 (Finviz) is weak. Cash-per-share $0.26 vs book $0.73. Capital allocation is dominated by insider-friendly dividends and the aggressive, cash-stretching Two Harbors bid — neither is deleveraging. What's working: origination volume and revenue mix. What's broken: cash generation, leverage, and payout discipline.
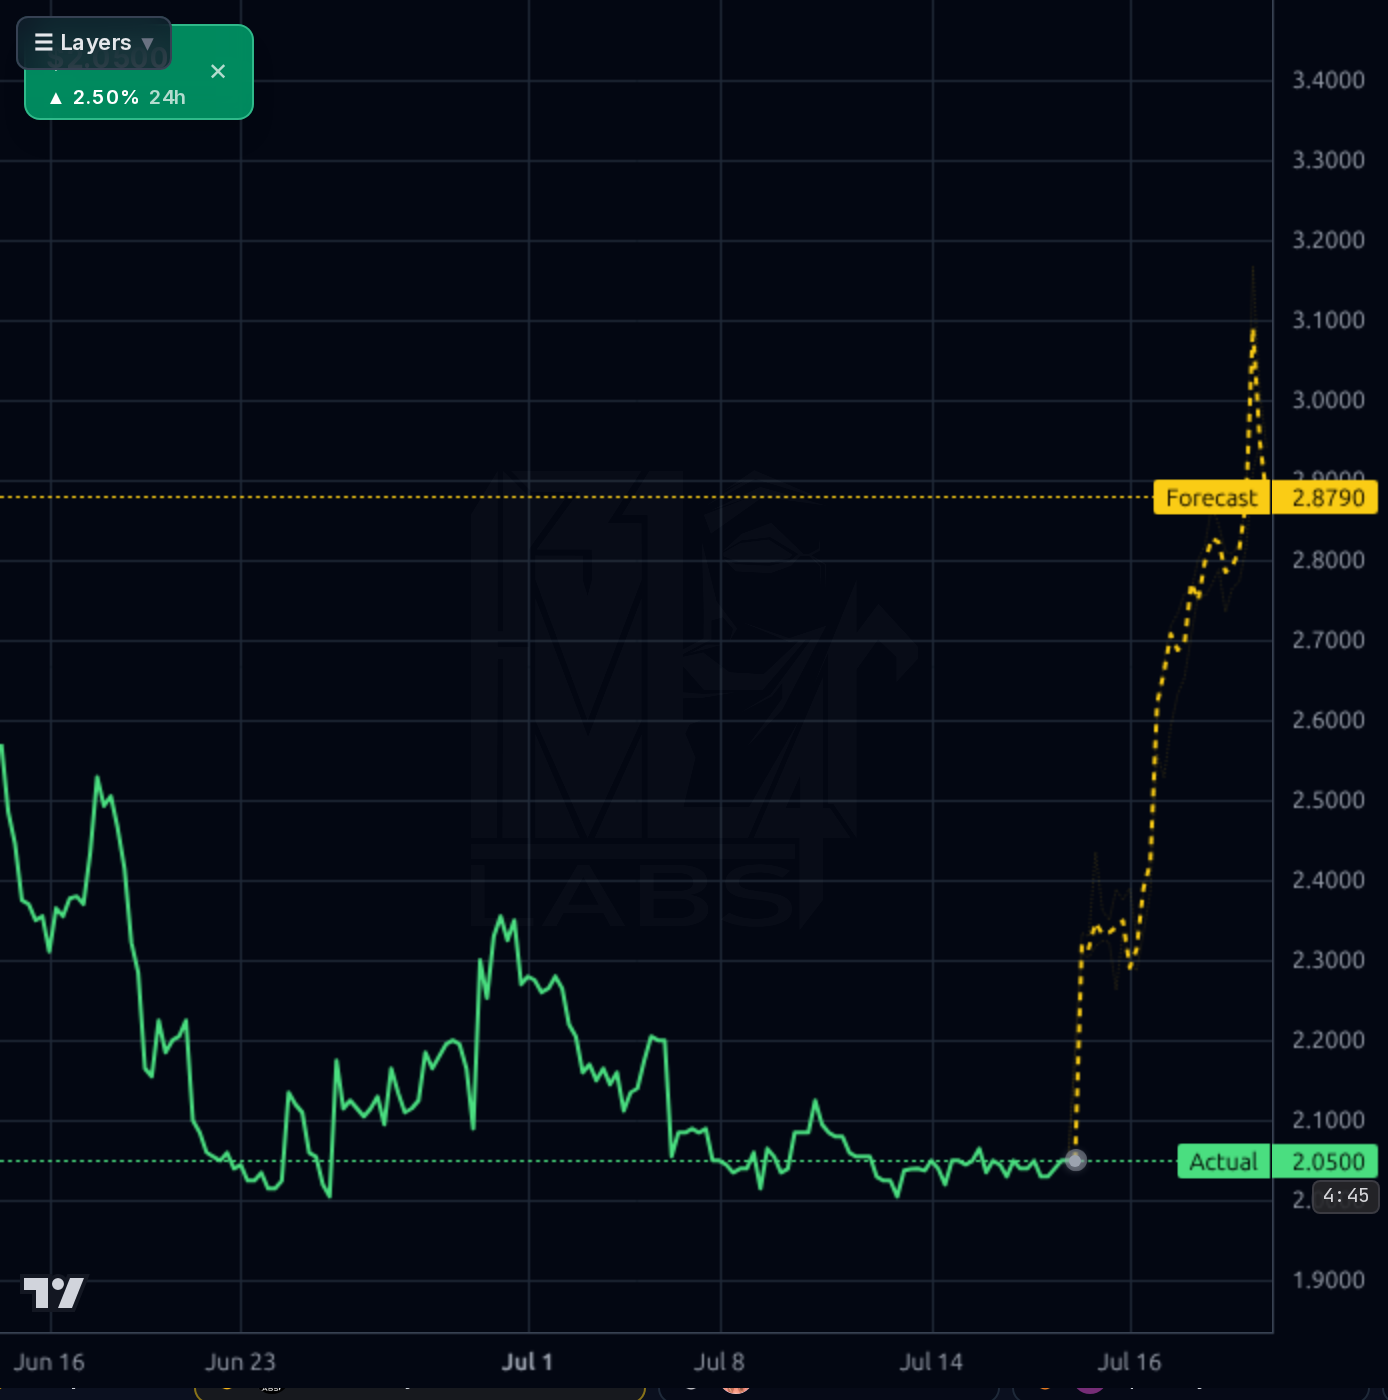
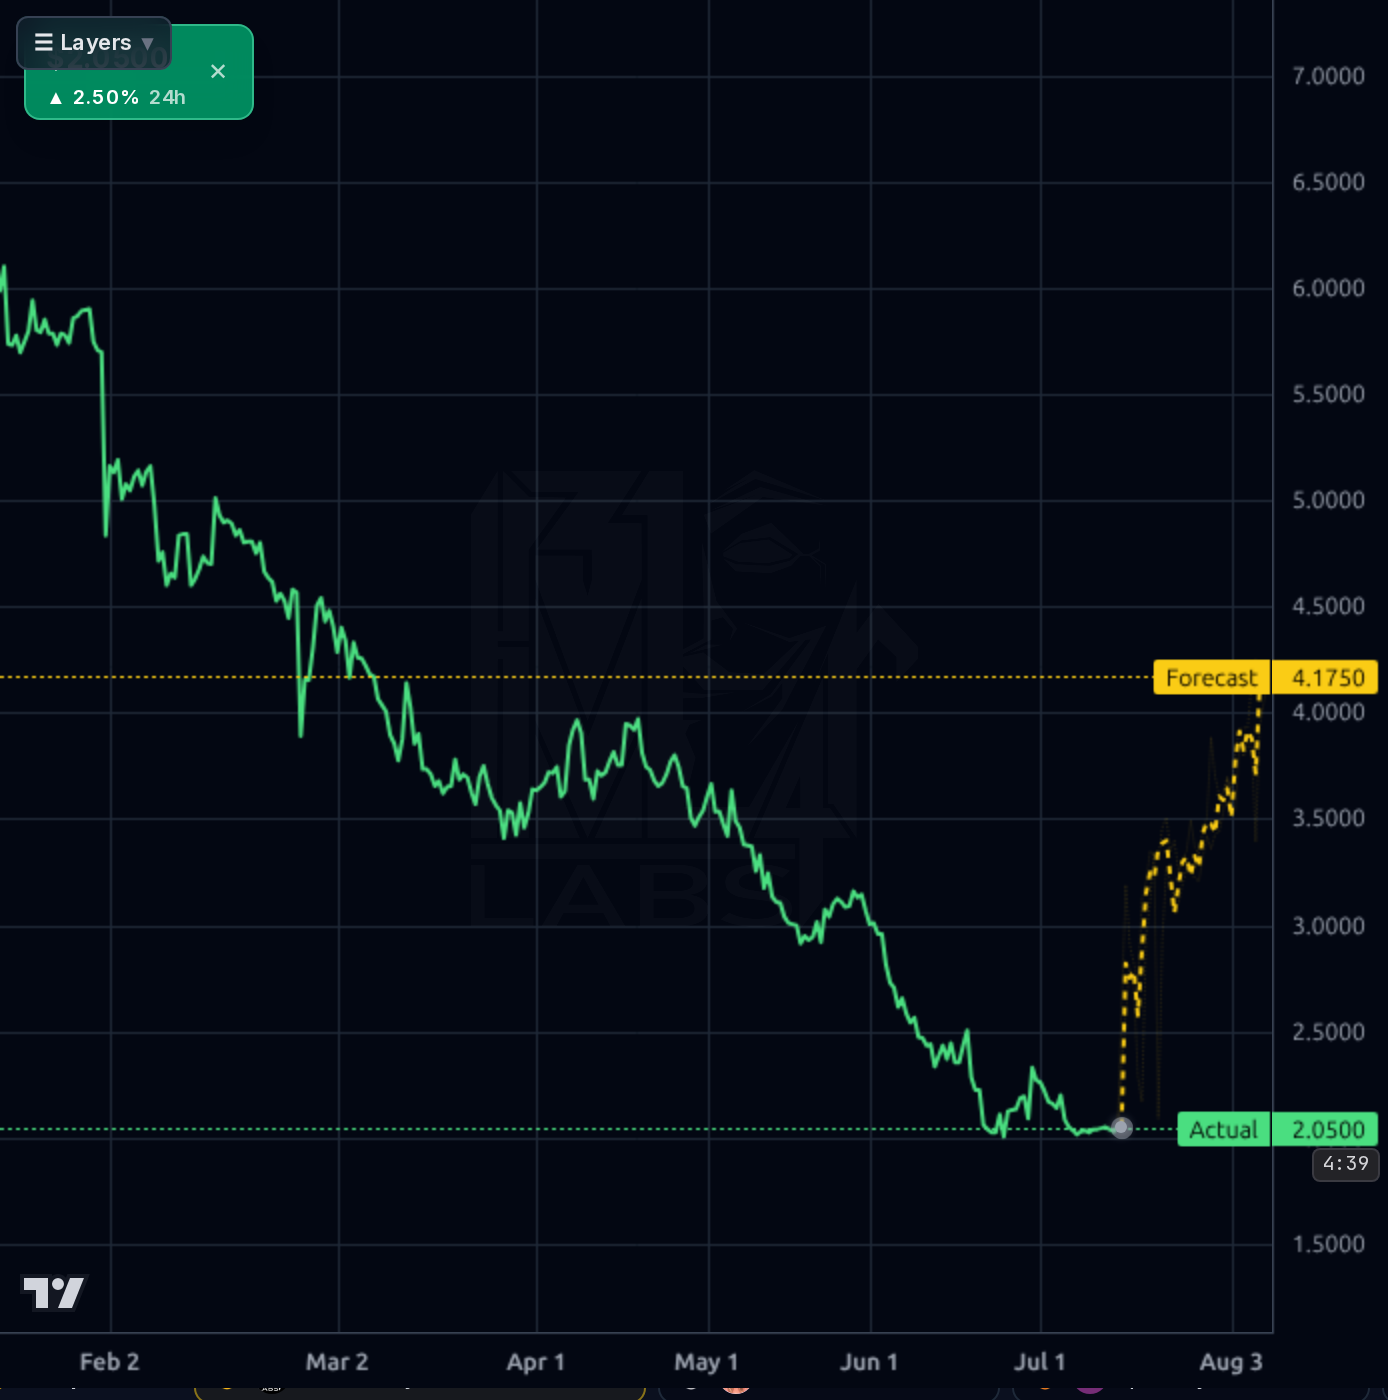
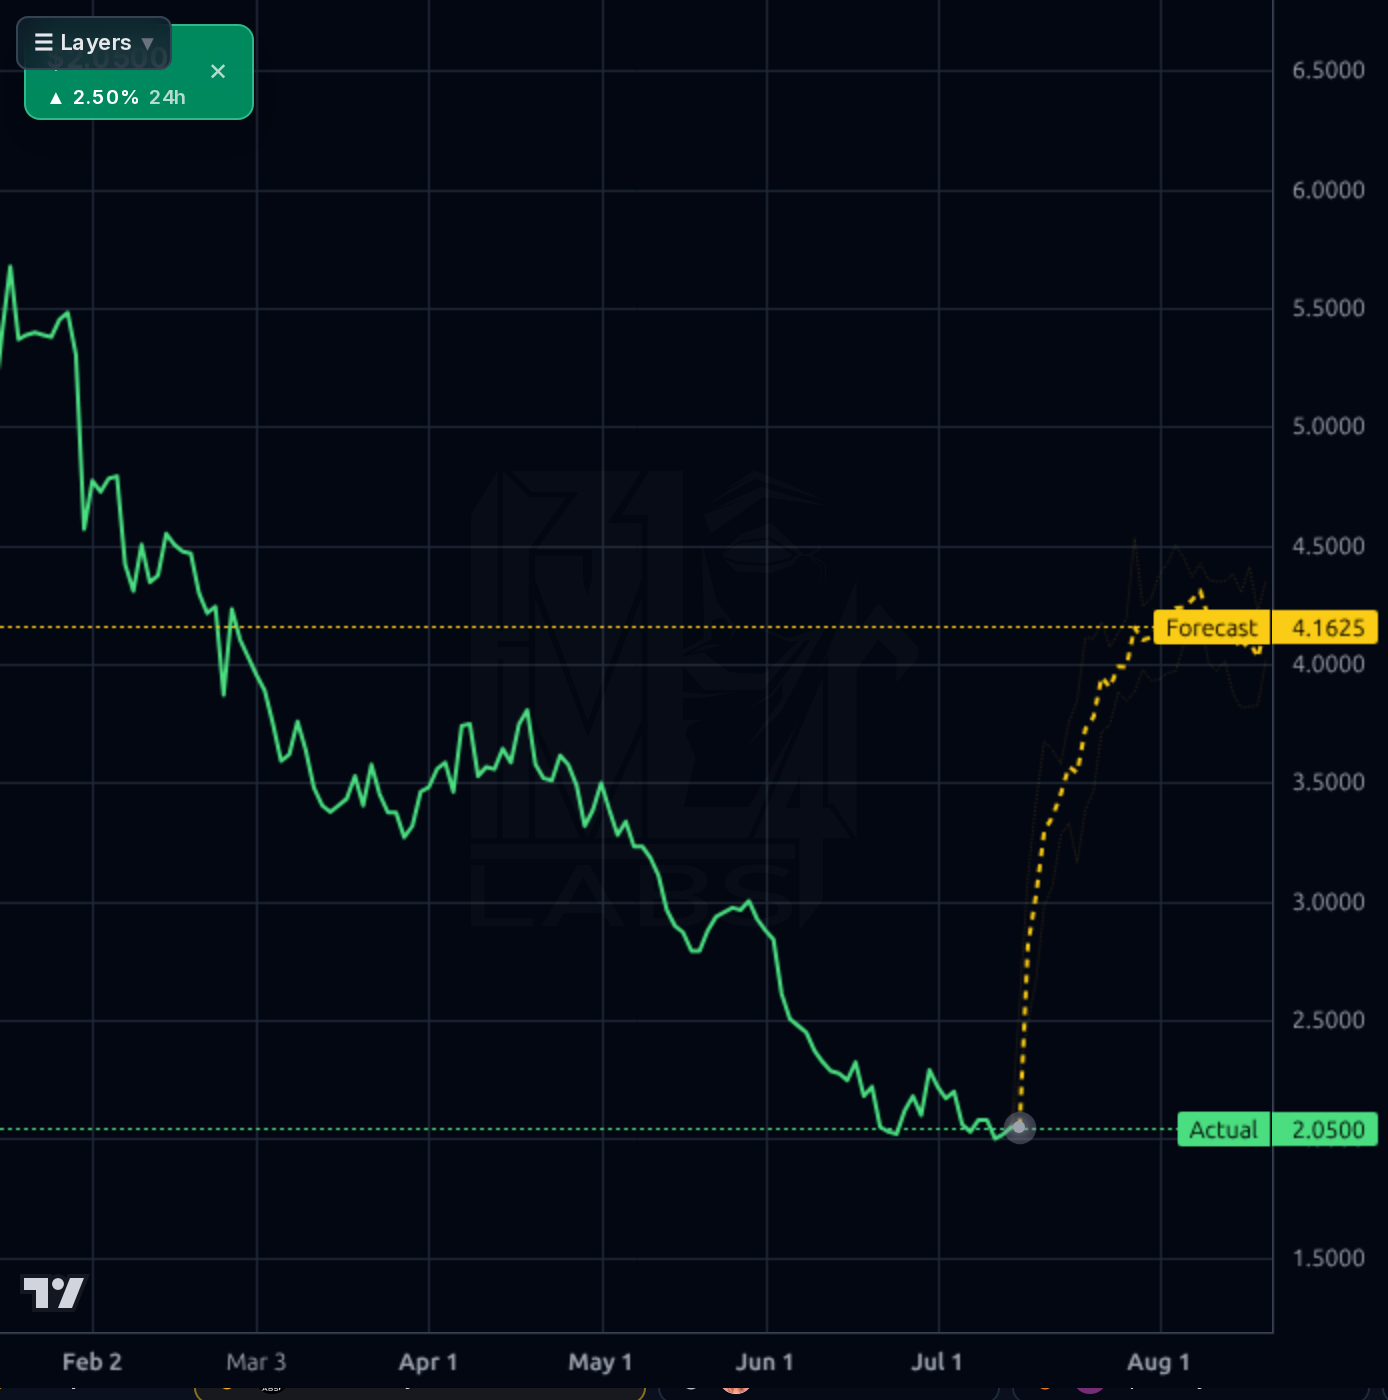
The multi-timeframe picture is decisively bearish. On the daily/weekly, price has collapsed from $7.14 (52-week high) to $2.02 — down 71%, YTD -54%, SMA200 -53%, SMA50 -24%, Perf Half Year -62%. The stock is grinding along the $1.98-$2.10 floor with RSI 33.5 (oversold but not capitulatory), and each rally attempt visible on the 1h/4h charts has failed. The 1h shows the actual green line pinned near $2.05 while the yellow forecast band projects a near-vertical rip to $2.88 — this pattern of forecast divergence has printed 0% directional accuracy at 1-week and 33% at 1-day (both worse than naive baseline), so the yellow line is effectively an anti-signal in this regime. Support: $1.98 (52wk low) is the line in the sand; a break opens sub-$2 discovery. Resistance: $2.20 (recent chop), then $2.35, then $3.00 psychological. No bullish divergence, no volume climax, no reversal candle — just a stock waiting on a catalyst.
Signal: (1) Two consecutive short-float upgrades from 13.2% → 16.6% → 20.9% in 45 days show informed capital escalating bearish positioning into the Aug 6 print. (2) Sell-side targets have been cut across the board — Barclays $5→$4, KBW $4.5→$3.75 despite an upgrade — indicating even bullish analysts are re-anchoring lower. (3) Motley Fool's July 14 piece explicitly framed the ~19% yield as a 'warning, not a gift,' which mainstream retail readers will absorb. (4) The Two Harbors bid remains outstanding but Two Harbors' board flagged structural issues with the stock-heavy consideration mix, and the deal is not a clean cash catalyst. Noise: retail crowd is a mixed 57/43 bull/bear with plenty of anecdotal 'brokers leaving UWM' commentary that can't be verified. Net: news flow tilts bearish into the print, with the dividend policy statement on Aug 6 being the single most important upcoming disclosure.
- Q1'26 origination volume of $44.9B (up 39% Y/Y per company release) — validation that wholesale channel demand has re-accelerated off the trough
- In-house servicing platform build-out targeting substantially all loans serviced internally by October 2026, per company commentary
- AI assistant 'Mia' projected to handle >12M servicing calls in 2026 — potential unit-cost lever if realized
- Two Harbors acquisition bid at $12.50/share with late-September 2026 shareholder vote — MSR portfolio expansion optionality
- H2'26 potential Fed rate cuts as a top-of-funnel refi tailwind for the wholesale channel
- Dividend cut on Aug 6 print — 329% payout on -$2.23B Q1 OCF is arithmetically unsustainable; a cut is priced but a full suspension is not
- Extreme leverage: $16.5B debt on $229M equity — any warehouse funding stress or MSR mark reversal is an existential event
- Short interest at 20.9% and rising (from 13.2% 45d ago) signals informed bearish positioning into the print
- Sell-side price target cuts across the board (Barclays $5→$4, KBW $4.5→$3.75) — even bulls are lowering the bar
- Two Harbors deal risk — stock-heavy consideration flagged by TH board; failed deal removes optionality, successful deal further stretches balance sheet
- Insider selling: CEO Mat Ishbia $9M in share sales earlier in 2026 signals reduced insider confidence
- Forecast model directional accuracy 0% at 1wk on this name — the projected V-reversal to $2.88 should be treated as anti-signal
Get AI analysis on any stock
This is one of hundreds of Kronos AI reports — scored fundamentals & technicals, bull/base/bear price targets, a multi-horizon plan, and continuously-updated forecasts across the market. Create a free account to explore them all.
Create your free account →Already a member? Sign in · Join our Discord