UWMC — AI Stock Forecast & Price Targets
Published 7/14/2026 · A free sample of K3vl4r’s AI-powered analysis.
Kronos price forecasts, scored fundamentals & technicals, and a multi-horizon plan.
View the live UWMC price forecast →
UWMC at $2.00 sits at 52-week lows with a mathematically stressed capital structure ($16.5B debt vs $229M equity, 329% dividend payout on -$2.23B Q1 OCF) heading into a binary Aug 6 earnings print in 23 days. Short interest has escalated to 20.9% and sell-side targets have been cut across the board, while the forecast model's V-reversal projection is unreliable (0% 1wk directional accuracy). Best posture is HOLD/AVOID — the risk/reward is asymmetric to the downside pre-print, with any position sizing for swing trades needing to sidestep the earnings gap.
Stay flat or hold existing small positions. The stock is 23 days from a binary earnings print — do NOT open new swing longs into the gap risk. Key levels: $1.98 is the 52-week floor (break invalidates any long thesis and opens $1.65 test); $2.20-$2.30 is immediate resistance (SMA20 area); $2.60 is the swing high to reclaim. Any tactical long would need $2.10+ close with volume expansion AND stable rate backdrop; invalidation is a close below $1.95. Preferred: no new exposure until post-print. Aug 6 earnings is the explicit catalyst and invalidation.
The 1-6 month thesis is binary on Aug 6: (1) if the dividend is cut sensibly (50%+ reduction) and OCF trajectory shows debt-funded ramp decelerating, the stock can re-rate toward $2.80-$3.20 as solvency overhang lifts; (2) if the dividend is preserved but OCF stays deeply negative, the market will punish the balance sheet delusion and $1.60-$1.80 becomes the target zone. Base case is a middle path: partial dividend cut, guarded H2 origination guide, stock settles $2.20-$2.50. Would change my mind on: a) sustained close above $3.00 with fundamental confirmation; b) explicit deleveraging plan; c) meaningful positive OCF quarter. Expected return range: -20% to +40% into year-end 2026.
Terminal thesis is cyclical optionality — if UWM survives the current rate cycle intact, its ~44% wholesale channel share and 9,100-employee platform become highly valuable operating leverage in the next mortgage upcycle, potentially supporting a $5-$7 stock in a Fed-cutting regime with volume normalization. The biggest structural risk is not the cycle but the balance sheet: with $16.5B of debt against a sliver of equity, any funding market dislocation, MSR mark-down, or repo-line stress could force dilutive equity raise or worse. This is a levered call option on rate cuts and origination recovery, not a compounder. Position sizing should reflect a real (not zero) probability of a going-concern impairment scenario.
Revenue trajectory is genuinely improving — Q1'26 $504M vs Q3'25 trough of $339M, and Q4'25 $522M shows the wholesale channel is recovering with 24.4% Q/Q and 37.1% Y/Y TTM sales growth. However, the quality of that recovery is deeply suspect: Q1'26 operating cash flow was -$2.23B while total debt grew from $4.39B to $5.19B sequentially, and total assets ballooned $2.3B — the origination ramp is being financed entirely by incremental leverage. The capital structure is extreme: $16.5B total debt against just $229M stockholders' equity (D/E >1000x on trailing basis, 70.6x on the tighter measure). Net margins at 1.97% TTM leave zero buffer for MSR mark reversals or funding stress. The 20% dividend yield with a 329% payout ratio is arithmetically broken; a cut is a matter of when, not if. ROE of 33.6% is optically impressive but is a function of the sliver of equity, not durable profitability. Net income of $25.3M in Q1'26 is real but tiny relative to the balance sheet risk.
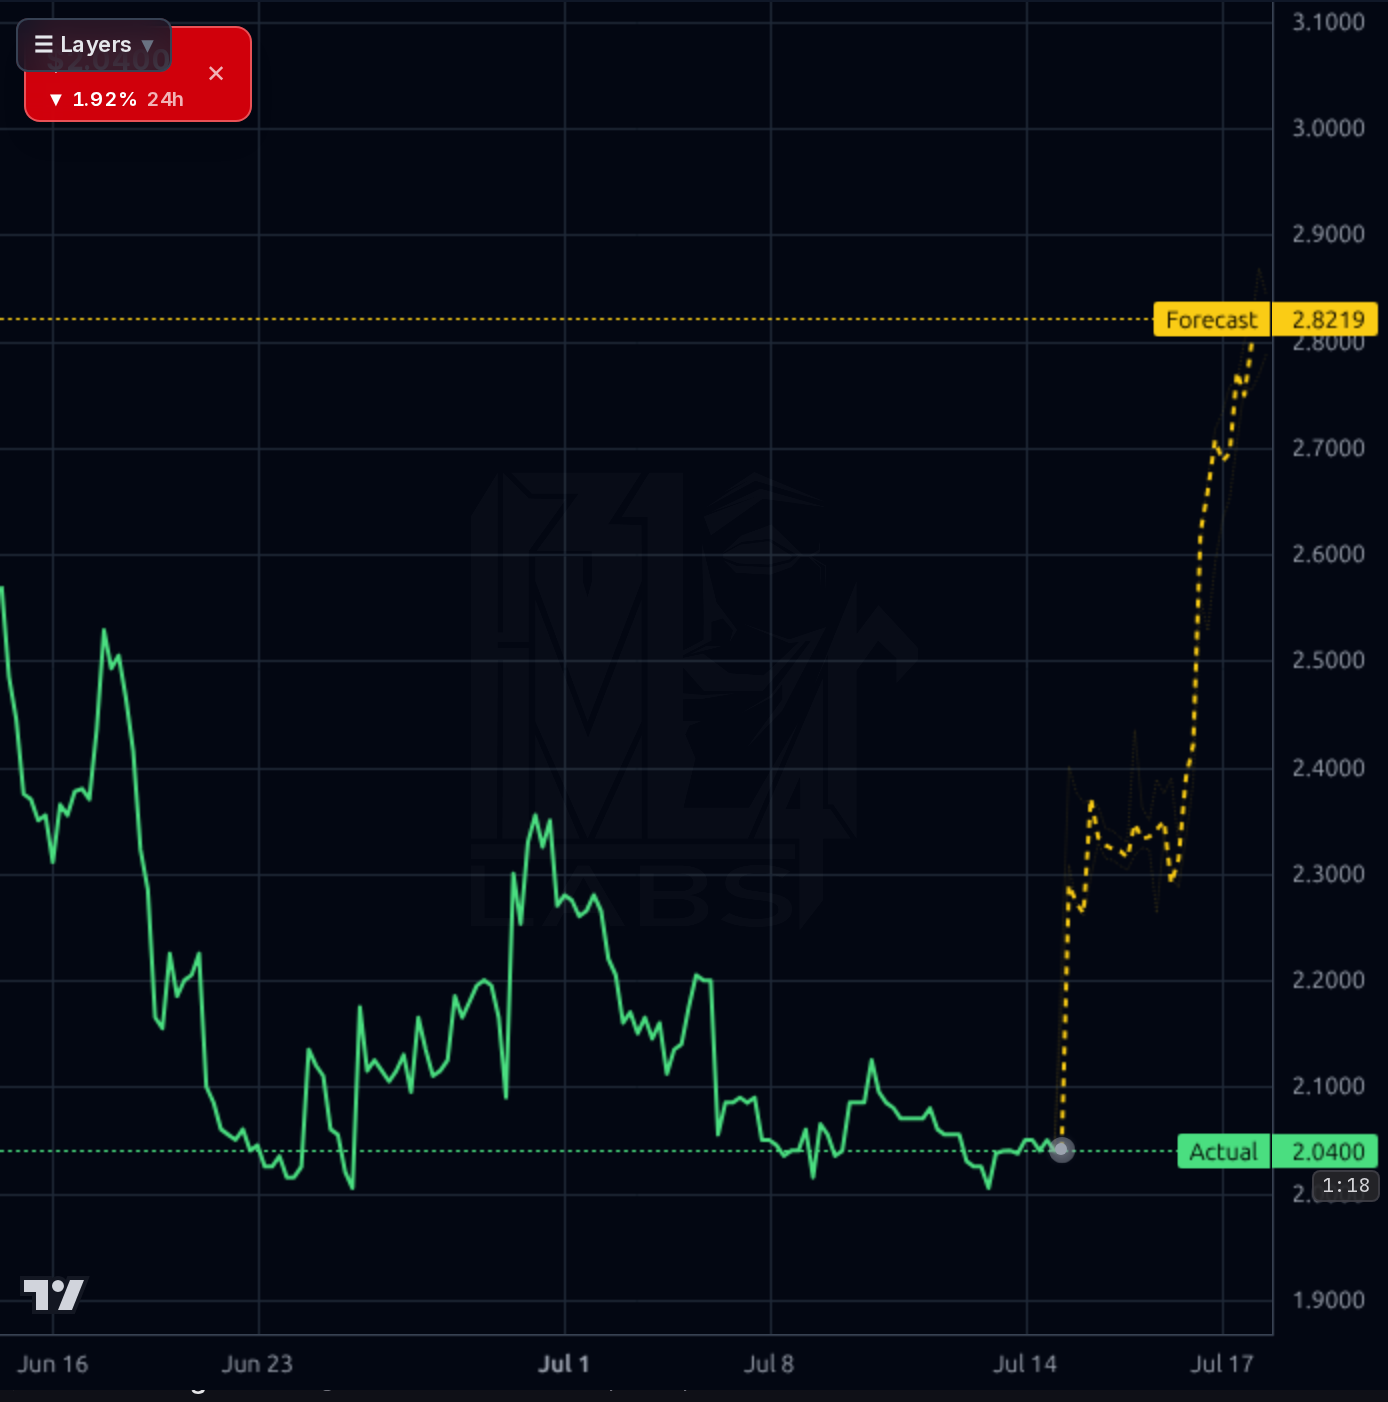
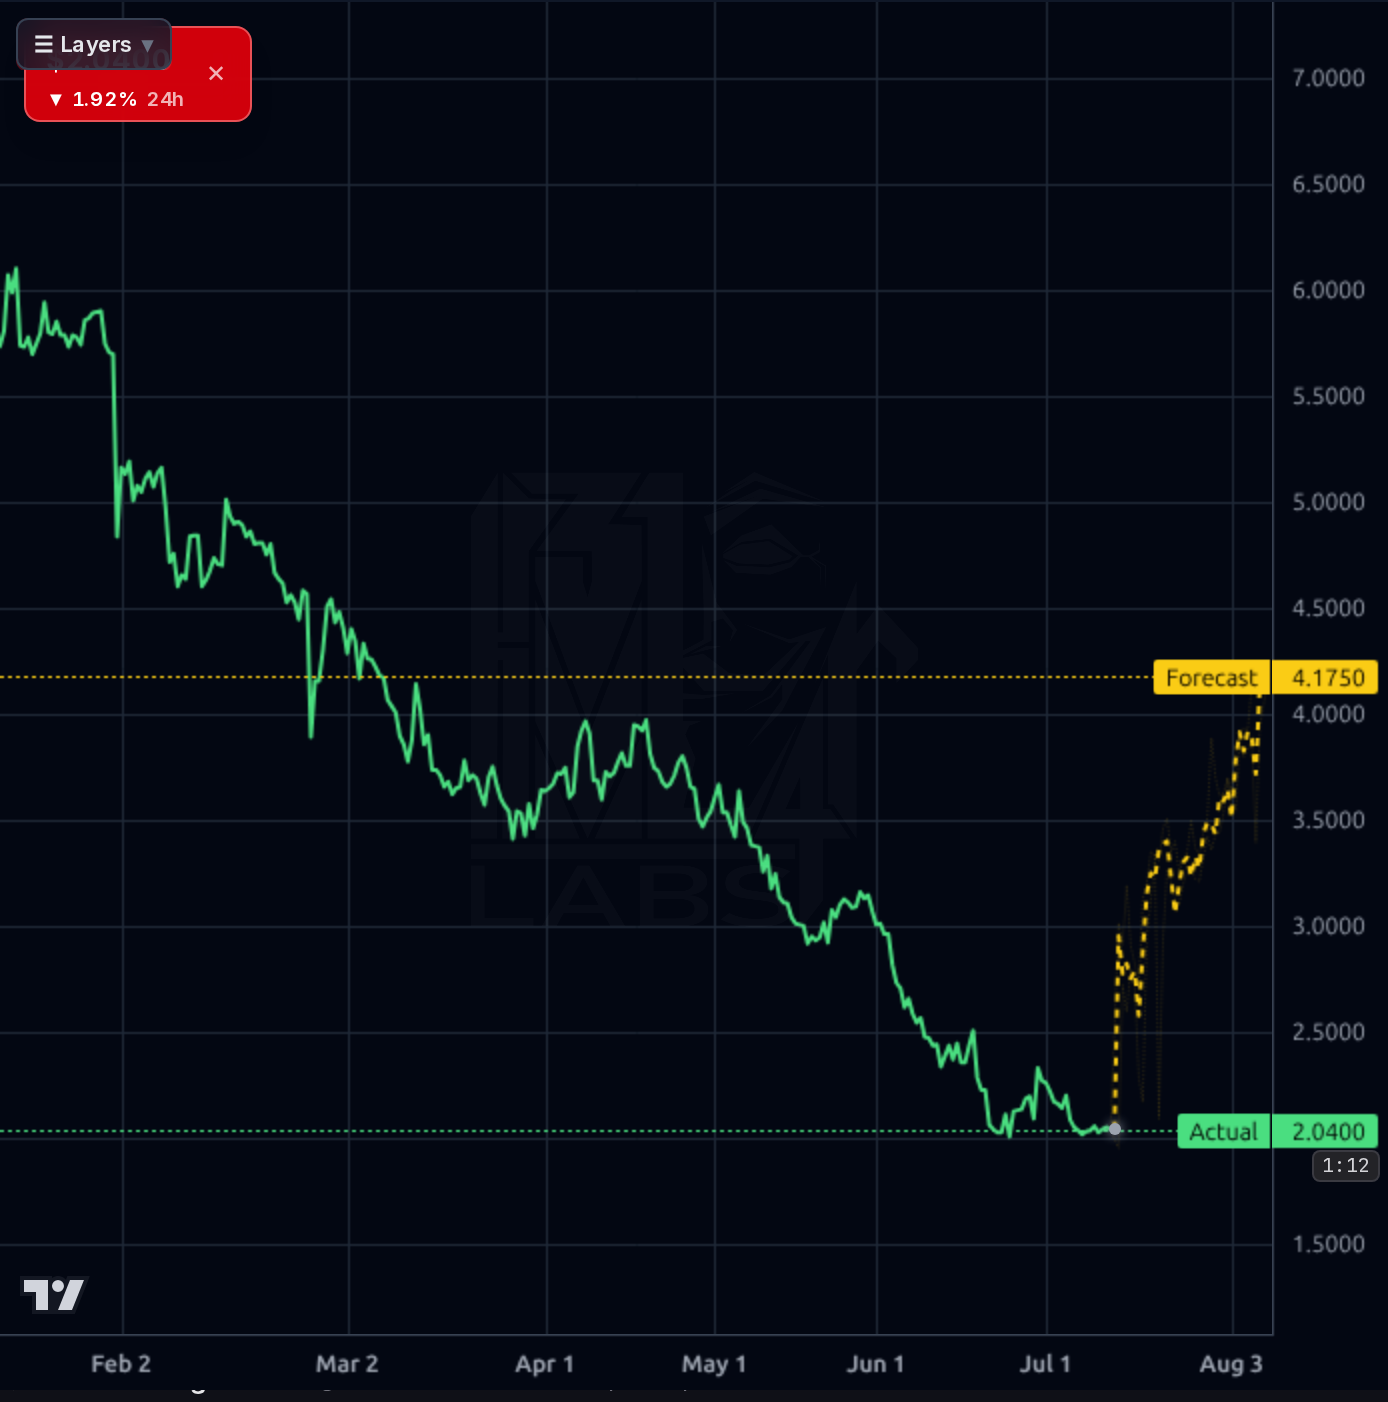
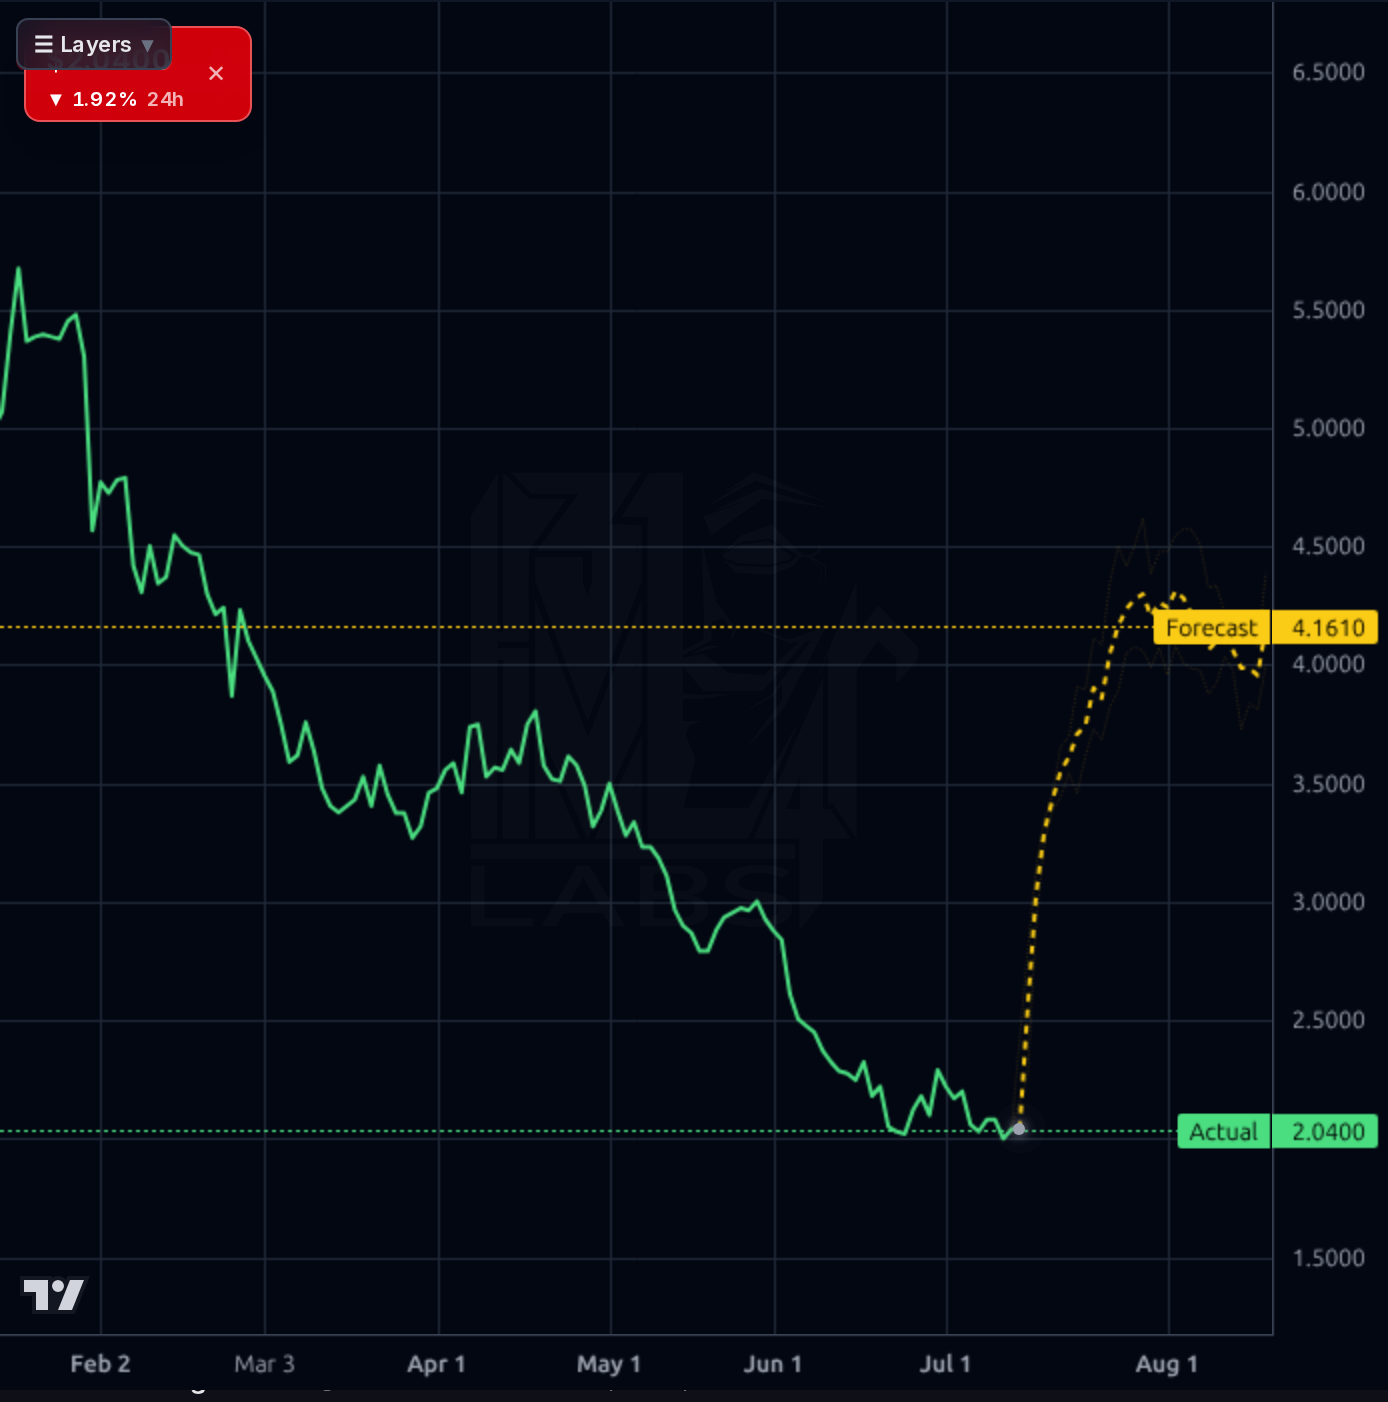
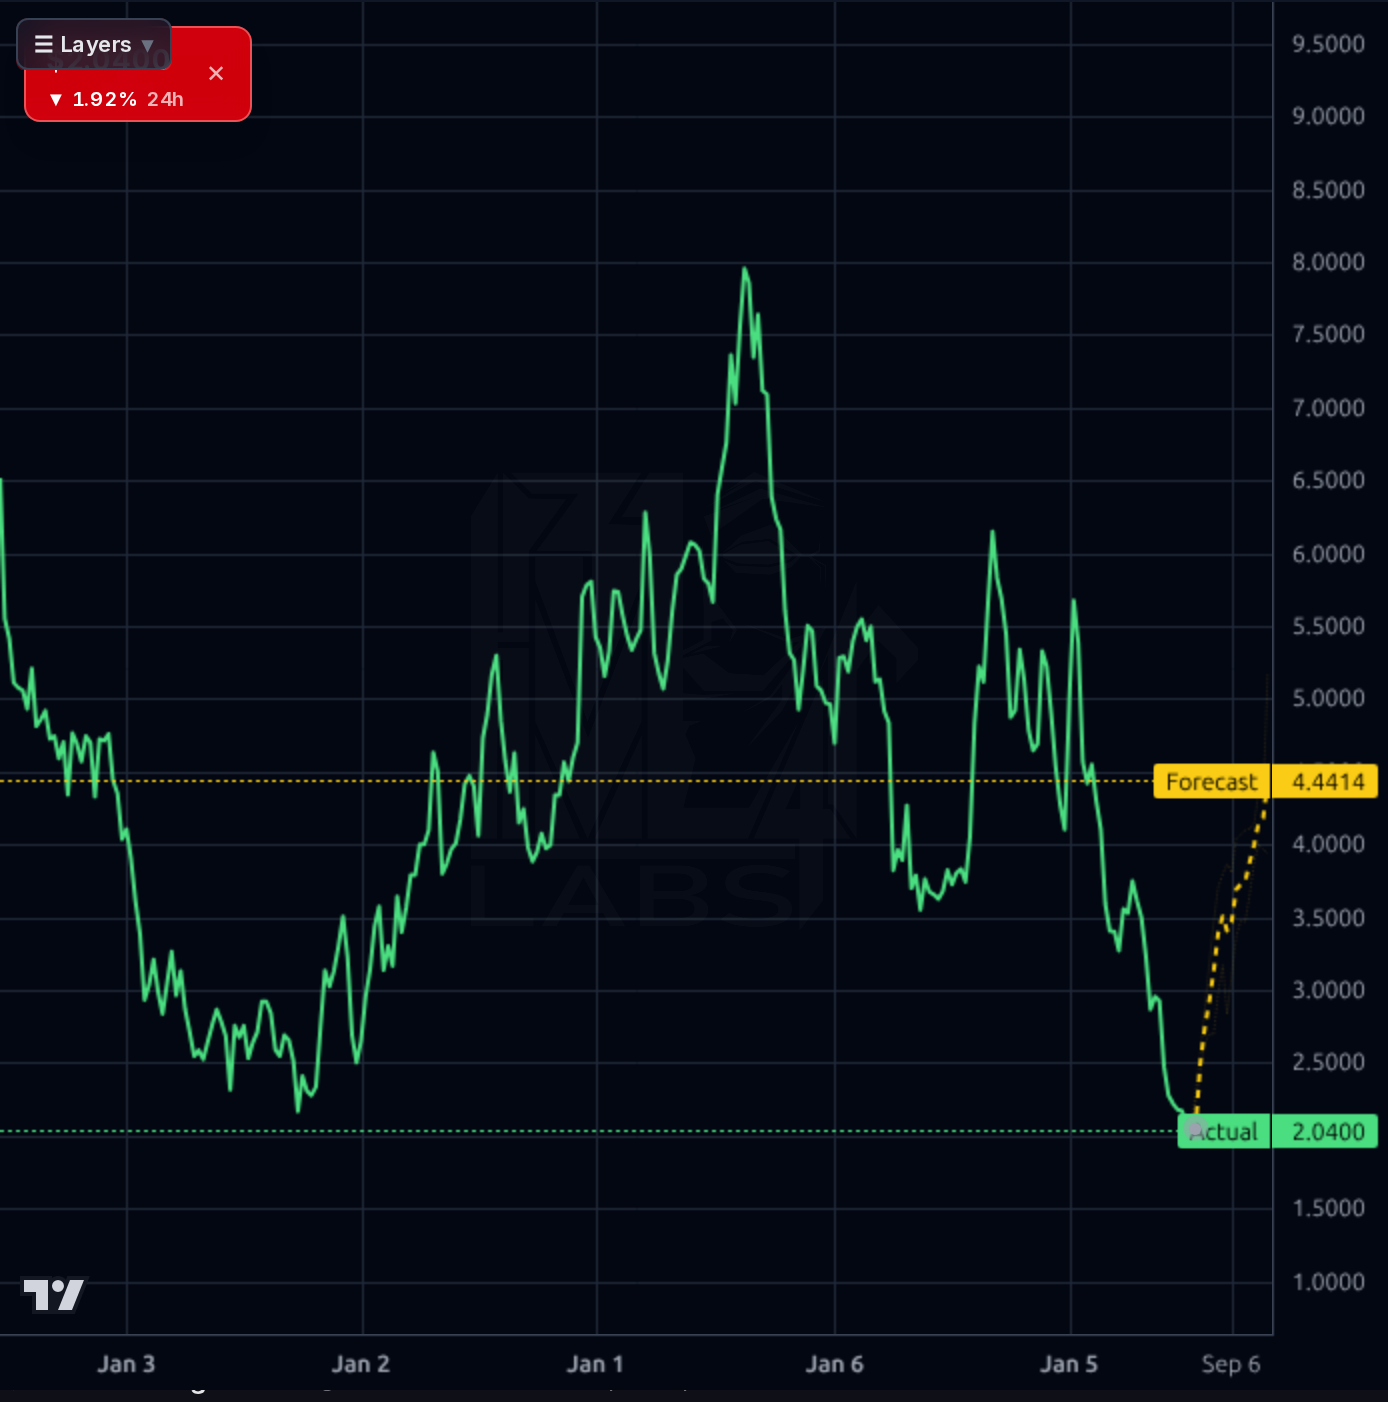
The stock is structurally broken across all timeframes: -53.8% below SMA200, -25.7% below SMA50, -7.6% below SMA20, and -54.3% YTD. The weekly chart shows a violent breakdown from $8 in 2024 to a fresh $1.98 52-week low, with the daily chart confirming a persistent lower-highs/lower-lows pattern through H1'26. RSI at 32 is near oversold but not extreme, and the $1.98 support has been tagged multiple times — a decisive break opens sub-$2 price discovery with no obvious floor. The Kronos forecast band projects a sharp V-reversal to $2.82 (1h), $4.17 (4h/1d), and $4.44 (1wk), but the model's realized accuracy on this ticker is atrocious — 33% directional at 1d vs 67% naive, 0% at 1wk vs 100% naive — so those V-reversal projections should be treated as anti-signal. Short interest at 20.9% (up from 13.2% in 45 days) and short ratio 3.38 reflect informed bearish positioning into the print. No bullish divergence visible; the technical setup argues for continued drift lower or sideways chop into Aug 6.
The news flow is decisively bearish on the sell-side. Barclays cut its target from $5 to $4 (still Overweight) on July 7, KBW upgraded to Outperform on June 25 but LOWERED its target from $4.50 to $3.75, and BTIG trimmed from $10 to $4 on June 23 citing a tougher rate environment. Fintel notes a 13.3% aggregate price-target reduction to $4.99. The pattern is clear: analysts remain constructively rated but are marking down expectations for the H2'26 recovery, and the target cuts have led the price lower rather than lagged it. Broader market news (Iran escalation, prediction markets) is context noise but the risk-off tone into a leveraged, cyclical name is unhelpful. The one deep-research point flagging a Two Harbors acquisition bid is directionally relevant but the more concrete signal from primary sources is universal target compression.
- Sequential origination recovery: Q1'26 revenue $504M vs Q3'25 trough $339M, Q4'25 record volumes signal wholesale share gains
- Potential Fed rate cuts in H2'26 would re-accelerate refi/purchase volumes through UWM's #1 wholesale platform
- Consolidation optionality — reported Two Harbors bid signals management appetite to absorb distressed originator share
- Analyst EPS estimates rising per deep research ($0.46 → $0.54) reflect improving operating leverage on volume recovery
- Forward P/E of 4.15 provides significant re-rating fuel IF balance sheet holds as going concern through the print
- Extreme leverage: $16.5B debt vs $229M equity leaves near-zero cushion for funding stress or MSR mark reversals
- Q1'26 OCF of -$2.23B with $798M sequential debt increase confirms asset ramp is debt-funded, not organic
- Dividend at 329% payout ratio is arithmetically broken; announcement of a cut is not priced and creates single-print event risk
- Short interest escalation to 20.9% (from 13.2% in 45 days) signals informed bearish positioning into Aug 6
- Sell-side target cuts leading price lower (BTIG $10→$4, Barclays $5→$4, KBW $4.5→$3.75) — consensus H2 recovery being downgraded
- Technical structure broken: -53.8% below SMA200, fragile $1.98 support; break opens sub-$2 price discovery
- Fitch credit outlook downgraded twice in four months per research — funding-cost pressure feeds into an already-negative OCF
Get AI analysis on any stock
This is one of hundreds of Kronos AI reports — scored fundamentals & technicals, bull/base/bear price targets, a multi-horizon plan, and continuously-updated forecasts across the market. Create a free account to explore them all.
Create your free account →Already a member? Sign in · Join our Discord