UWMC — AI Stock Forecast & Price Targets
Published 7/21/2026 · A free sample of K3vl4r’s AI-powered analysis.
Kronos price forecasts, scored fundamentals & technicals, and a multi-horizon plan.
View the live UWMC price forecast →
UWMC at $2.05 remains pinned near its 52-week low ($1.98) with a mathematically stressed capital structure ($16.5B debt vs $229M equity, 329% payout ratio on -$2.23B Q1 OCF) heading into a binary Aug 6 earnings print in ~16 days. Short interest has climbed to 20.94%, sell-side targets keep getting cut (Morgan Stanley $5→$3, KBW $4.5→$3.75, price target consensus $4.22→$3.98), and the forecast model's bullish V-reversal has been unreliable on this name (38% directional accuracy vs 62% naive baseline). This is a HOLD with defined risk into the print — no pre-earnings size, waiting for guidance on dividend policy.
1-4 week: HOLD/AVOID new longs into the Aug 6 print (~16 days away). This is a binary event with dividend policy as the primary swing factor — a suspension or cut is highly probable given -$2.23B Q1 OCF, and would drive a re-rate to $1.40-$1.60. Do not size a swing trade into the print; treat any long as pre-earnings tactical only. Invalidation on the downside: sustained close below $1.87 opens $1.50-$1.60. Invalidation on the upside: reclaim $2.20 with volume would suggest a squeeze setup toward $2.35, but chase risk is high with short-float at 20.94%. If forced to trade, prefer defined-risk options over shares.
1-6 month: bearish bias with 3.5/10 conviction. The base case is that the Aug 6 print forces a dividend cut/suspension, driving initial downside to $1.40-$1.60 before a possible relief bounce as the equity story resets around solvency-plus-recovery rather than yield. If management defies the arithmetic and holds the dividend while guiding to OCF recovery in H2'26, upside is capped around $2.85 (repeated prior resistance). Expected return range: -30% to +25%, skewed negative. Change my mind: a credible Two Harbors deal-close with balance-sheet clarity, or Q2 OCF turning positive with explicit dividend defense.
1-3 year: structurally this is a levered call option on U.S. mortgage-rate normalization. If 30-yr rates compress to 5% and volume normalizes, UWMC's operating leverage (56.76% operating margins) could produce $600-800M in annualized net income and re-rate toward $5-7. But the path there requires surviving the current cash burn without a dilutive equity raise or debt restructuring — and with $16.5B of debt against $229M of equity, one adverse MSR mark, warehouse-line pull, or repo margin call is existential. Biggest structural risk is that mortgage origination is a commoditized, cyclical business where scale hasn't produced durable pricing power — the -74.8% 5-year return is prima facie evidence.
The fundamental picture is deeply bifurcated. On the income statement, Q1'26 revenue of $504.5M with net income of $25.3M (5.0% net margin) and 39% Y/Y origination volume growth show cyclical operating leverage — TTM sales growth of +37.1% and EPS Y/Y TTM of +572% look strong on paper. However, the balance sheet is broken by any reasonable standard: $19.3B total assets against $17.7B liabilities leaves just $229.5M of stockholders' equity, implying D/E of 1033% (or 70.65x on the market snapshot's basis). Q1'26 operating cash flow was -$2.23B and TTM FCF is -$1.09B, yet the company continues to pay a $0.40/yr dividend implying a 21.16% yield and 329% payout ratio. This is being funded by warehouse lines and debt issuance, not organic cash — total debt grew from $3.4B (Q2'25) to $5.2B (Q1'26). Trailing P/E of 6.3x and forward P/E of 4.2x look optically cheap, but P/B of 2.58x on rapidly depleting equity and EV/EBITDA of 10.3x on a highly cyclical, negative-FCF business is a truer read. The dividend is the single most important line item — its sustainability is arithmetically impossible without an OCF inflection or a cut announcement on Aug 6.
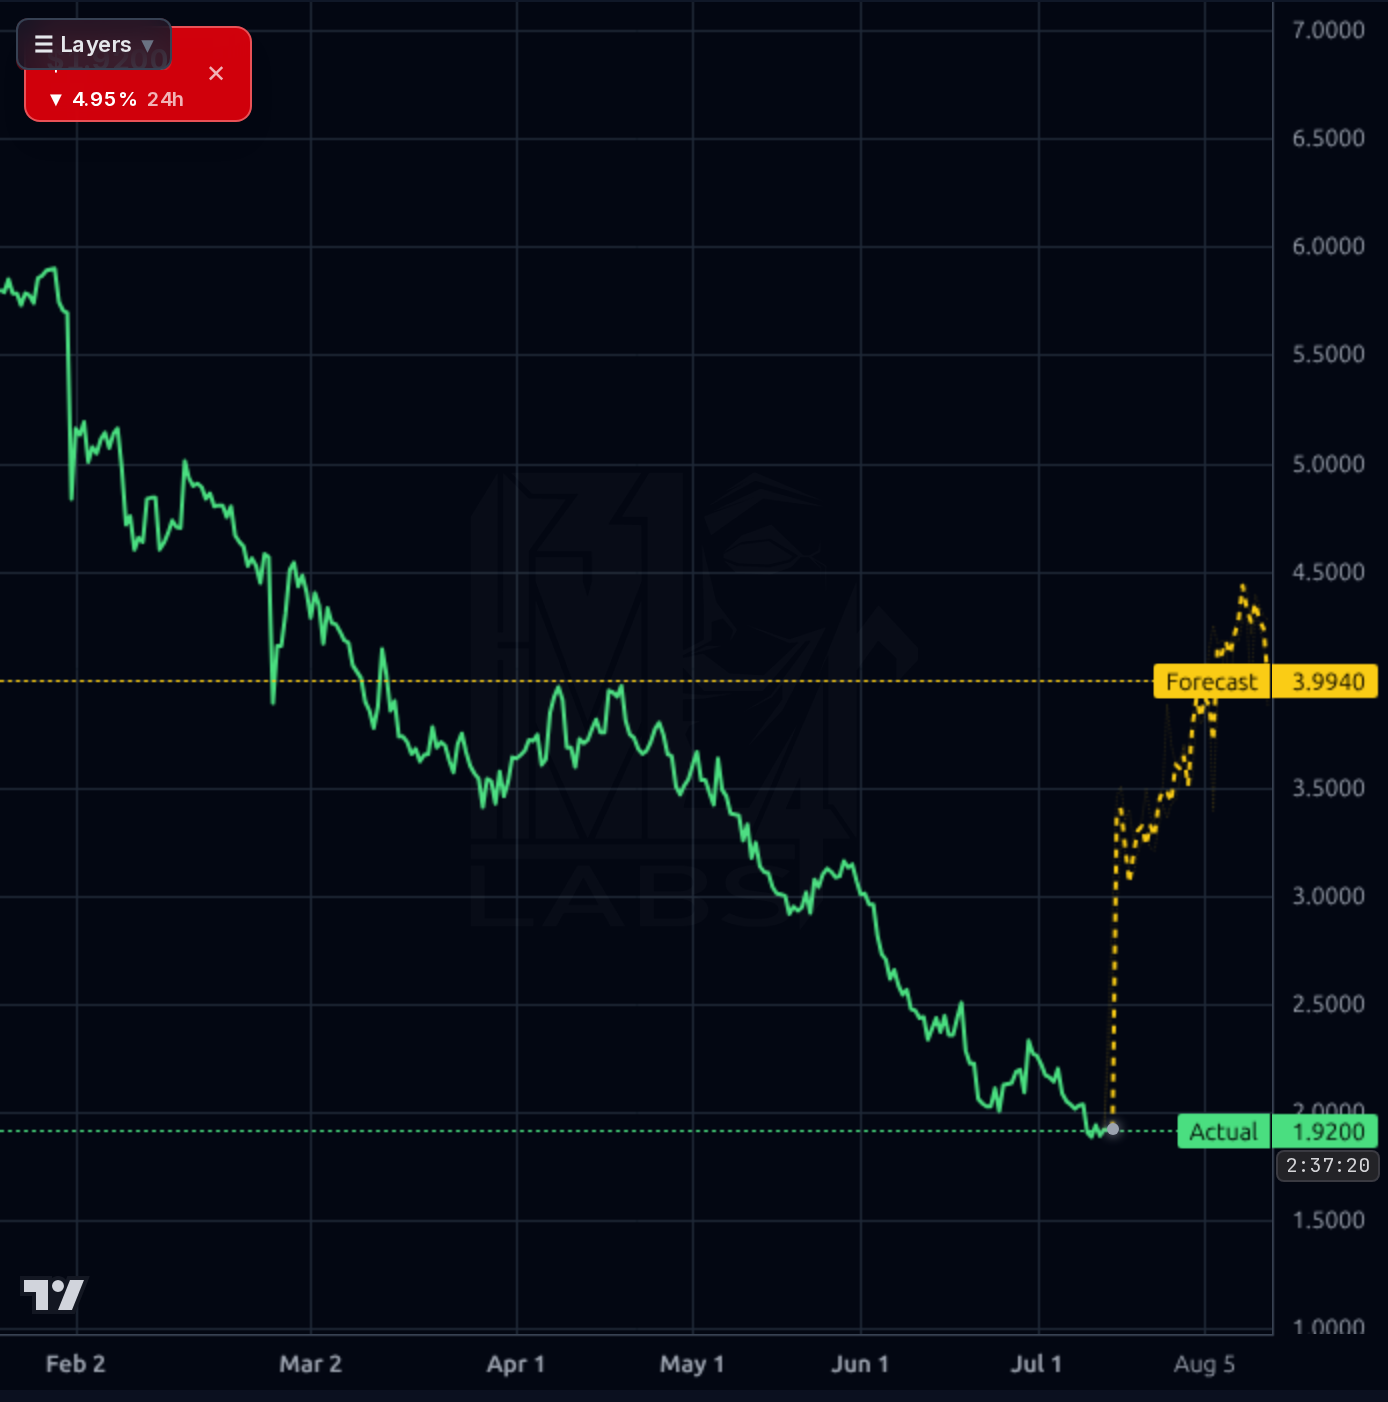
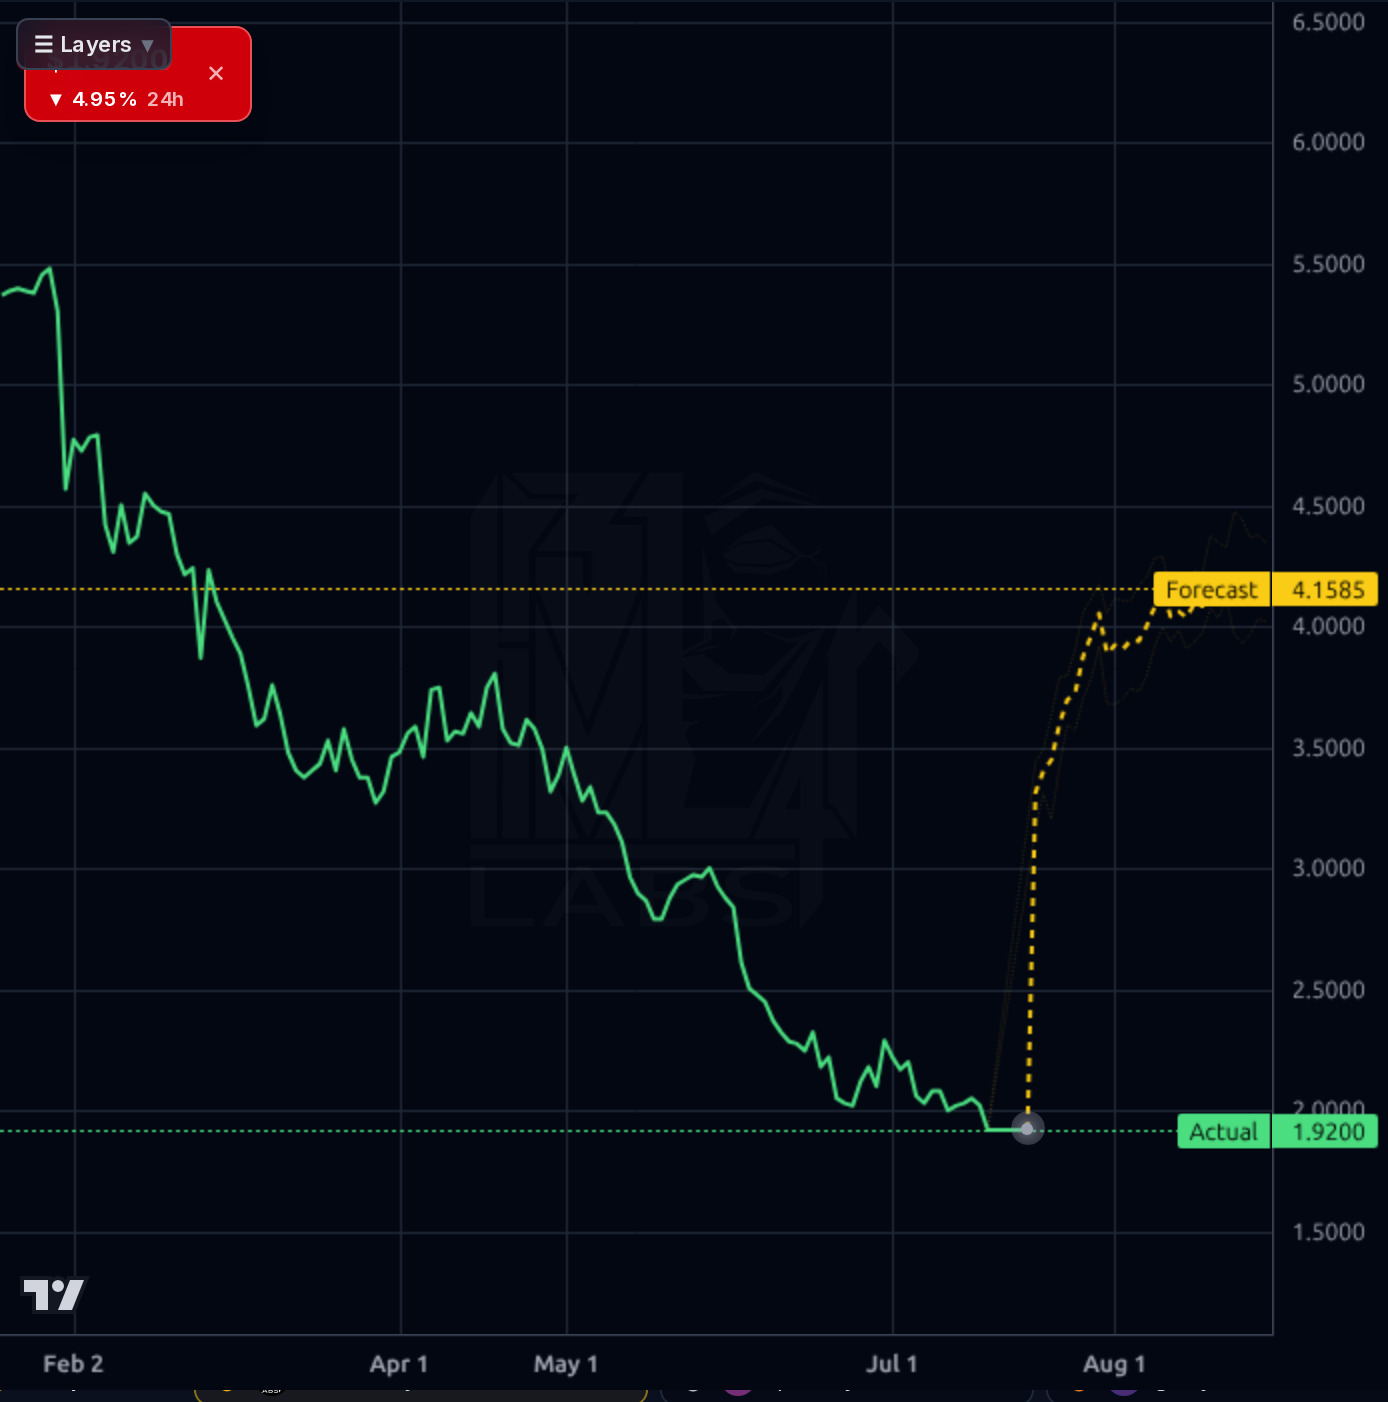
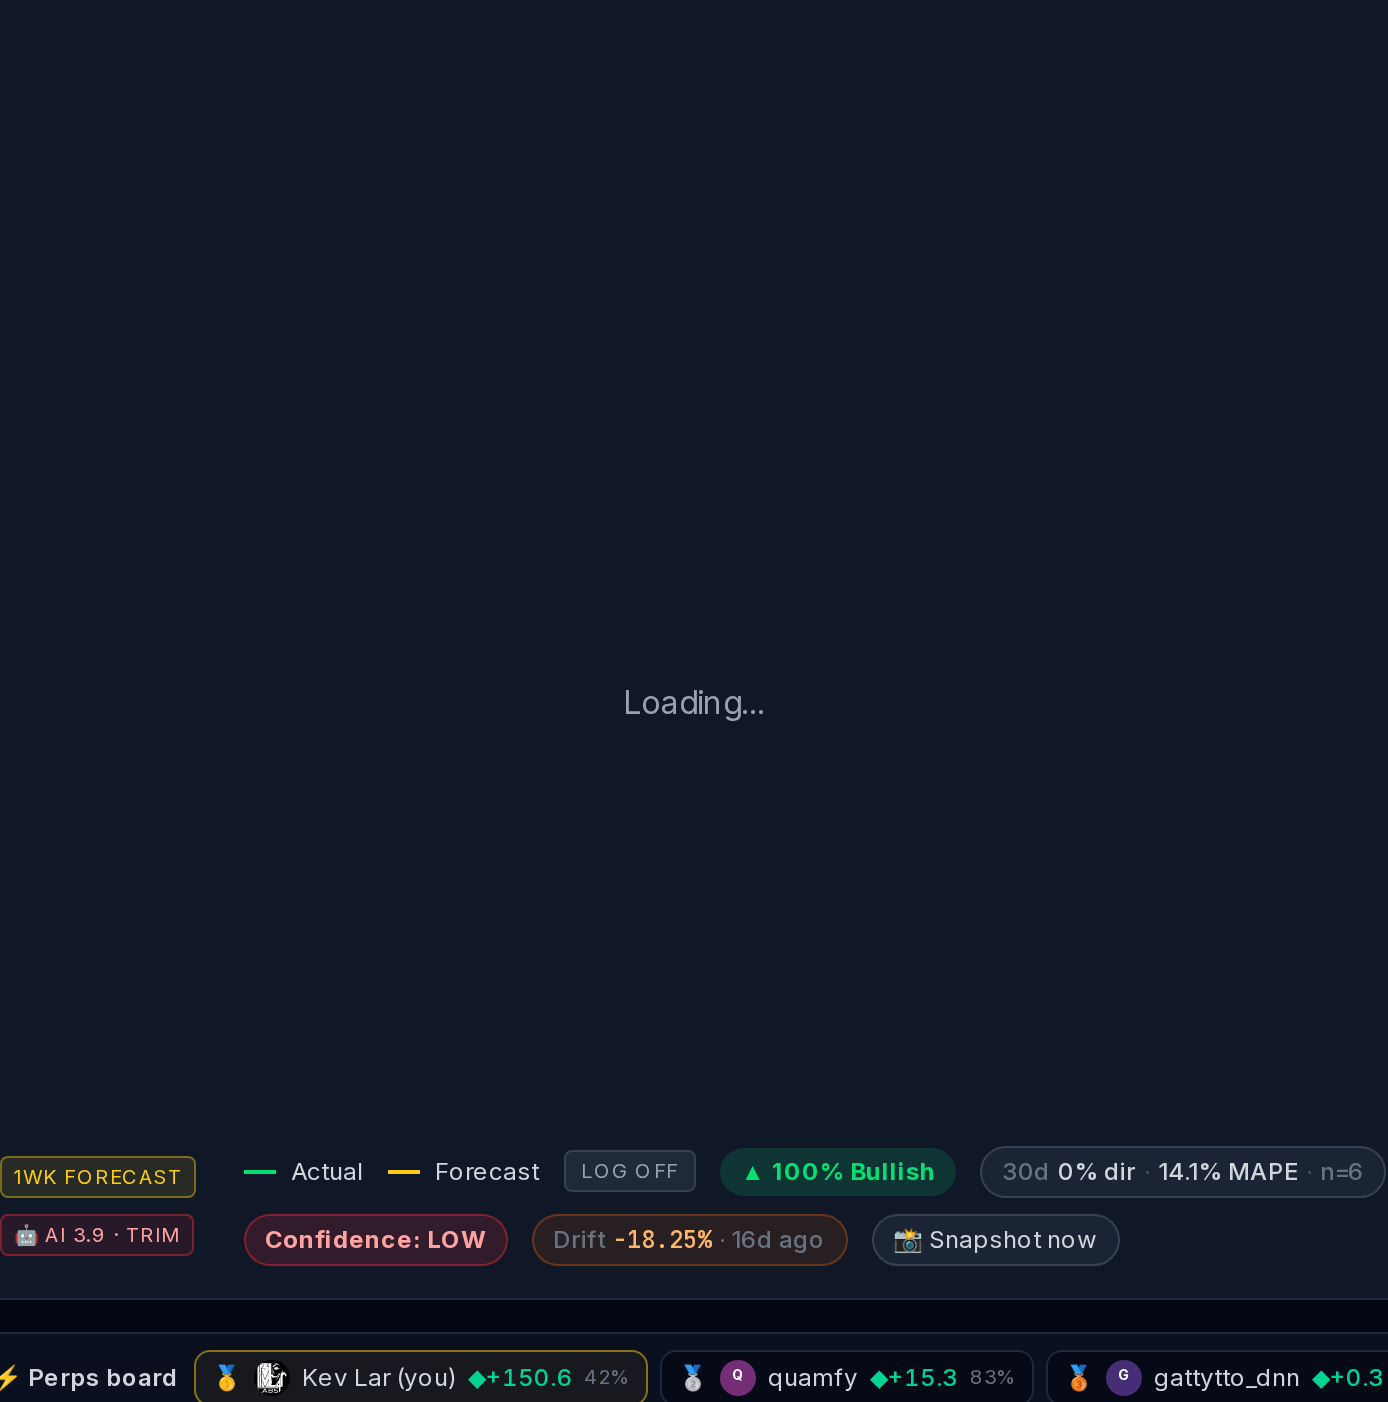
All three timeframes are unambiguously bearish. On the daily and 4h charts, price has collapsed from ~$5.50 in February to $1.92 currently, a -65% peak-to-trough decline, and now sits directly on the $1.98 52-week low. SMA200 distance is -55.24%, SMA50 -25.57%, SMA20 -9.22% — a classic stair-step downtrend with no evidence of accumulation. RSI(14) at 29.26 signals oversold, but oversold in a broken tape is not a buy signal. The Kronos AI forecast band shows a sharp V-reversal to $3.99 (1h) and $4.16 (1d) with a 100% bullish probability, but the model's own realized directional accuracy on this name is 38% vs 62% naive at 1d and 0% vs 100% at 1wk with 73% MAPE — the forecast is actively worse than a coin flip here and must be heavily discounted. Key levels: immediate support $1.87 (52w low print), then air-pocket to $1.50-$1.60; resistance layered at $2.15 (recent chop), $2.35, and $2.85 (prior consolidation). Short interest of 20.94% with 3.34 days-to-cover creates squeeze optionality but only on a genuine catalyst.
The news flow is materially negative and getting worse. On July 20 Morgan Stanley cut its price target from $5 to $3 while maintaining Equal-Weight, following Barclays cutting from $5 to $4 on July 7 and consensus target sliding from $5.59 to $3.98 over 45 days. A July 14 Motley Fool piece explicitly framed the 19%+ dividend yield as a 'warning, not a gift' — a yield-trap thesis that aligns with the arithmetic. The Two Harbors acquisition setback (July 16) is another overhang, with a Simply Wall St. piece flagging that a 5-year -60% share price decline provides context for why any valuation optimism has been persistently wrong. The one positive is a June 25 KBW upgrade to Outperform, but that has already been faded and their target was subsequently cut. Retail social sentiment (75% bullish) is a mild contrarian negative given deteriorating primary-source signals.
- Q1'26 origination volume of $44.9B (+39% Y/Y) is the highest Q1 in company history — operating leverage is real if it sustains
- Two Harbors acquisition (if it closes on revised terms) would expand MSR portfolio and diversify revenue away from pure origination
- 'Mia' AI assistant projected to handle 12M+ calls in 2026, structurally lowers per-loan cost if scalable
- Wholesale channel share continues to grow — UWMC remains the #1 originator of purchase loans nationally
- Any Fed rate-cut cycle in H2'26 could unlock refinance volume, which carries higher margin than purchase
- Dividend cut/suspension at Aug 6 print is the single largest near-term risk given 329% payout on -$2.23B Q1 OCF
- Capital structure: $16.5B debt vs $229M equity means any MSR mark reversal or warehouse funding disruption is existential
- Sell-side target compression is relentless — consensus $5.59→$3.98 in 45 days signals institutional derating
- Short interest at 20.94% with 3.34 days-to-cover cuts both ways: squeeze optionality vs conviction bearish positioning
- Two Harbors deal execution risk — a failed or renegotiated deal removes a bull-case catalyst
- Forecast model has 38% directional accuracy vs 62% naive on this name — do not rely on the V-reversal projection
- Break of $1.87 52-week low opens a technical air pocket to $1.50-$1.60 with no prior support
Get AI analysis on any stock
This is one of hundreds of Kronos AI reports — scored fundamentals & technicals, bull/base/bear price targets, a multi-horizon plan, and continuously-updated forecasts across the market. Create a free account to explore them all.
Create your free account →Already a member? Sign in · Join our Discord