WAY — AI Stock Forecast & Price Targets
Published 8/7/2026 · A free sample of K3vl4r’s AI-powered analysis.
Kronos price forecasts, scored fundamentals & technicals, and a multi-horizon plan.
View the live WAY price forecast →
Waystar is a high-margin healthcare payments software business trading at a compressed forward multiple (~12.4x) after a ~31% YTD drawdown, with Q2 revenue growth reaccelerating to 18% and analyst consensus firmly Buy. Near-term technicals are constructive off the mid-$17s low, but the stock sits well below the 200DMA and faces the drag of two recent CEO sales plus elevated leverage; risk/reward is favorable but not urgent.
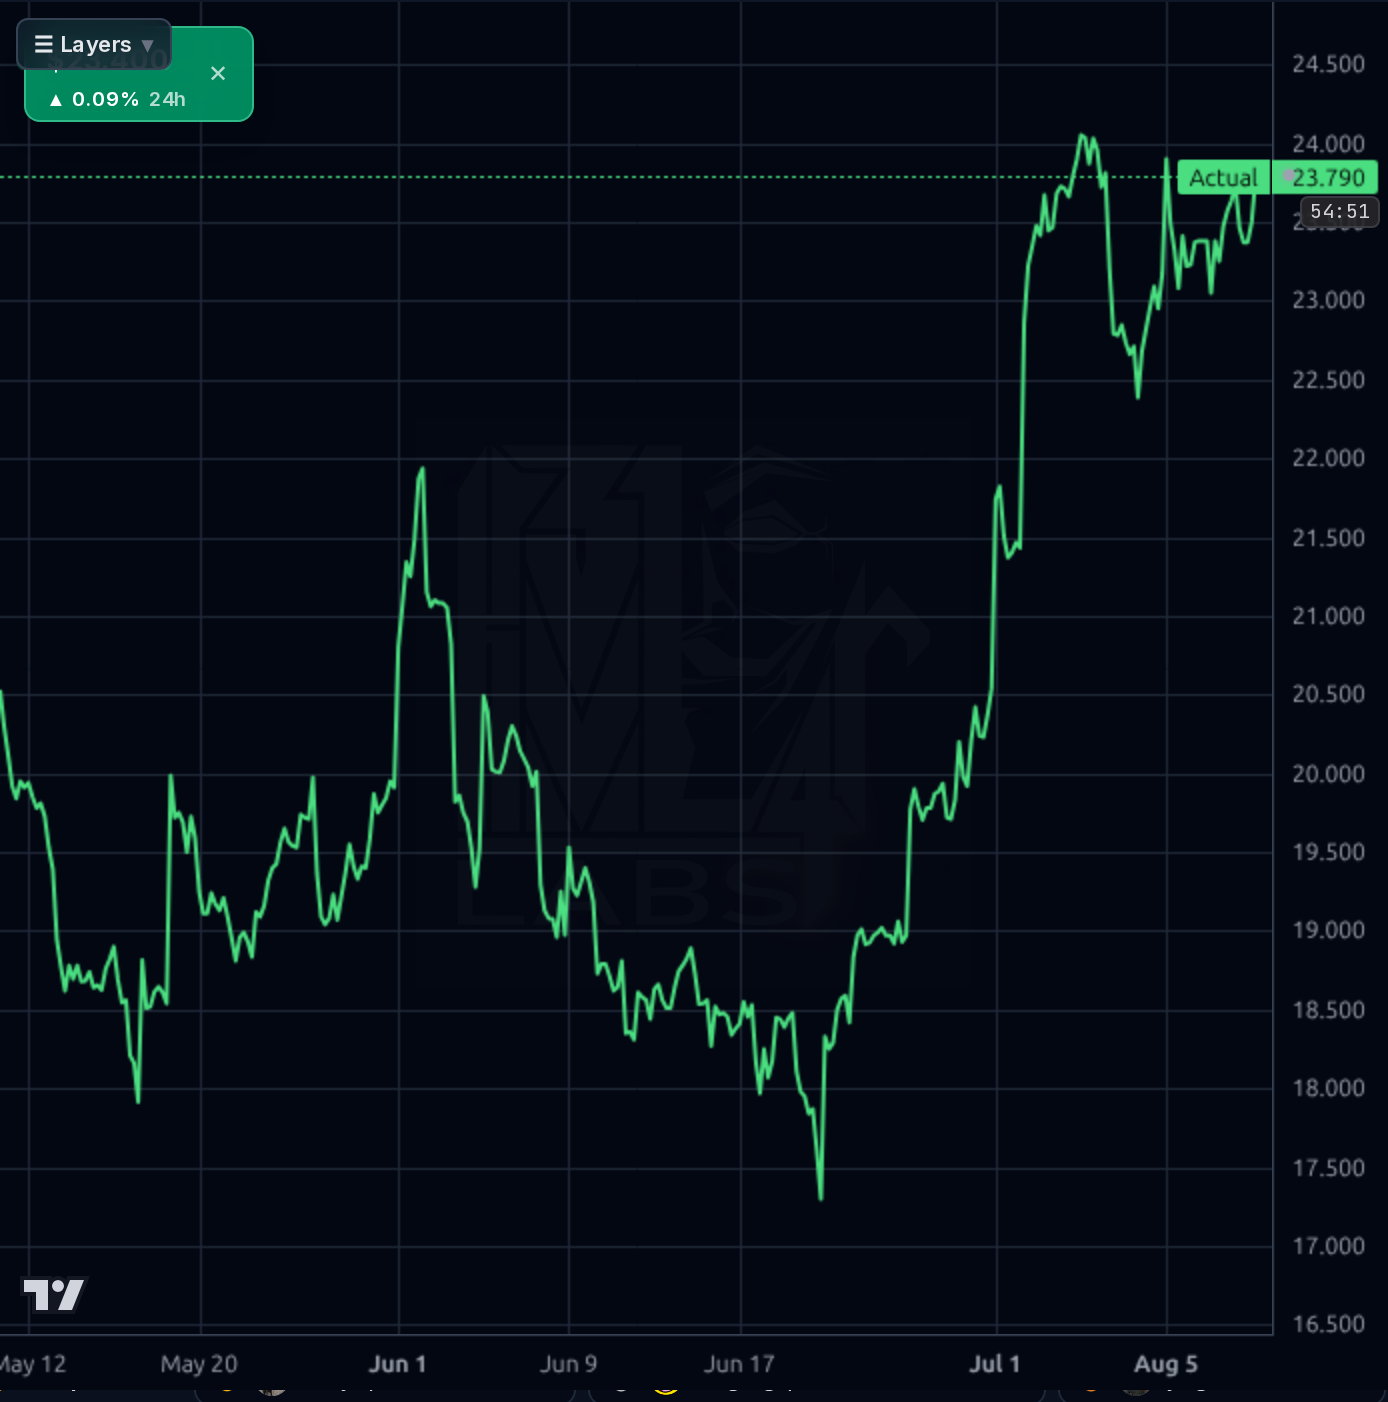
1-4 weeks: constructive but not chase. Prefer accumulation on pullbacks to $22.40–$22.80 (recent higher-low, ~1x ATR below spot) with a first target at $24 breakout, then $26. Invalidation on a daily close below $21 (breaks the recovery structure and puts $19 back in play). Keep starter size (1/3 of intended) given the stock has already run +17% quarter-to-date and short interest is 9.95% (5-day cover) — either fuel or a warning depending on tape.
1-6 months: base case is a re-rate toward $28–$30 as raised guidance compounds and forward multiple normalizes from ~12x toward peer HIT range (15–17x forward). That implies ~20–30% upside; combined with Street $33 target and Kronos 1wk/1d bands ($28–$33), the risk/reward is skewed positive. Catalysts: further AI-RCM booking momentum, sell-side target restatements upward, and October 28 Q3 print. Change-my-mind: guidance walk-down, further insider selling clusters, or a break of $21 support on volume.
1-3 years: WAY is a category leader in cloud-based healthcare payments/RCM, a secular growth vertical with sticky enterprise contracts and 69% gross margins pointing to a durable moat. The path is high-teens revenue growth compounding into 25–30% operating margins as the platform scales, funding de-leveraging (currently $1.48B debt vs $434M EBITDA = 3.4x). Fair long-term value at 20x forward earnings on ~$2.50 EPS (2028) = ~$50. Biggest structural risk is healthcare reimbursement/regulatory reform disrupting the payer-provider transaction economics that WAY monetizes, plus consolidation pressure from larger platforms (Epic, Oracle Health).
Revenue growth is reaccelerating: Q2'26 revenue of $319.7M (+18.1% Y/Y) with sequential improvement from $313.9M (Q1) and $303.5M (Q4'25), and TTM sales of $1.21B. Profitability is high-quality — gross margin ~69%, operating margin ~24%, EBITDA margin ~37% ($117.5M in Q2), and TTM FCF of $314M against a $4.48B market cap yields ~7% FCF yield (P/FCF 18.2x). EPS Q/Q +18.6% and Y/Y TTM +44% confirm operating leverage flowing to the bottom line. The balance sheet is the soft spot: $1.48B total debt vs only $12.6M cash (down from $421M in Q3'25 after a large capital deployment/acquisition footprint that pushed assets from $4.75B to $5.87B), though D/E at 0.37x and current ratio 1.85 are still manageable and interest coverage looks fine given $434M EBITDA. Capital allocation is skewed to reinvestment/M&A rather than buybacks or dividends. On valuation, trailing P/E of 33x looks rich but forward P/E of ~12.4x and PEG 0.81 with 15% forward EPS growth are compelling for a subscription-like healthcare IT franchise.
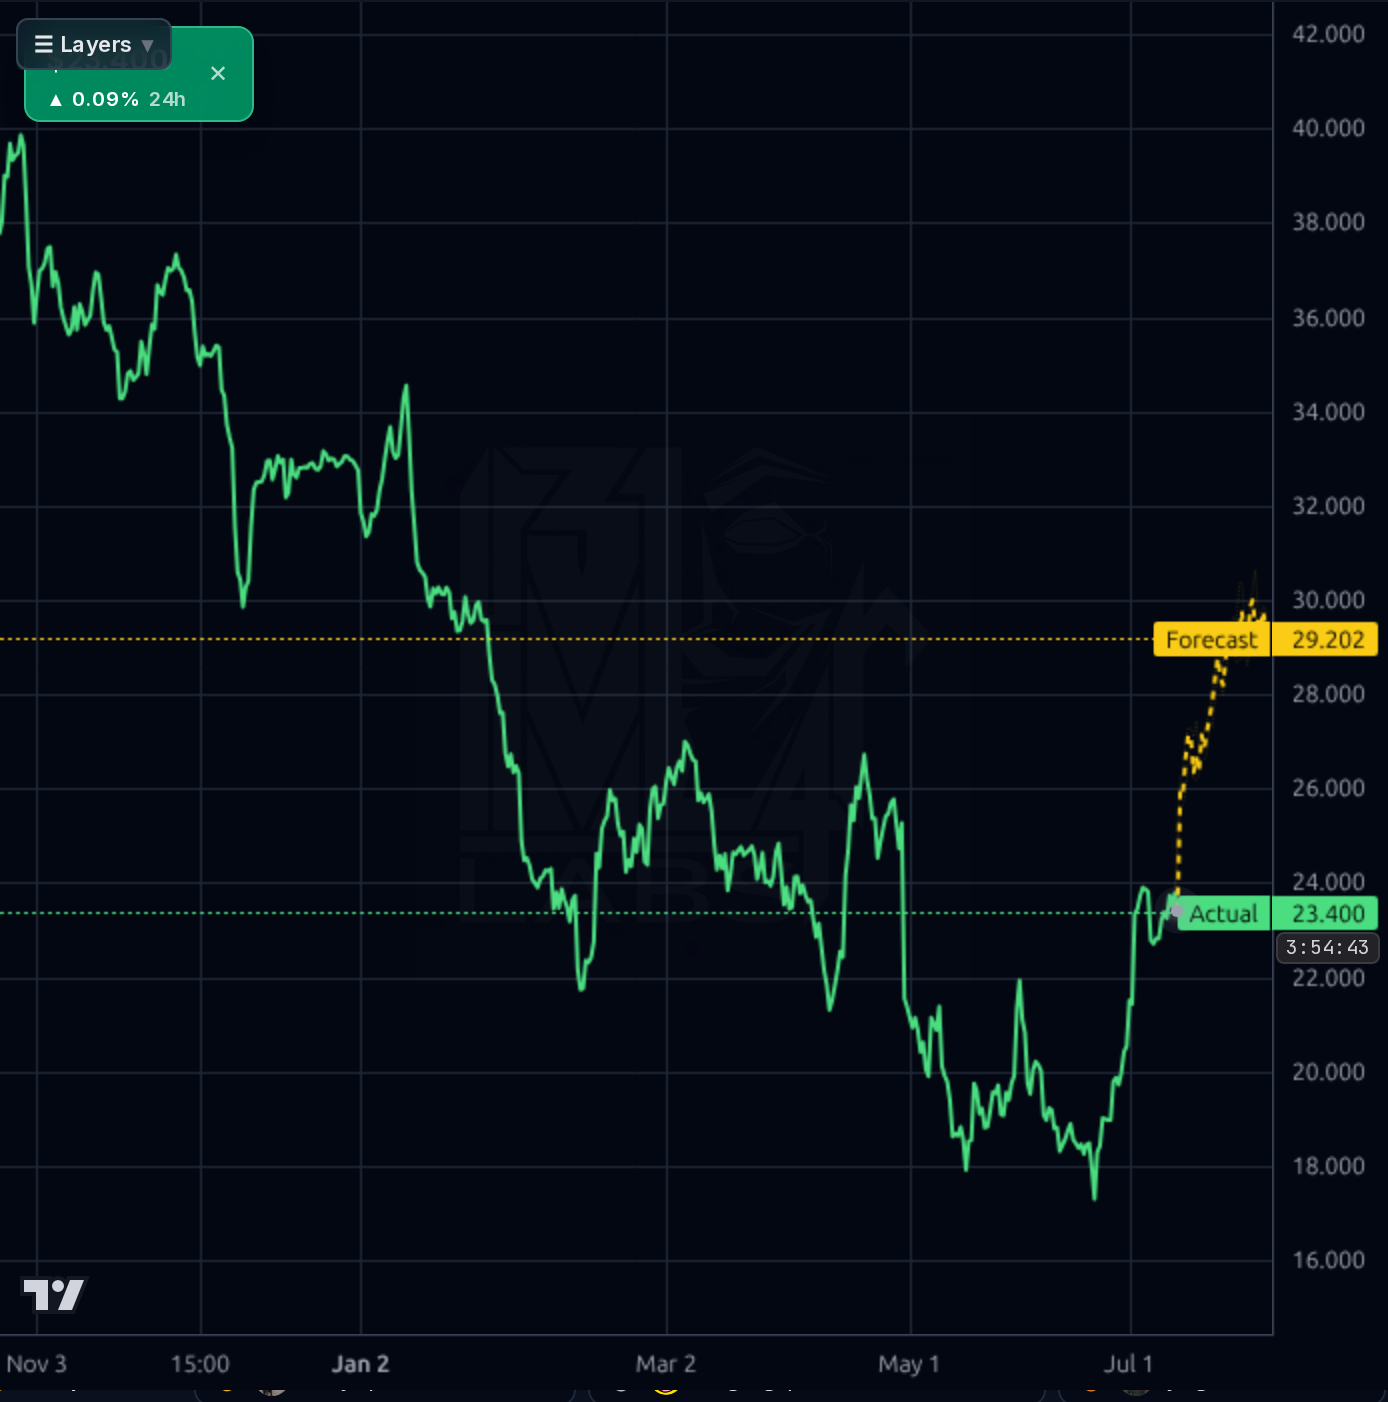
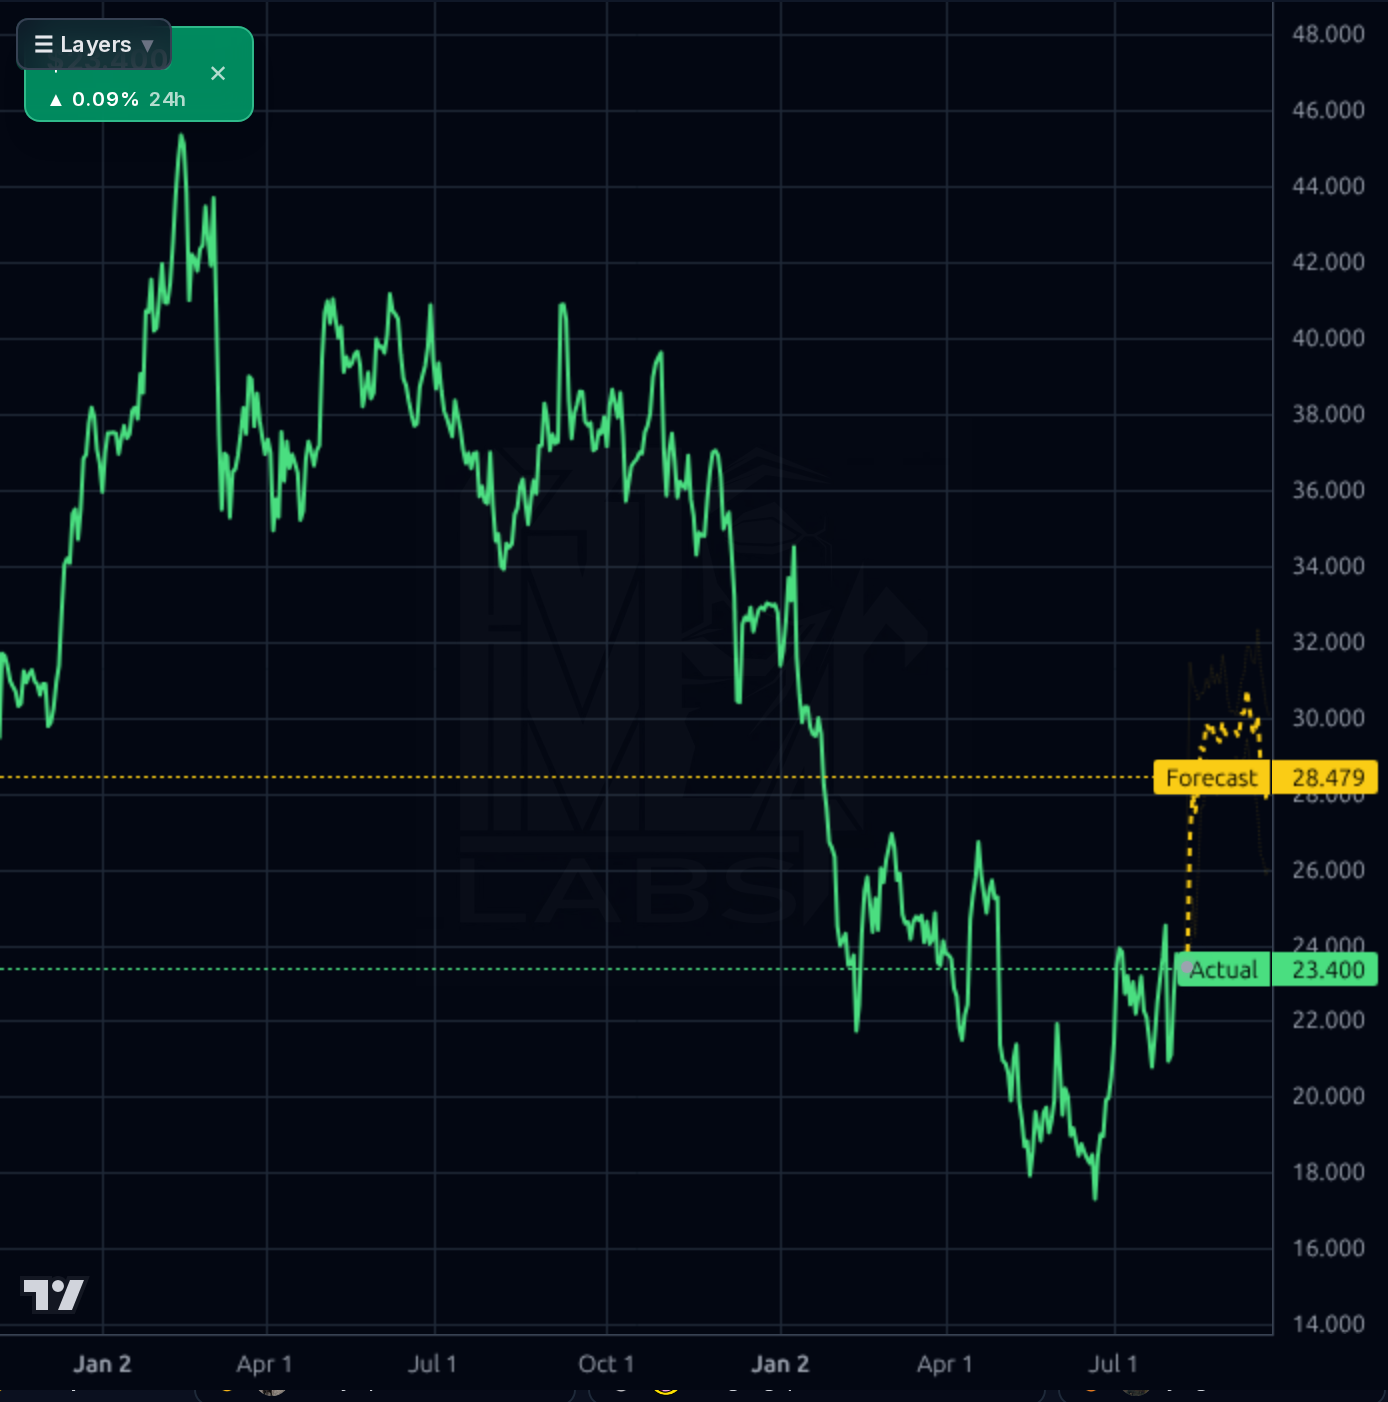
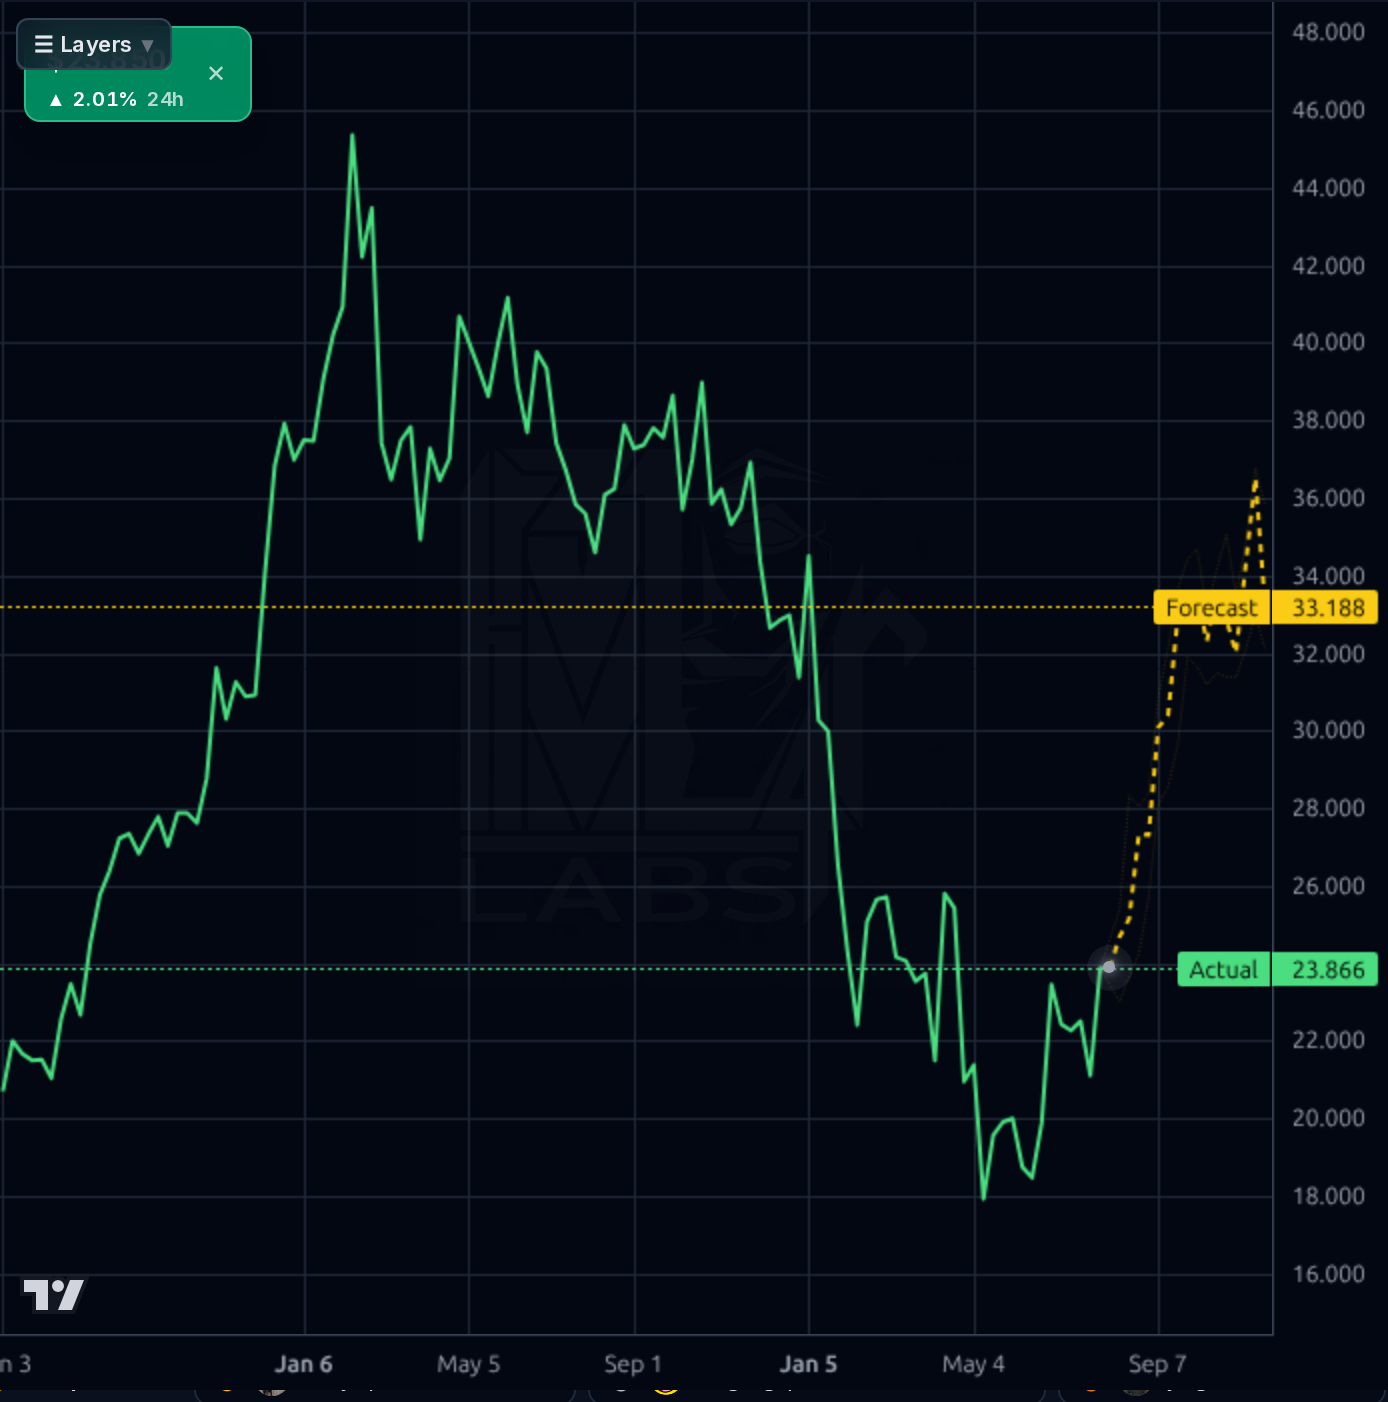
Multi-timeframe picture: the weekly/daily view shows a full round-trip from $45 (Jan '25) down to $17.26 low, with price now at $23.37 — up ~35% off the low but still −44% from the 52W high and −11.9% below the 200DMA (SMA20 +3.7%, SMA50 +11.1%, so short/intermediate trend has flipped up). The 1h chart shows a clean impulsive move from ~$17.50 through $22 into a $24 high, then a healthy pullback to $22.40 and a re-test toward $24 — constructive higher-low structure. RSI 55 leaves room. Resistance stacks at $24 (recent swing high), then the $26–$27 gap-fill zone, with $30 as the next major supply shelf. Support: $22.40 (pullback low), then $21, then $19. The 4h and 1d Kronos bands lean bullish ($28–$33) and the 1wk band stretches to $33–$36; horizon accuracy is at/near baseline (54% 1d, 67% 1wk), so treat those as directional bias rather than precise targets. Perf Week +11.6% and Perf Quarter +17.4% confirm momentum recovery.
Signal: Q2'26 earnings on 7/29 were well-received operationally — revenue +18% with raised full-year guidance and AI-driven RCM traction — and Zacks upgraded to Buy on 8/3. However, three sell-side desks (UBS, Wells Fargo, Needham) simultaneously trimmed price targets to ~$33 (from $37/$36), so the Street stayed constructive but recalibrated to a more modest upside. Consensus recommendation is 1.16 (Strong Buy) with a $33.30 target, ~42% above spot. Noise: generic 'may rise' social spam and unrelated macro/crypto items in the broader feed. The two CEO Form 4 sales (~$1.6M combined on 7/15–7/16) are a mild negative — likely planned/10b5-1 given size relative to insider ownership of 28.7%, but worth flagging.
- Q2'26 revenue +18% Y/Y with full-year guidance raised, driven by AI-powered RCM adoption per the earnings call
- Sequential revenue acceleration (Q4'25 $303M → Q1'26 $314M → Q2'26 $320M) shows the growth reacceleration is real, not one-off
- Balance sheet deployment (assets grew $1.1B Q/Q in Q4'25) suggests M&A/platform expansion is being monetized into 2026 bookings
- EBITDA margin expanding from ~35% (Q3'25) to ~37% (Q2'26) — operating leverage inflection point
- Zacks upgrade to Buy (8/3) plus 1.16 consensus (Strong Buy) with a $33 average target indicates institutional narrative is turning
- Leverage: $1.48B debt against just $12.6M cash post-deployment; any EBITDA hiccup pressures the 3.4x leverage ratio
- CEO sold ~$1.6M across two days (7/15–7/16) right before the print — small in context but worth monitoring for continuation
- Stock is still −44% from 52W high and −11.9% below 200DMA; broken chart structurally, needs sustained closes >$26 to confirm reversal
- Sell-side just cut targets from $36–$37 to $33 despite the beat — signals slowing incremental upside vs prior expectations
- Healthcare IT regulatory risk (payer/provider reimbursement changes) could compress transaction-based revenue
- Short interest 9.95% / 5.06 days-to-cover creates two-way tape risk
- Forecast model directional accuracy only 54% at 1d (barely above naive); don't lean on the Kronos $33 forecast as a target
Get AI analysis on any stock
This is one of hundreds of Kronos AI reports — scored fundamentals & technicals, bull/base/bear price targets, a multi-horizon plan, and continuously-updated forecasts across the market. Create a free account to explore them all.
Create your free account →Already a member? Sign in · Join our Discord