WING — AI Stock Forecast & Price Targets
Published 7/13/2026 · A free sample of K3vl4r’s AI-powered analysis.
Kronos price forecasts, scored fundamentals & technicals, and a multi-horizon plan.
View the live WING price forecast →
Wingstop trades at $153.29, down 54% YoY and 60% off 52-week highs, with a binary Q2 earnings print 16 days away that will validate or invalidate the recovery narrative. Elite unit economics (49% gross, 29% op margin, 24% ROIC) and a rich pipeline (Club Wingstop, Smart Kitchen, international) coexist with severe Q/Q EPS deceleration (-66.5%), a stressed balance sheet (-$799M equity, $1.27B debt), and a still-premium 27x forward P/E. The disciplined stance is HOLD into the print — do not front-run a binary event where prior bullish targets have repeatedly failed to print.
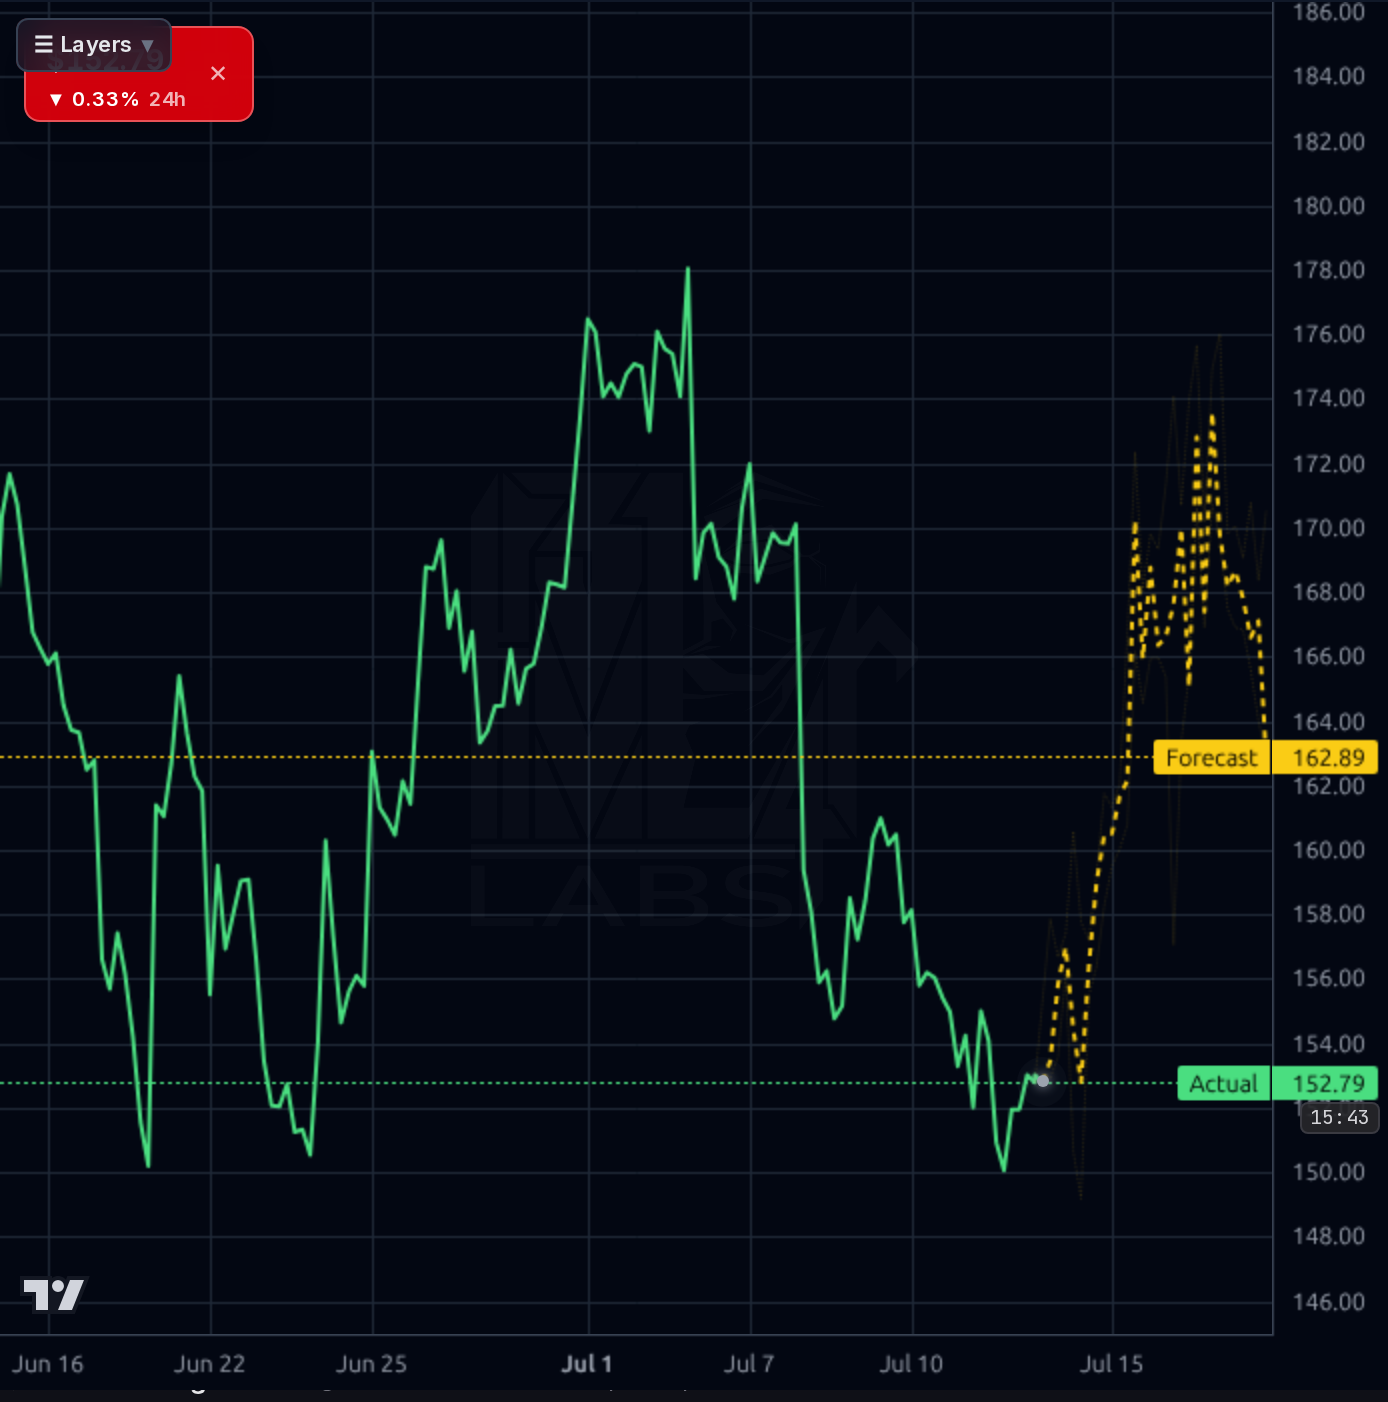
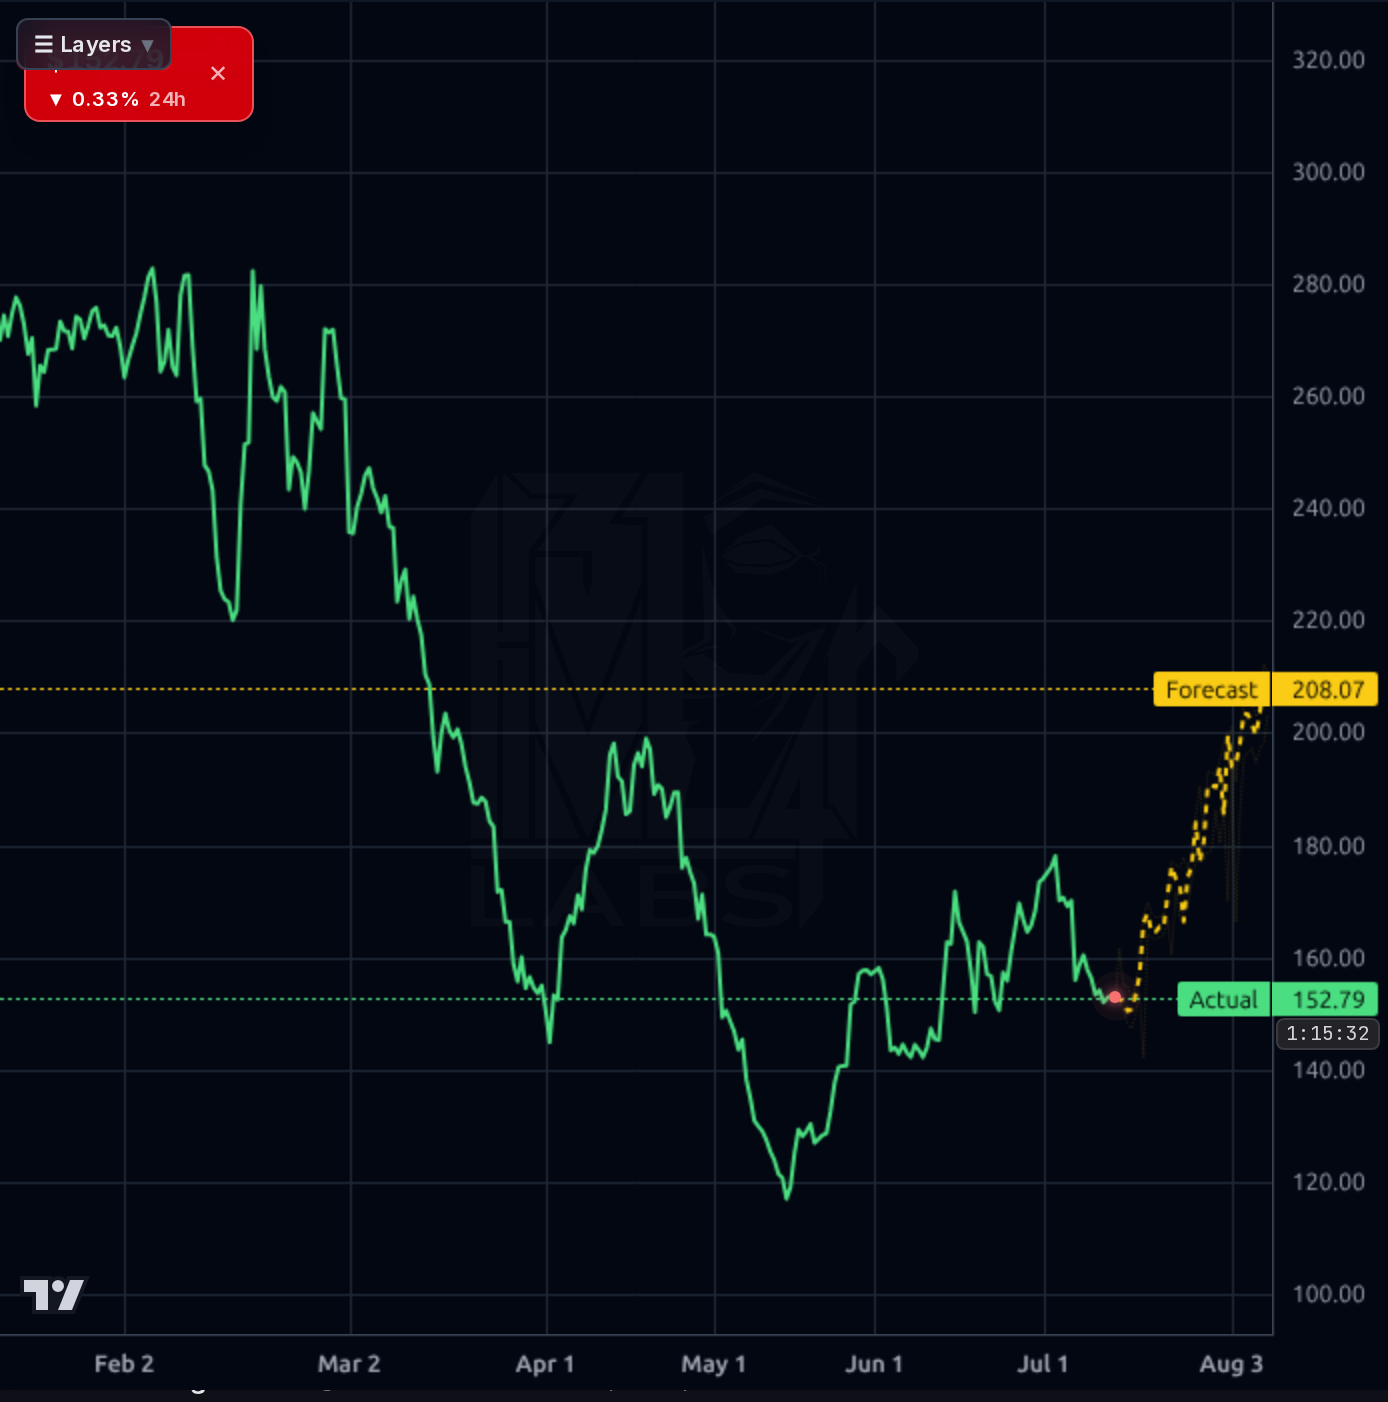
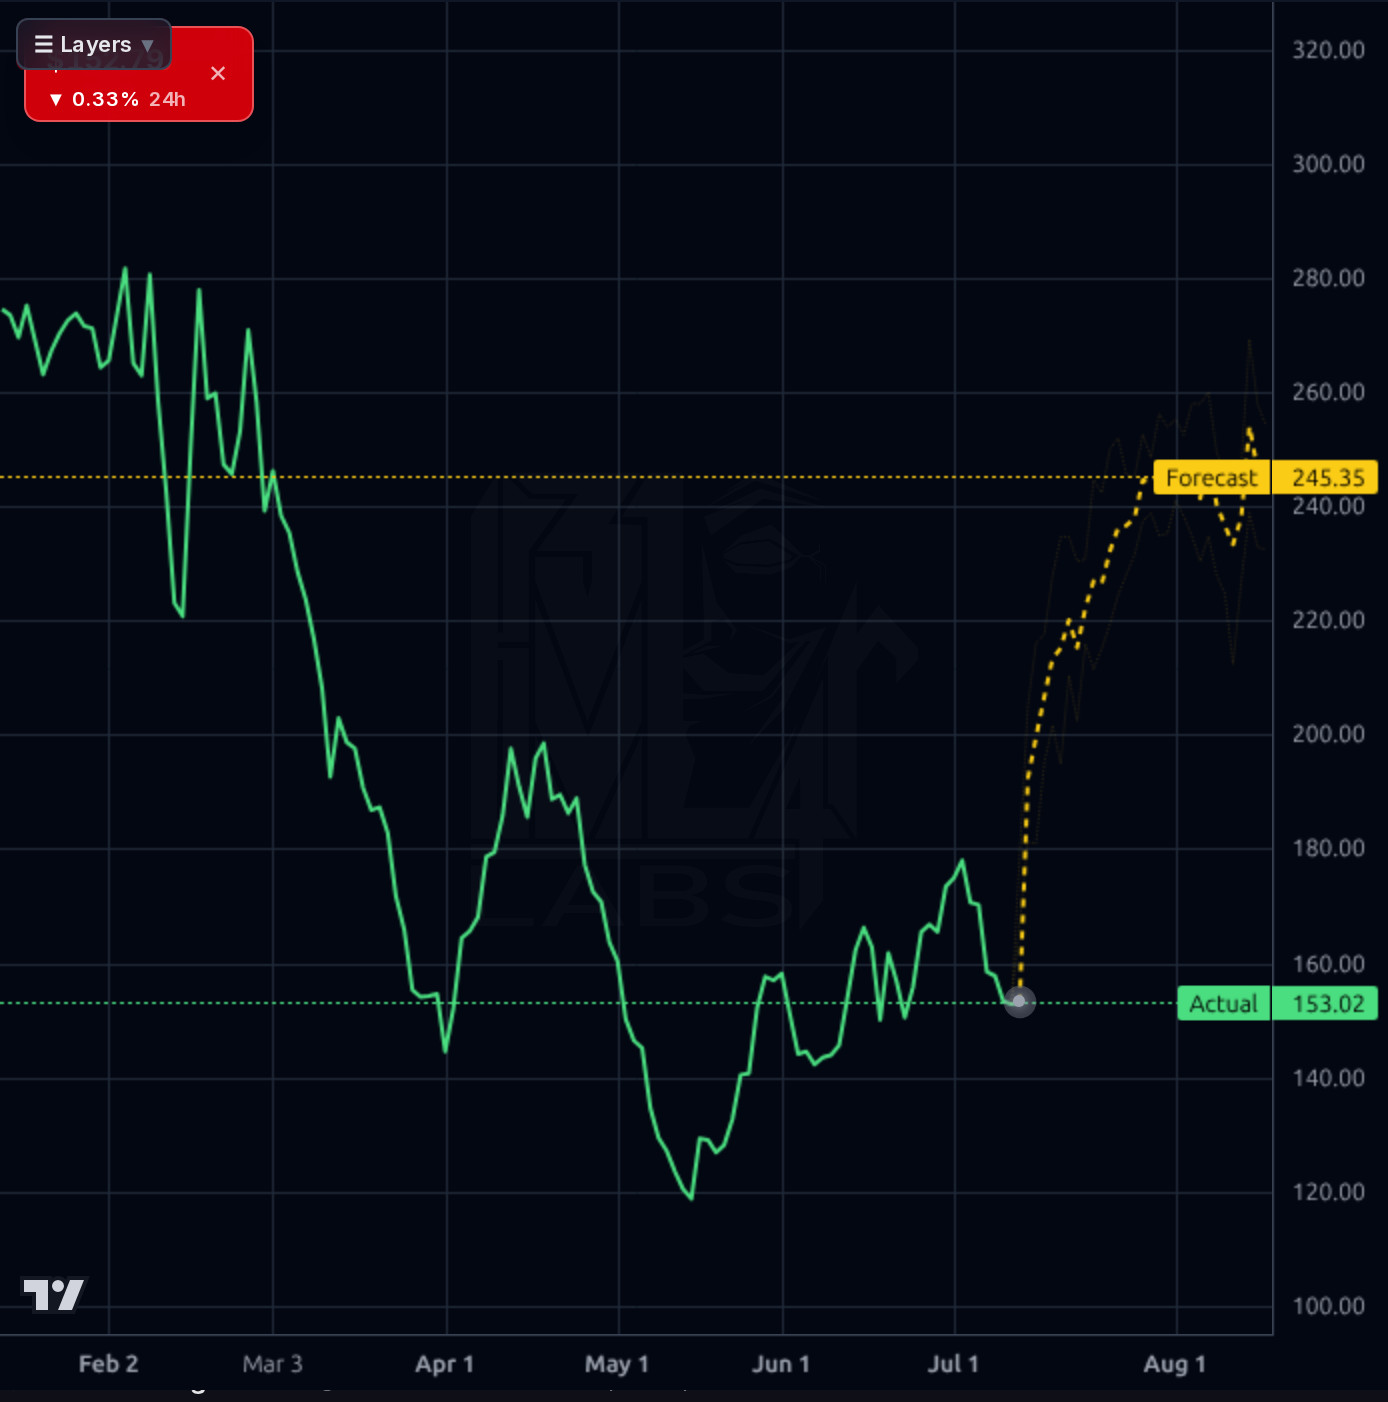
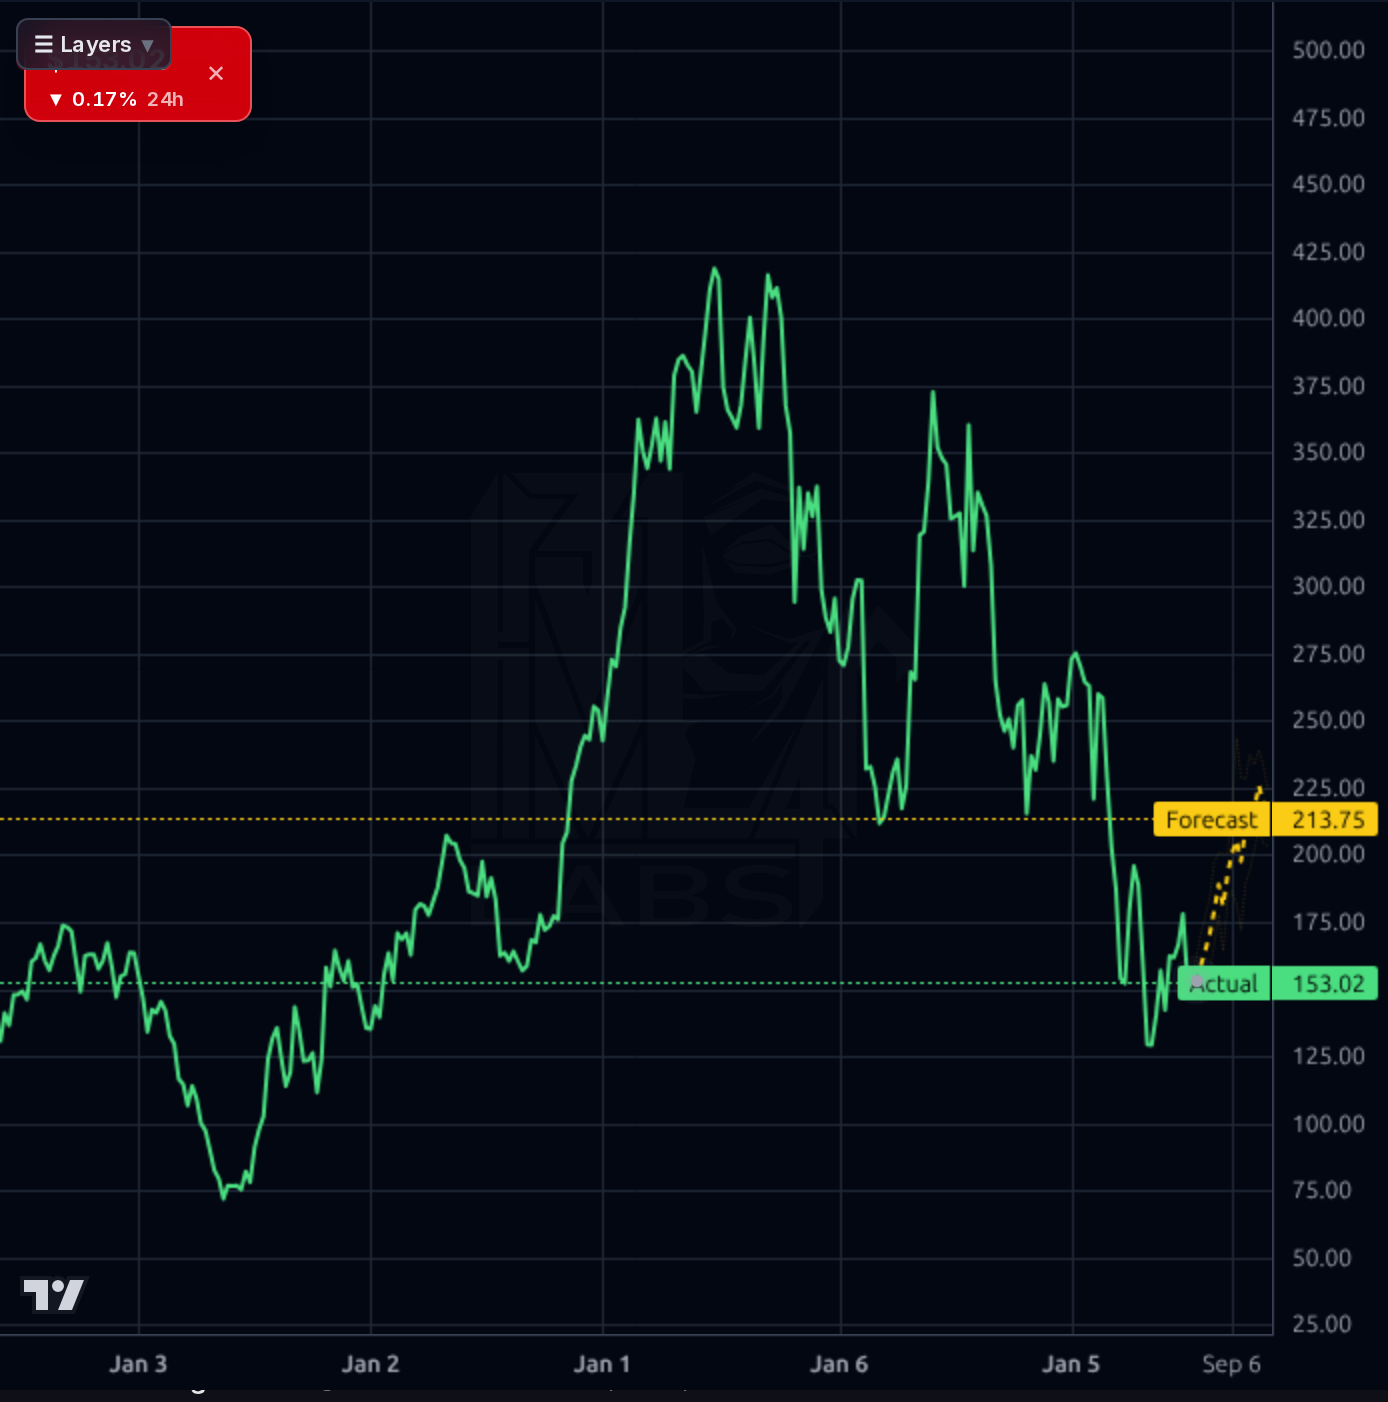
HOLD into the July 29 earnings print (16 days). Do not initiate a directional swing trade — IV is elevated, the gap is binary, and the model's bullish forecast bands have systematically overshot on this name (1D MAPE 27%, 1W beaten by naive). Existing holders keep exposure; do not add. Invalidation for any tactical long is a break of $150 on volume, which opens $135. Upside would need a confirmed reclaim of $170 on volume >1.5x average, and even then $180 remains the decisive wall — do not chase into the print.
1-6 month view hinges entirely on the July 29 print. If Q2 SSS is flat-to-positive with credible Club Wingstop engagement metrics and stable franchisee commentary, the stock can re-rate toward $180-$195 as short interest (15.5% of float, 3.2 days to cover) unwinds. If SSS remains negative and management guides down, expect a retest of $135 and potentially $120. The 15-16% unit growth guide and 73% digital penetration provide a fundamental floor, but at 27x forward P/E the equity does not price in a miss. Expected return range: -20% to +25% over the next 6 months, skewed by the print outcome.
1-3 year terminal thesis is intact for holders: an asset-light royalty compounder with 24% ROIC, best-in-class franchise economics, a credible path from ~2,600 to 10,000 global units, and a maturing digital/loyalty stack. Multi-year drivers are international whitespace (Ireland, Thailand, Italy, Middle East scale-up), Smart Kitchen throughput, and Club Wingstop frequency lift. The biggest structural risk is the balance sheet: -$799M equity and $1.27B debt against a decelerating EPS base leaves no margin for error if SSS remains impaired, and intensifying chicken-category competition (Popeyes, Raising Cane's, Chick-fil-A) can compress unit-level economics enough to slow the royalty engine. A successful re-acceleration justifies $220-$260 in 24-36 months; a structural SSS problem caps the stock in the $140-$170 zone.
The business model remains high-quality: TTM revenue of $709M with 49% gross margin, 29% operating margin, 15.8% net margin, and 24% ROIC — best-in-class for restaurants. Q1 2026 revenue of $183.7M grew 7.4% Y/Y, and quarterly operating income at $50.4M held up, but the EPS Q/Q collapse of -66.5% and TTM EPS Y/Y of -32.6% signal a real earnings reset that the market is discounting. The balance sheet is the primary structural concern: total liabilities of $1.45B against $649M assets yields negative $799M stockholders' equity, with $1.27B debt versus $128.8M cash — a legacy of leveraged returns of capital that removes flexibility. Cash flow quality is still solid: $189M TTM operating cash flow and $87M FCF fund a $1.20 dividend, buybacks (374k shares retired at ~$208 in Q1) and reinvestment, but Q1 FCF of $43.7M is being drawn down against a heavy shareholder-return cadence. Forward P/E of 27.5x and PEG of 1.45 still embed a recovery that has not yet been demonstrated.
The chart is broken across every meaningful timeframe. On the 1D, price is -28.6% below the 200-day SMA and -53% Y/Y, with the stock consolidating in a $150-$160 range after failing repeatedly at $180 resistance. The 1h chart shows a lower-high, lower-low structure from the ~$178 early-July peak down to $150, with a tentative base forming near $152-$154; RSI of 44.8 is neutral-weak. The 4h and 1D charts show the stock stalling right at the March breakdown zone with no reclaim of $170-$180. The model's short-horizon forecast band skews sharply bullish ($162 on 1h, $208 on 4h, $245 on 1D, $214 on 1W) — but realized directional accuracy is 59% on 1D (barely above 55% naive) with 27% MAPE, and the 1W is below naive baseline; these upside bands should be discounted heavily. Weekly Rel Volume of 1.08 and Inst Trans -7.18% show no accumulation footprint. Key levels: $150 pivot (must hold), $135 next major support, $170 immediate resistance, $180 the decisive breakout line.
The signal in the news is a concentration of company-driven catalysts converging around the July 29 print: Club Wingstop loyalty launch (May 27), Smart Kitchen fully deployed, House of Flavor consumer event, and expansion pipeline into Ireland, Thailand, Italy alongside existing Australia/Middle East/Netherlands rollout. Management has guided to 15-16% global unit growth in 2026 with a long-term 10,000-unit target and cites 73% digital penetration — these are legitimate structural drivers. The noise: Q1 2026 saw an 8.7% decline in domestic same-store sales blamed on weather and gas prices, which the market has correctly refused to fully forgive; sell-side notes are split, with a 1.45 recommendation composite and $236.62 average target that sits +54% above spot, versus a Simply Wall St DCF suggesting only ~10% undervaluation. The CEO's public confidence and the loyalty program are real, but SSS re-acceleration remains unproven, and the July 29 print is the only data point that resolves the argument.
- Club Wingstop loyalty program launched May 27, 2026 — primary lever for SSS re-acceleration; watch Q2 engagement/frequency KPIs on the July 29 call
- Smart Kitchen fully deployed across U.S. footprint in Q1 2026, contributing to 5.9% system-wide sales growth and halving service times
- 2026 guide of 15-16% global unit growth, tracking toward a stated 10,000-unit long-term target
- New international market entries announced for Ireland, Thailand, and Italy, layered on existing Australia/Middle East/Netherlands expansion
- 73.2% of FY25 system sales came from digital channels — a moat for order economics and data-driven personalization via Club Wingstop
- Q1 2026 buyback of 374,324 shares at $208.08 avg and 17% 3Y dividend CAGR demonstrate continued capital return despite the leverage
- Binary July 29 earnings print with -66.5% Q/Q EPS already in the tape and Q1 domestic SSS -8.7%; a second weak quarter would break the recovery narrative
- Negative $799M stockholders' equity against $1.27B debt leaves minimal flexibility if SSS stays weak or rates stay high
- Forward P/E of 27.5x and PEG 1.45 still embed a recovery that has not been demonstrated in the reported numbers
- Broken technical structure: -28.6% below 200-day SMA, repeated failures at $180 resistance, and no institutional accumulation footprint (Inst Trans -7.18%)
- Intensifying chicken-category competition from Popeyes, Raising Cane's, and Chick-fil-A pressuring SSS and franchisee unit economics
- Sell-side price target of $236.62 sits +54% above spot — a level that has repeatedly failed to print on this name, suggesting analyst estimates are still catching down
- Model forecast bands overshoot systematically on this name (1D MAPE 27%, 1W below naive baseline) — do not lean on model upside for sizing
Get AI analysis on any stock
This is one of hundreds of Kronos AI reports — scored fundamentals & technicals, bull/base/bear price targets, a multi-horizon plan, and continuously-updated forecasts across the market. Create a free account to explore them all.
Create your free account →Already a member? Sign in · Join our Discord