WTW— AI Stock Forecast & Price Targets
Published 6/14/2026 · A free sample of K3vl4r’s AI-powered analysis.
Kronos price forecasts, scored fundamentals & technicals, and a multi-horizon plan.
View the live WTW price forecast →
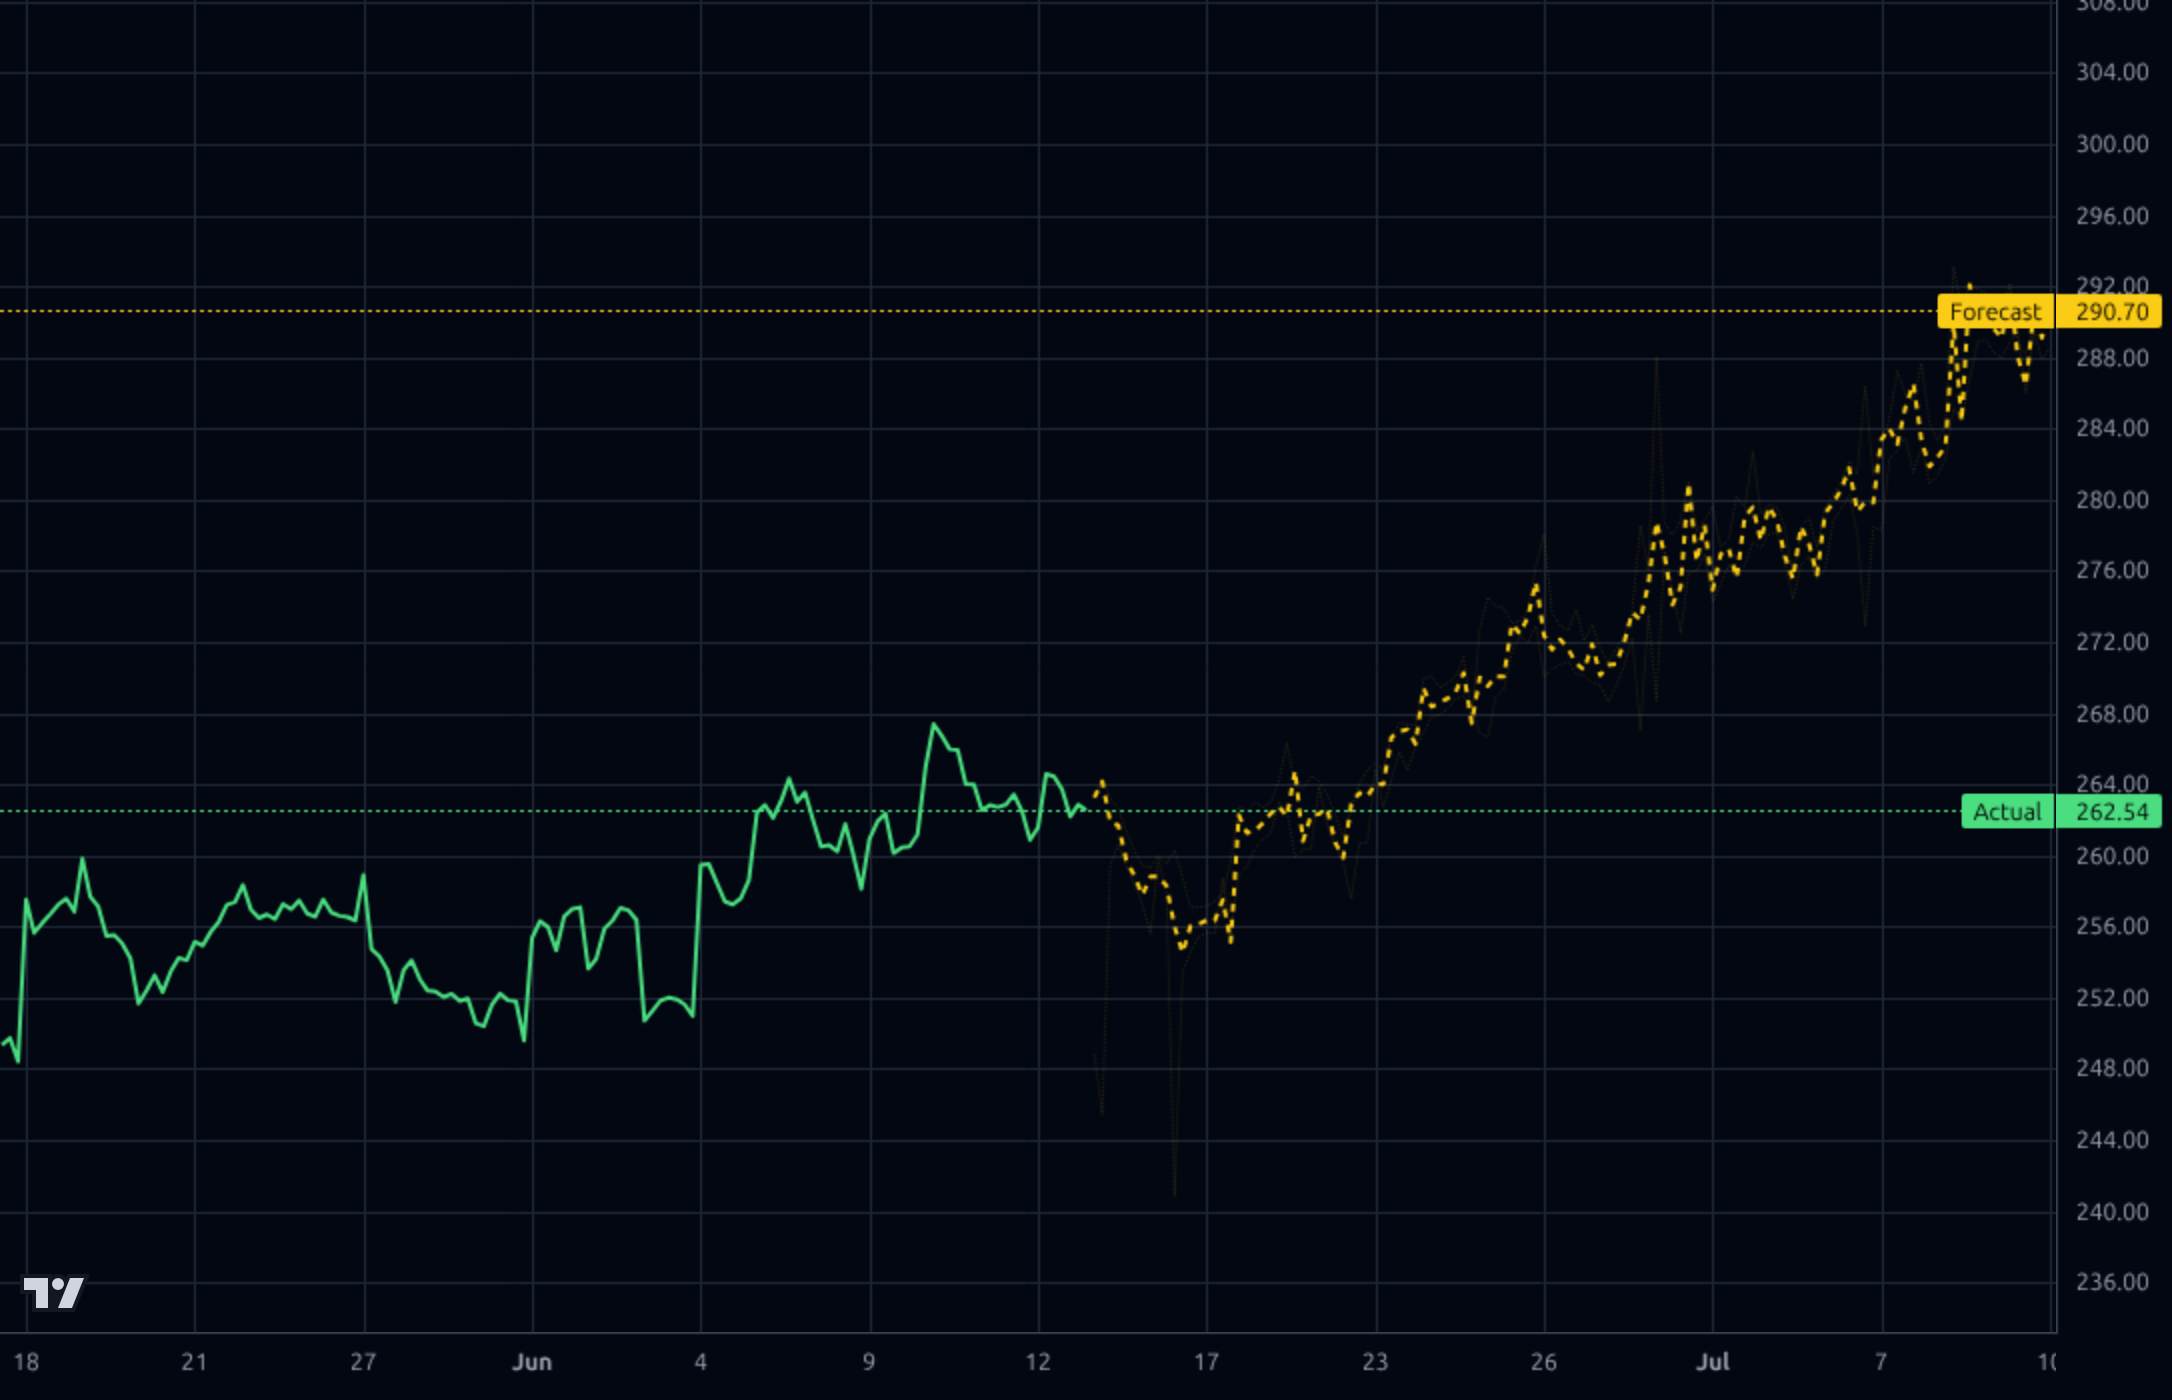
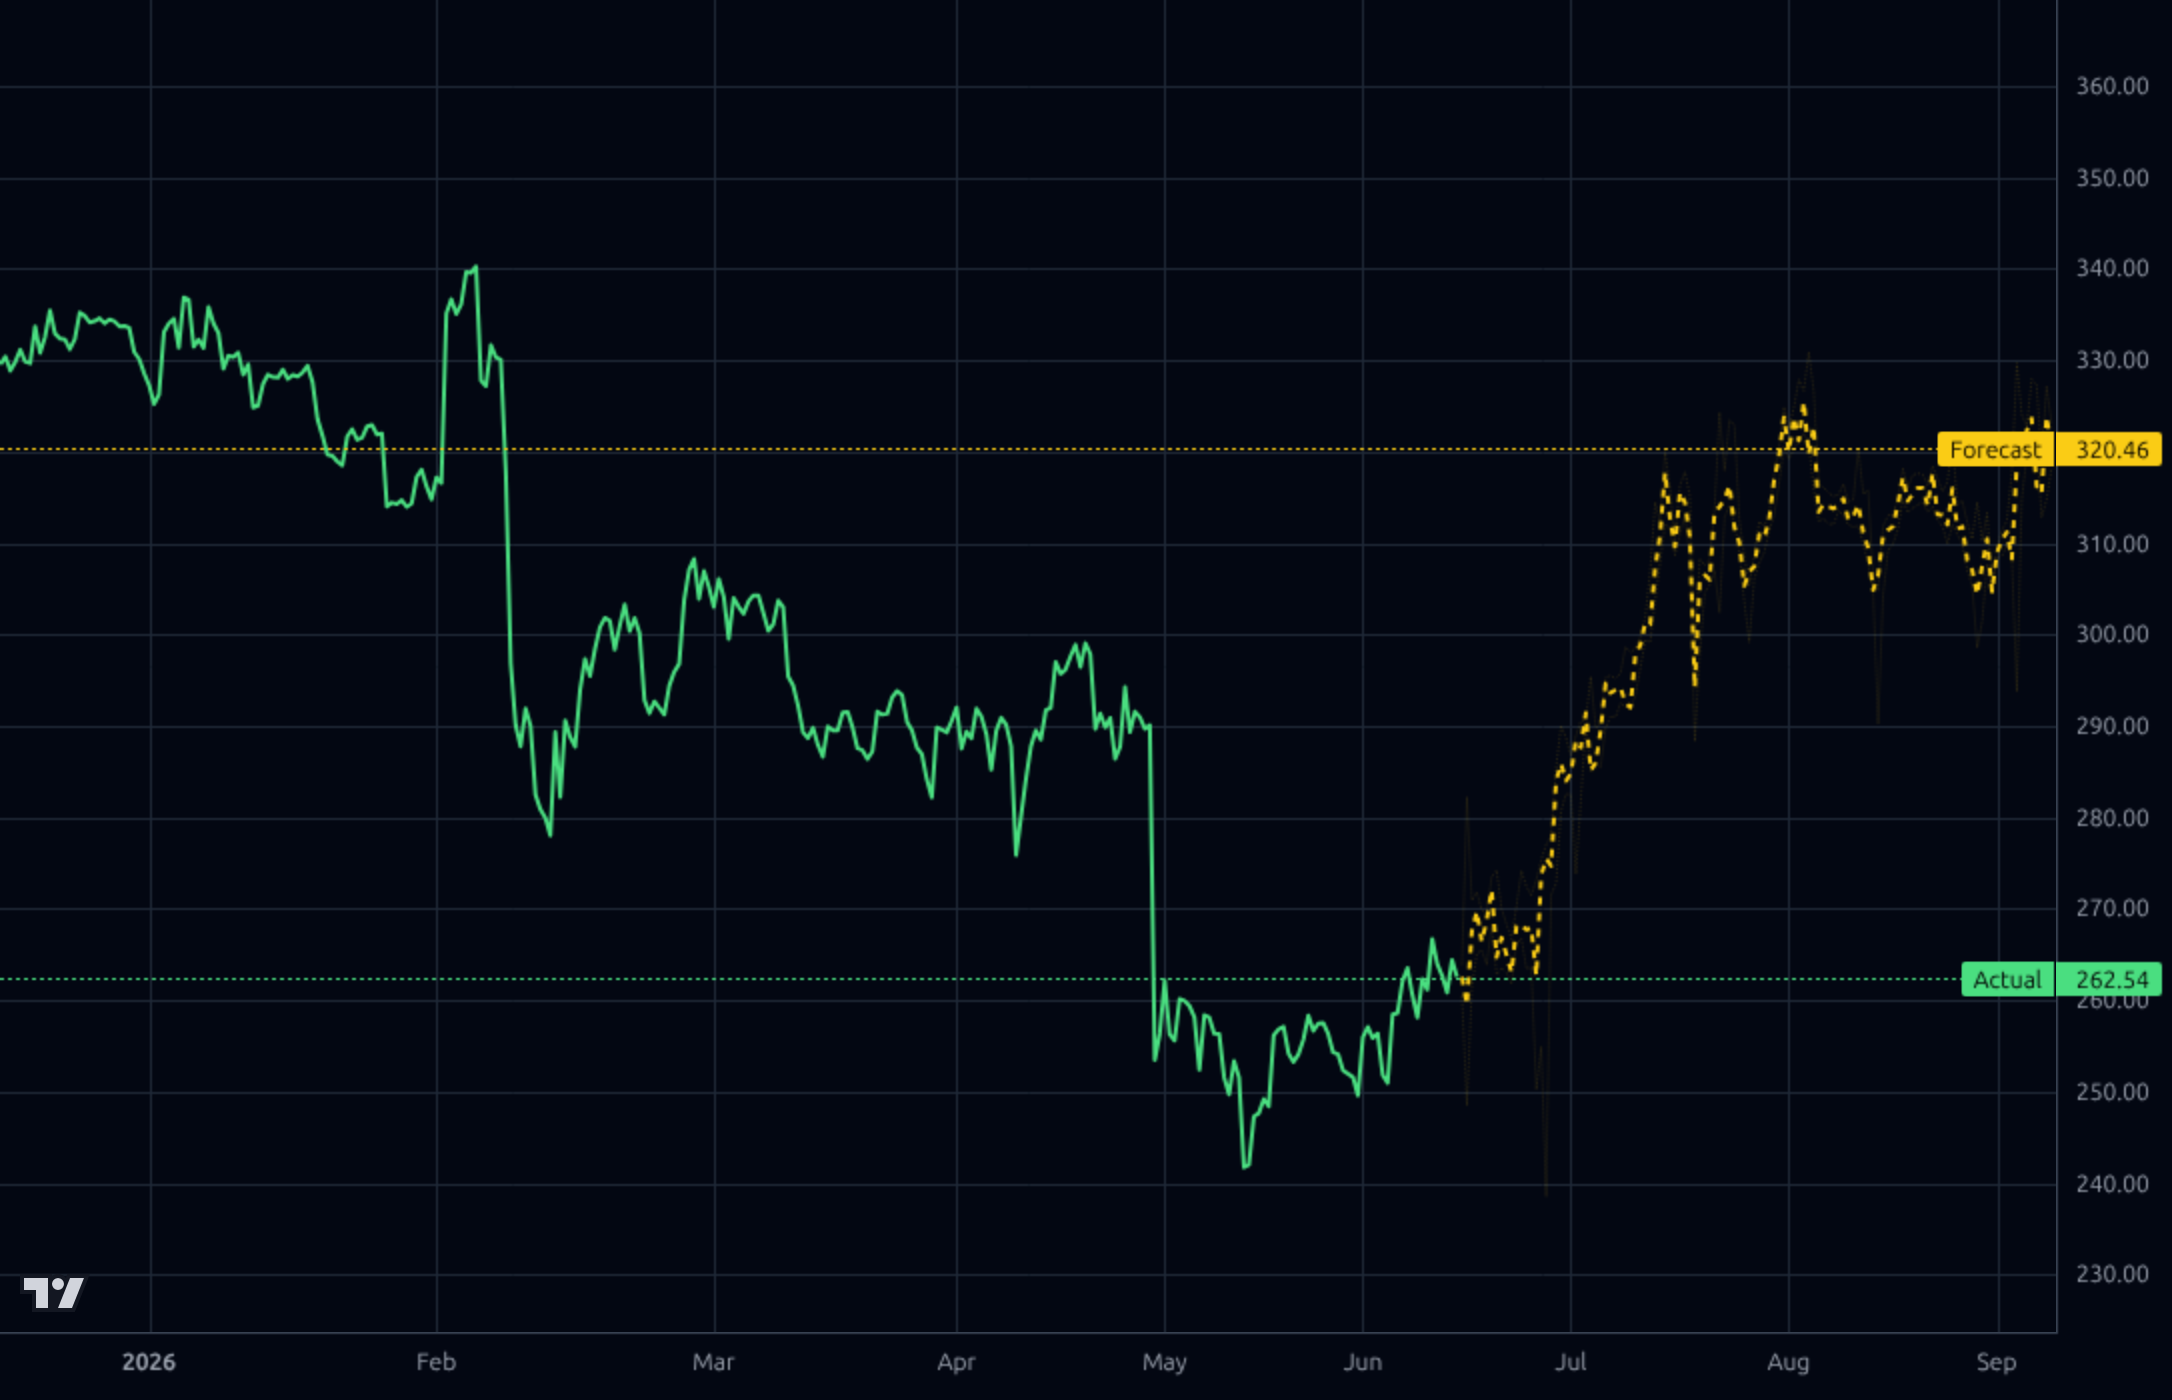
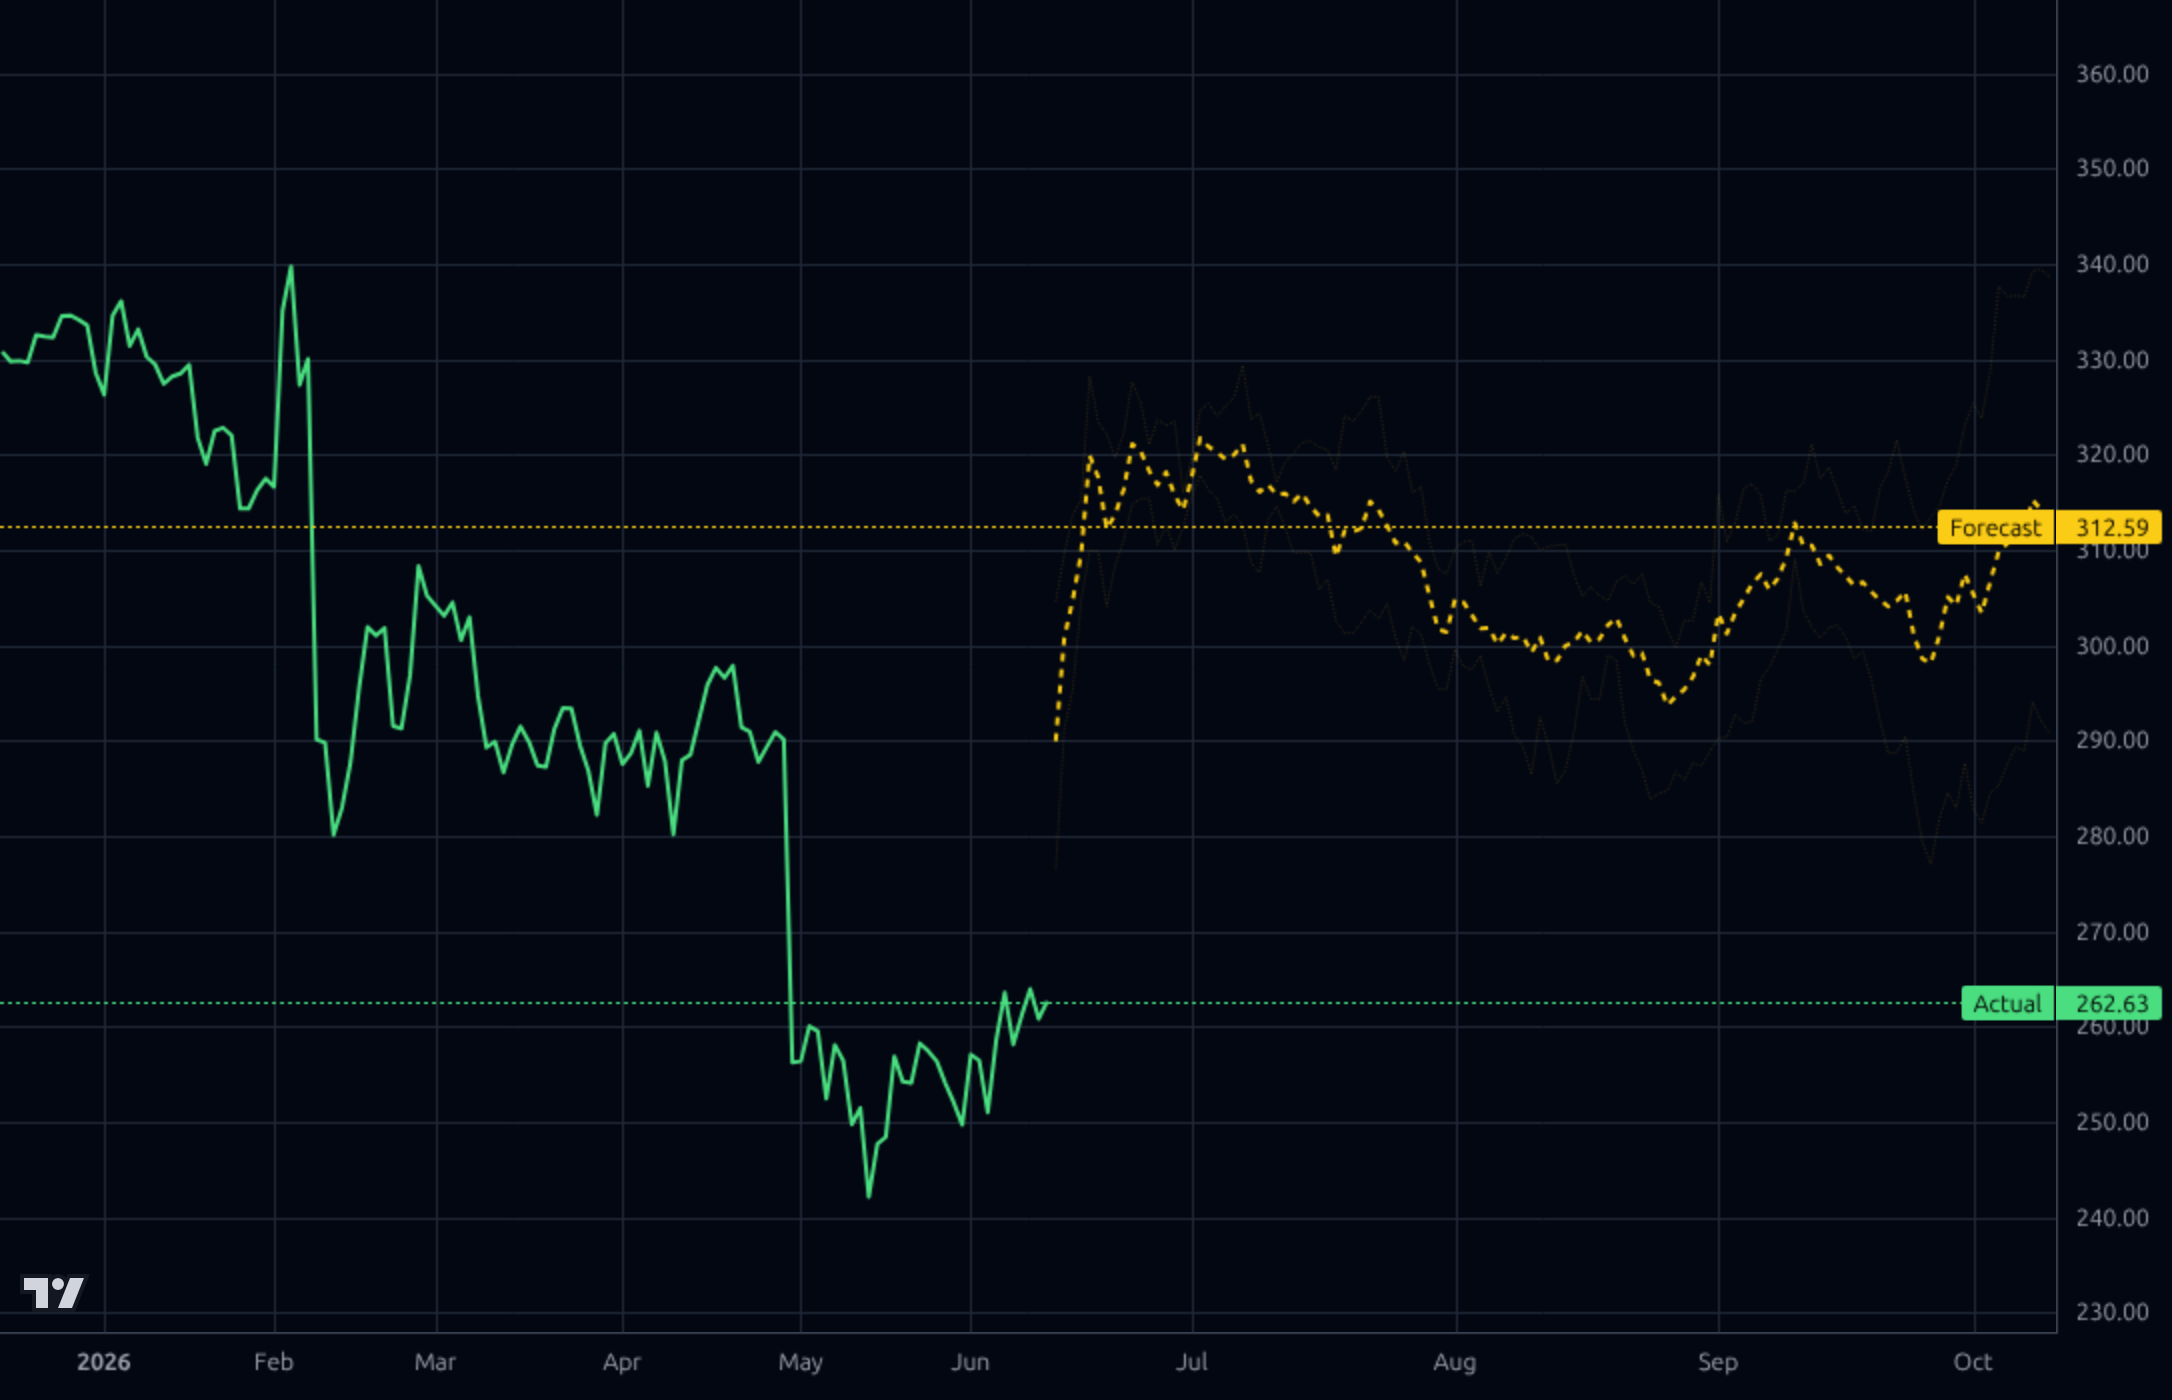
WTW trades at $262.63, down ~20% YTD and ~26% off its 52-week high of $352.79, despite solid fundamentals (ROE 20.7%, FCF >$2B, fwd P/E 11.9, PEG 0.87) and a sell-side target of $333.55. Kronos forecasts are mixed — bullish on 1h/4h intraday (290.70/320.46) but flat-to-modest on the daily/weekly (~283-312) — suggesting a tactical bounce within a still-unresolved multi-quarter downtrend. The setup favors accumulating quality at a discount, but conviction is tempered by weak relative performance and decelerating top-line growth.
1-4 weeks: Tactical long bias given Kronos 1h/4h forecasts ($290.70/$320.46), RSI 52 with room to run, and +8.5% monthly momentum. Entry zone $260-265; add on pullback to $255. Initial target $278-285 (recent swing high zone). Invalidation on a daily close below $250 — would suggest the May low is being retested. Sizing: modest starter (1-2% of portfolio) — the weekly trend is still down, so don't size like a confirmed breakout.
1-6 months: Accumulate toward a 3-4% position targeting the analyst consensus zone of $310-335 (~18-27% upside). Thesis: forward P/E 11.9 and PEG 0.87 on a 20%+ ROE insurance broker is too cheap; mean reversion plus margin expansion drives re-rating. Key catalysts: Apr 30 earnings (next print), Q2/Q3 results showing OCF normalization after the Q1 -$10M anomaly, and continued buybacks/dividend growth. Change my mind: revenue growth dipping negative, or net retention deteriorating in the Health/Wealth/Career segment.
1-3 years: Terminal thesis is a steady-compounder insurance broker benefiting from sustained hard P&C market pricing, demographic tailwinds in retirement/health consulting, and operating leverage as the Transformation program annualizes. Realistic bull case $370-400 (~15-18% IRR with dividend). Multi-year drivers: international property facility expansion, M&A optionality, and EPS growth of 13-14% (per consensus). Biggest structural risk: disintermediation by direct-to-carrier platforms or AI-driven broker compression, plus FX exposure as a UK-domiciled USD reporter. Secondary risk: any softening in P&C pricing cycle would compress brokerage commission growth.
WTW shows a high-quality insurance broker profile but with mixed near-term momentum. TTM revenue is $9.90B with only +0.92% Y/Y sales growth and 3.10% 3-yr CAGR — clearly decelerating. However, profitability is strong: operating margin 20.5%, net margin 16.8%, ROE 20.7%, ROIC 11.3%, and trailing FCF of $2.05B against a $24.8B market cap (~8.3% FCF yield). The Q1 2026 print showed revenue of $2.41B with operating income of $489M (20.3% op margin), but operating cash flow was -$10M and FCF -$65M — a working-capital seasonal drag worth monitoring vs. Q4 2025's $771M OCF. Balance sheet is leveraged but manageable: $6.91B debt vs. $1.86B cash, D/E 0.87, current ratio 1.19, and EBITDA $2.76B (net debt/EBITDA ~1.8x). Valuation is undemanding — fwd P/E 11.86, PEG 0.87, EV/EBITDA 10.77, P/FCF 15.83 — well below peers given the recurring-revenue brokerage model. Capital allocation looks shareholder-friendly with a 22.7% payout ratio and 1.46% yield. The main fundamental concern is revenue stagnation; the bull case rests on margin expansion and capital return rather than top-line acceleration.
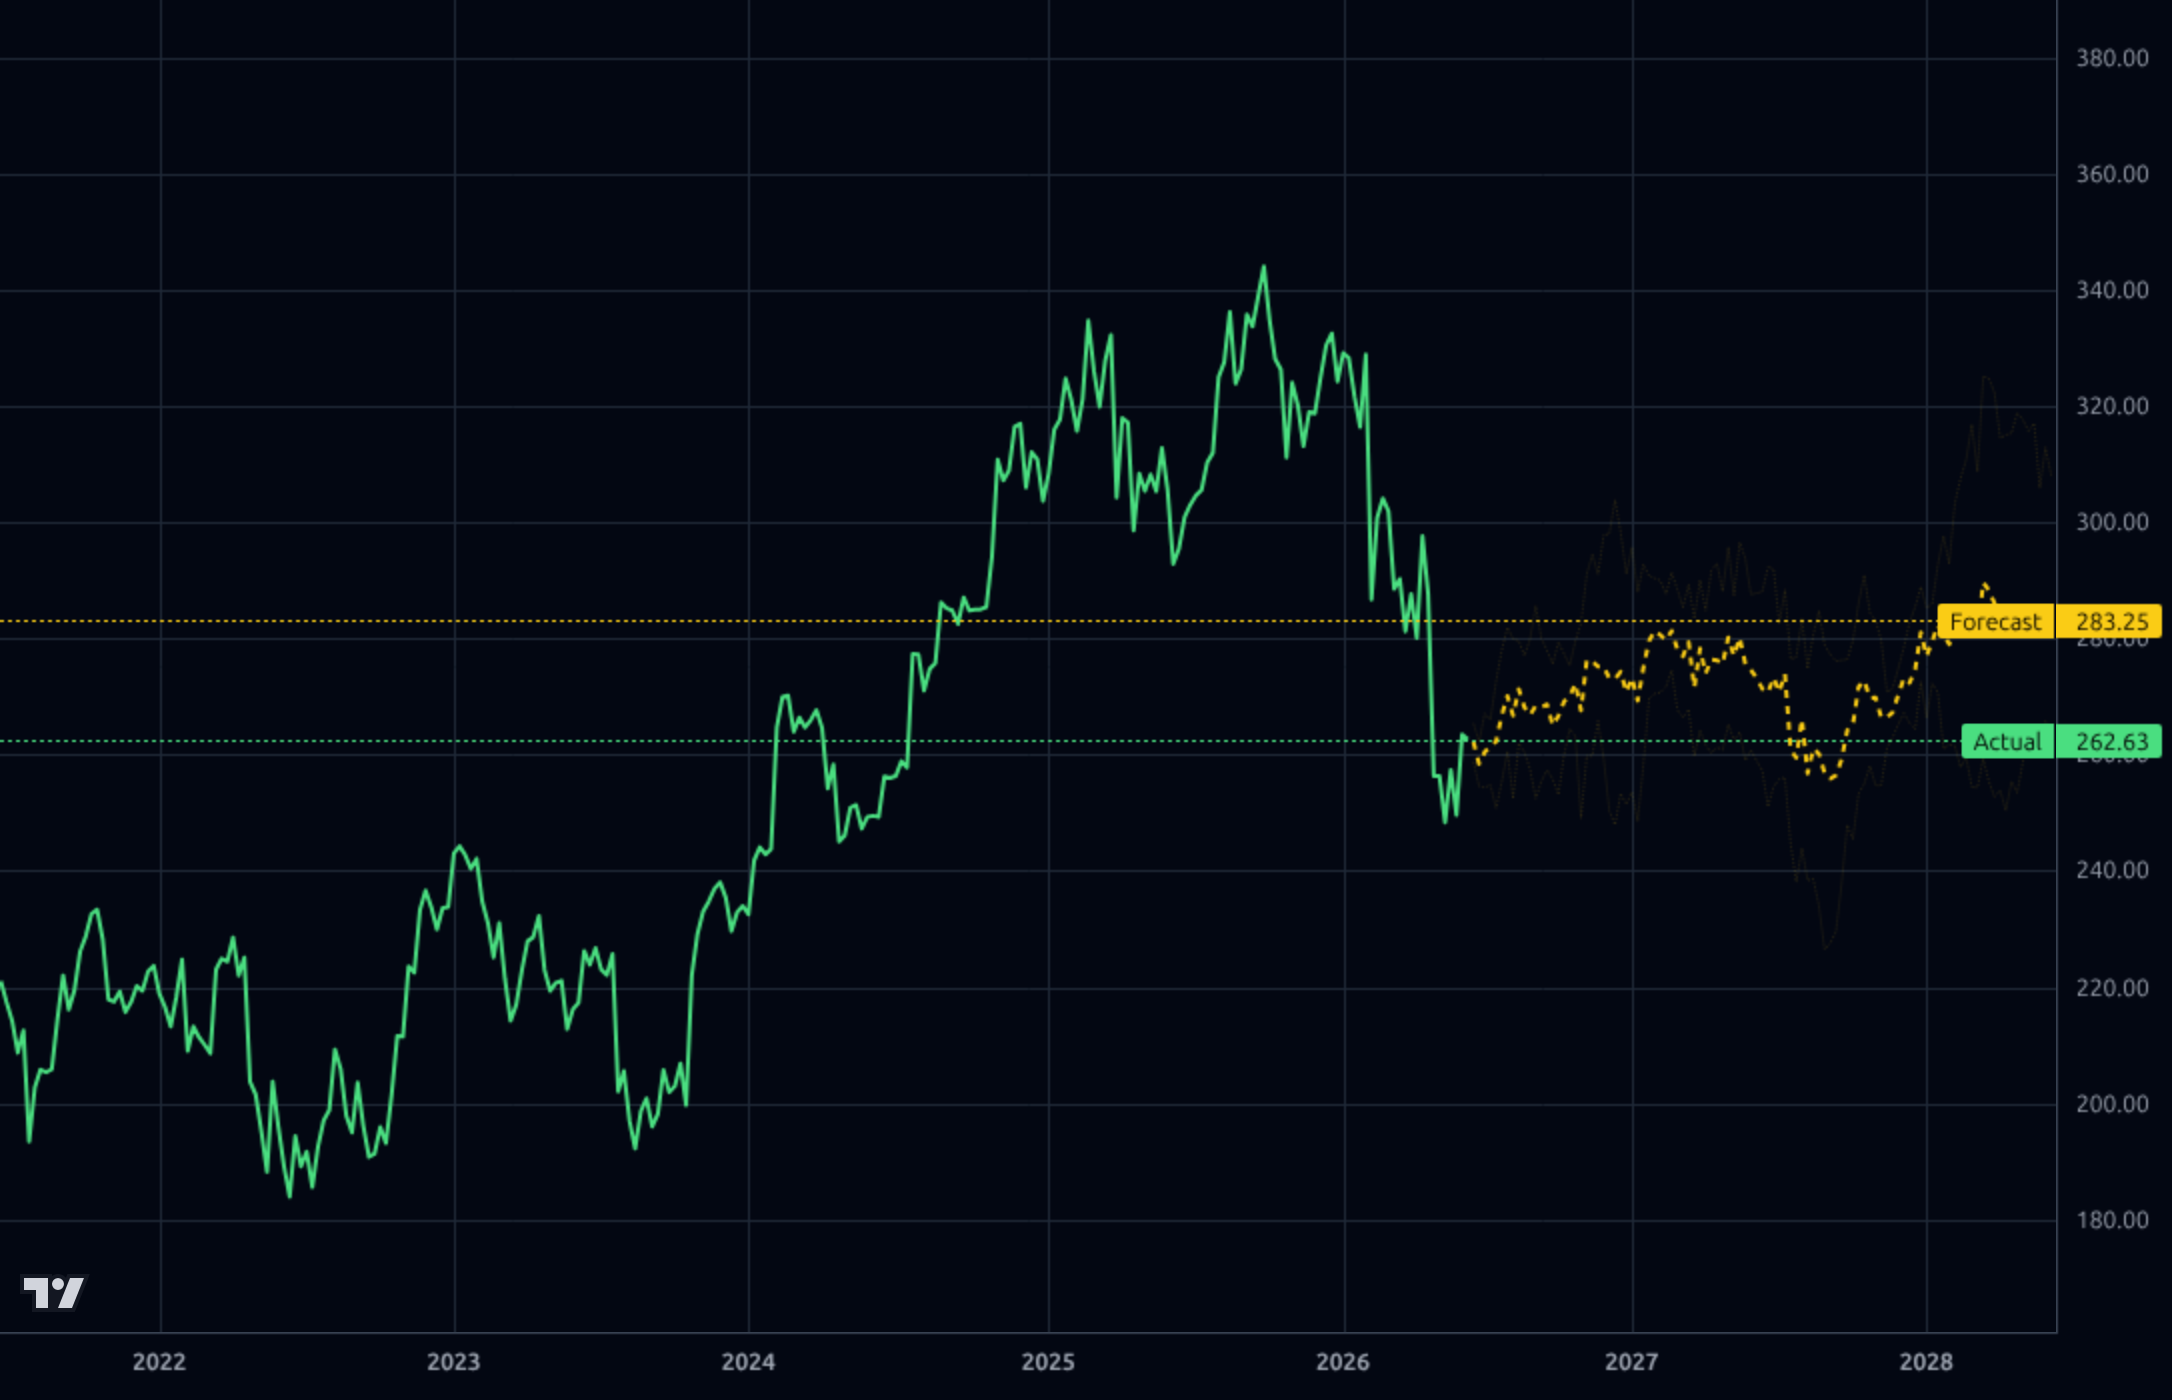
The multi-timeframe picture is conflicted. Weekly chart shows a clear distribution top — price peaked near $345 in mid-2025 and has rolled over, with the stock now at $262.63 vs. SMA200 at -14.5%, confirming a primary downtrend. The daily chart shows a sharp May capitulation to ~$242 followed by a recovery to ~$263, with Kronos projecting a sideways-to-up path averaging $312.59 over the next several months — but the forecast band is wide and includes downside back to ~$280. The 4h chart projects continuation higher to $320.46, and the 1h forecast at $290.70 implies near-term momentum is intact (RSI 52, SMA20 +2.3%, SMA50 -2.3%, Perf Month +8.5%). Key technical levels: support at $240.61 (52-wk low) and the $250 May lows; resistance at the SMA200 zone (~$307), then $320, then $352.79. The bullish_prob of 1.0 from the model aligns with the short-term setup, but the weekly downtrend has not been broken — a close above $290-295 would be needed to confirm trend reversal.
The signal in recent coverage is twofold: (1) Seth Klarman's Baupost holds a $259.6M position, flagging WTW as a value/quality name — a meaningful endorsement from a famously disciplined investor; and (2) WTW expanded its international property facility on June 8 with up to $60M follow capacity per placement via a broader Lloyd's syndicate panel, a concrete capability enhancement in a hard property-insurance market. Barchart/Yahoo note WTW has underperformed the Dow over the past year but analysts remain moderately optimistic (Recom 1.65, target $333.55, ~27% upside). Simply Wall St highlights the 19.1% YTD drawdown but +5.7% 30-day bounce, framing it as a potential value entry. The noise is mostly aggregator recycling of the same Klarman/property-facility stories. Net: incrementally constructive — institutional value buyers are accumulating, and the company is executing operationally rather than facing any disclosed scandal or guide-down.
- International property facility expansion (June 8, 2026) — up to $60M follow capacity per placement via expanded Lloyd's syndicate panel, directly grows wallet share in hard property market
- Margin expansion runway: Q4 2025 hit 35.3% operating margin vs. Q1 2026 at 20.3% — annualized normalization toward mid-20s would drive material EPS upside
- Forward EPS of $22.19 vs. trailing $17.04 implies ~30% earnings growth embedded in analyst models
- Capital return: 22.7% payout ratio leaves room for buyback acceleration given $2.05B FCF and $1.86B cash
- Risk & Broking segment leverage to sustained hard P&C insurance pricing cycle through 2026-2027
- Revenue growth has stalled — TTM sales +0.92% Y/Y, well below the 3-5Y average of 2.4-3.1%; if this persists, the value re-rating thesis breaks
- Q1 2026 operating cash flow turned negative (-$10M) and FCF -$65M — need confirmation this is seasonal working capital, not deteriorating collections
- Weekly chart shows a confirmed downtrend from $345 peak; price below SMA200 by -14.5% — momentum traders still selling rallies
- Debt load of $6.91B with D/E of 0.87 leaves limited balance sheet flexibility if a recession hits brokerage volumes
- P&C insurance pricing cycle is mature — any softening market reduces commission growth across the industry
- YTD performance -20.08% and 1Y -12.78% indicate persistent institutional selling pressure (Inst Trans -1.48%)
- AI/platform disintermediation risk to traditional broker model over a 3-5 year horizon
Get AI analysis on any stock
This is one of hundreds of Kronos AI reports — scored fundamentals & technicals, bull/base/bear price targets, a multi-horizon plan, and continuously-updated forecasts across the market. Create a free account to explore them all.
Create your free account →Already a member? Sign in · Join our Discord