YUMC — AI Stock Forecast & Price Targets
Published 9/15/2026 · A free sample of K3vl4r’s AI-powered analysis.
Kronos price forecasts, scored fundamentals & technicals, and a multi-horizon plan.
View the live YUMC price forecast →
Yum China trades at $41.69, down 11% from the prior call at $48.18 and now near 52-week lows ($40.15), with RSI at 34.85 signaling oversold conditions. Fundamentals remain solid — 12.5% operating margin, $860M FCF, 2.7% yield, forward P/E of 12.3x — but Q2 revenue growth decelerated and the stock is fighting a risk-off tape plus a broader China consumer slowdown. Setup favors accumulation into weakness with tight risk controls, not chasing.
Stock is oversold at $41.69 with RSI 34.85 sitting on major support ($40-$42 zone). Start a 1/3 pilot position here, add another 1/3 on a tag of $40.15-$40.50 (52w low retest), and reserve final tranche for a confirmed reclaim of $43. Invalidation: daily close below $39.50 — that breaks the yearly range and opens $36-$38. Upside target for a bounce is $44-$45 (SMA50/gap fill). Skip if you can't tolerate a further 5-8% drawdown before it works.
Over 1-6 months, the setup is a value-with-yield mean reversion into the Nov 4 earnings print. Base case sees the stock recover to $46-$48 as oversold conditions unwind and analysts continue upgrading estimates; bull case ($52-$55) requires a Q3 beat plus stabilization in China consumer data. Catalysts: Q3 earnings (Nov 4), any macro stimulus signal out of China, sustained margin defense above 12%. Change my mind: operating margin drops below 11%, comp sales turn negative, or CEO/Board-level insider selling appears.
1-3 year thesis rests on unit expansion (KFC and Pizza Hut store growth in lower-tier cities) compounding at high single-digit revenue growth with steady 12%+ operating margins, generating $1B+ annual FCF for buybacks and dividends. At 12x forward earnings with a 2.7% yield, you're paid to wait for a Chinese consumer normalization. Biggest structural risk is a durable step-change lower in Chinese discretionary spending or geopolitical action forcing operational restructuring — both plausible but not imminent.
Revenue trajectory is stable but decelerating: Q2 2026 revenue of $3.14B vs Q1 2026 $3.27B and Q3 2025 $3.21B — TTM sales of $12.44B with Sales Y/Y TTM of 8.78%. Margins are healthy for the restaurant space: gross 17.2%, operating 12.5%, net 7.84%, ROE 17.5%, ROIC 13.6%. Q2 operating margin slipped to 11.5% from Q1's 13.7%, worth watching against the dossier's 12% threshold. Balance sheet is workable but not pristine — $485M cash vs $2.30B total debt, current ratio 0.96, working capital swung to -$86M in Q2 from +$111M at YE 2025. Cash flow quality is a genuine strength: TTM operating cash flow $1.58B, free cash flow $860M (P/FCF ~15x), funding a 2.7% dividend (38% payout) with room. Capital allocation continues to favor unit expansion plus buybacks/dividends. Valuation is undemanding at 15.7x trailing / 12.3x forward P/E, PEG 0.94, EV/EBITDA 8.0x — cheap versus global QSR peers, appropriately discounted for China risk.
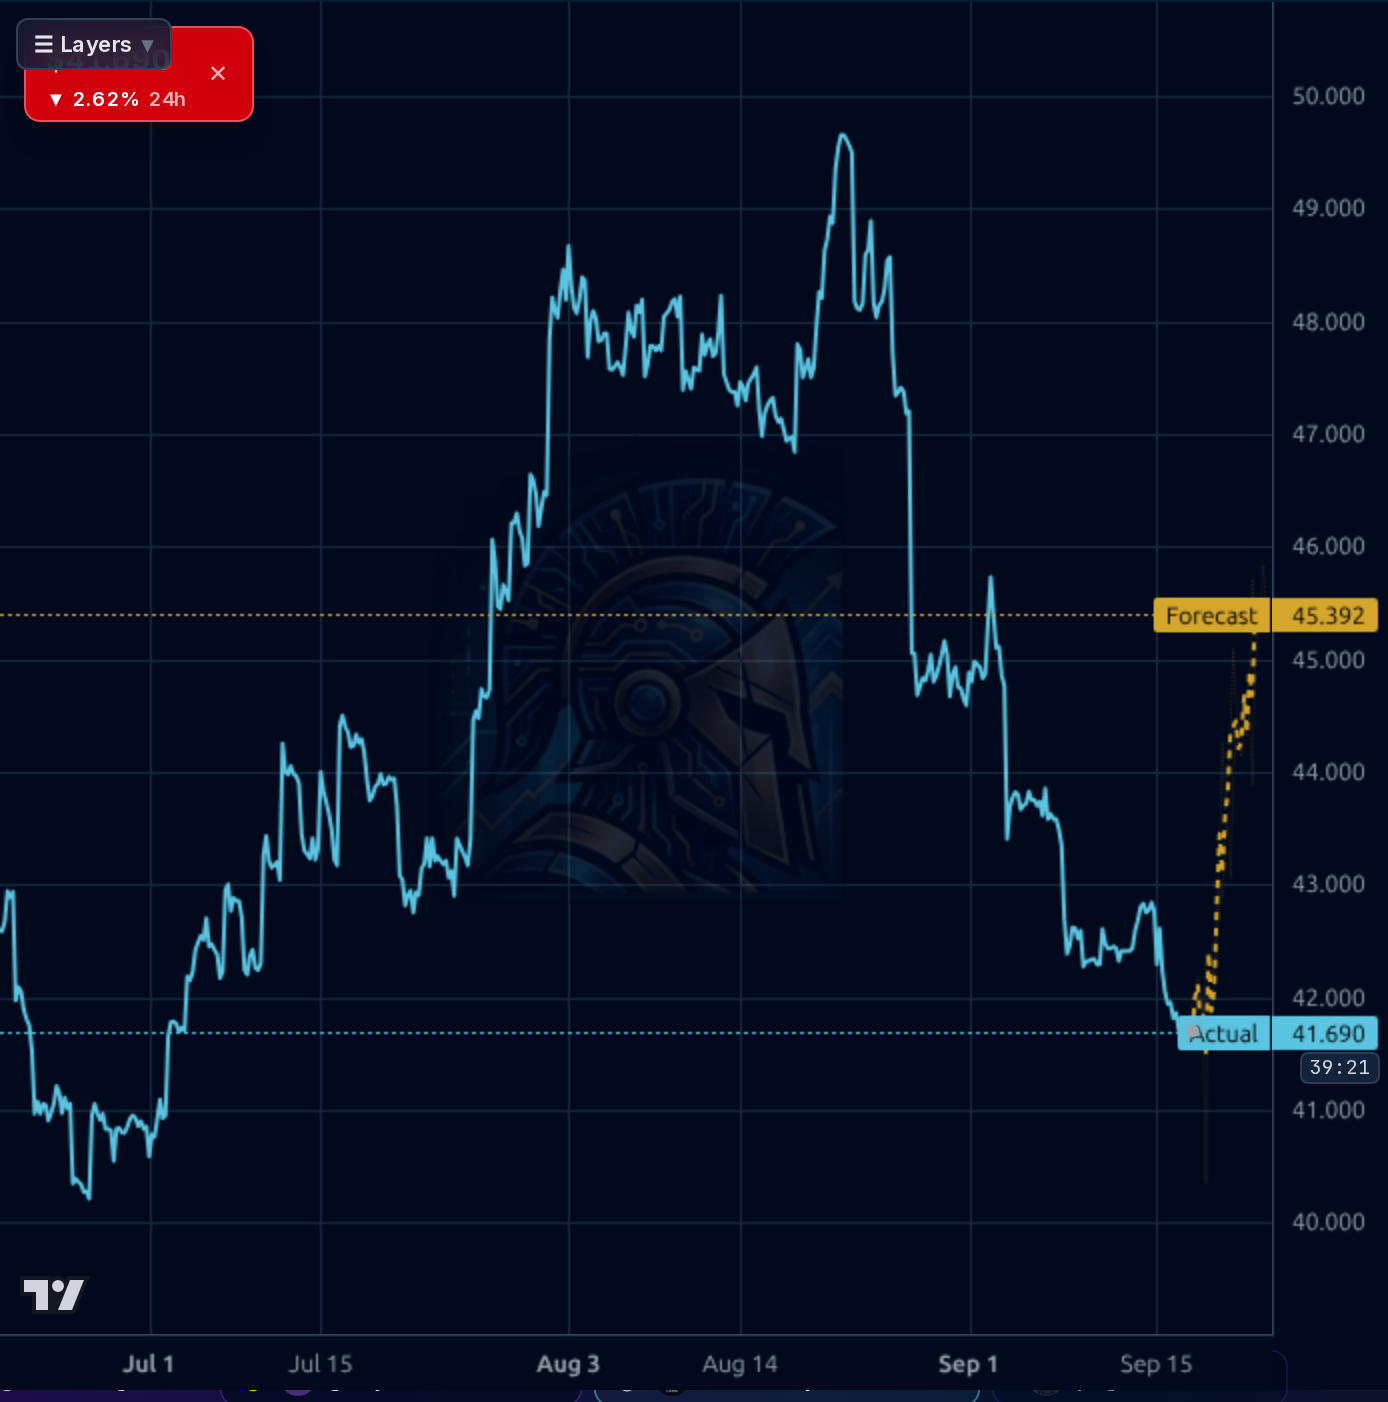
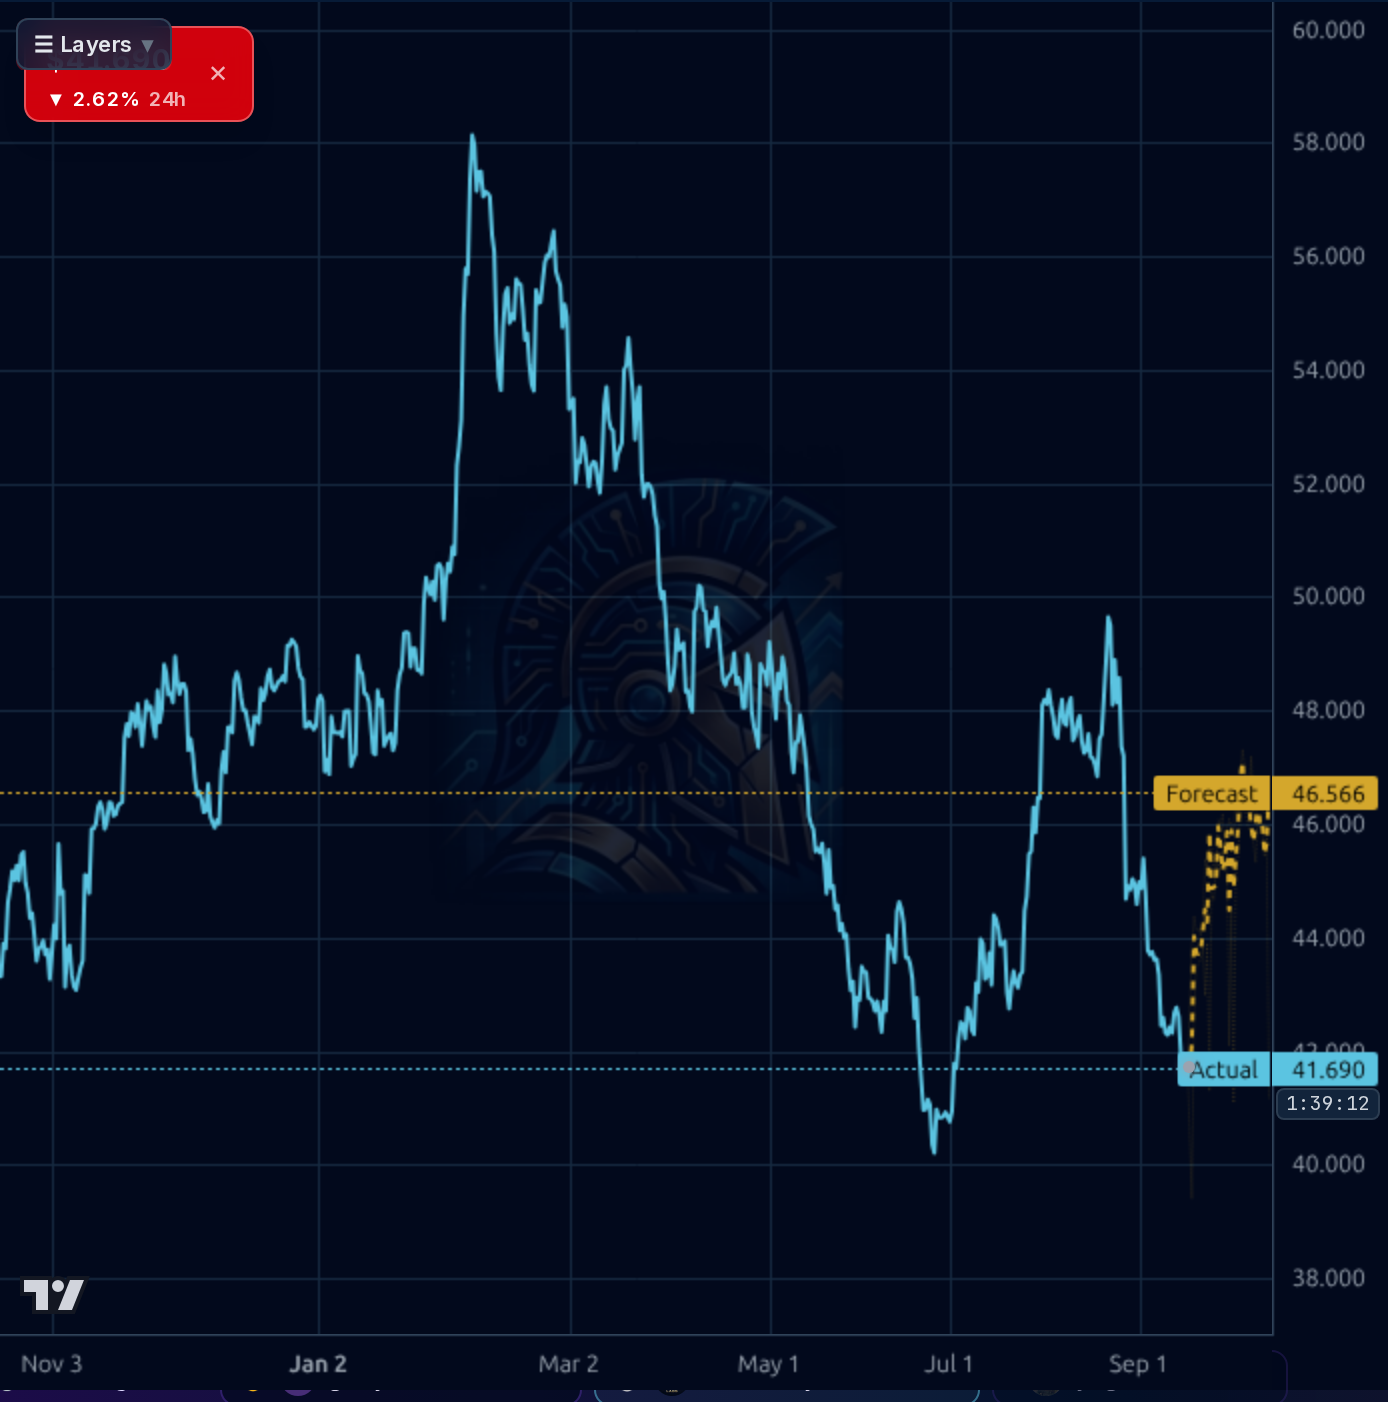
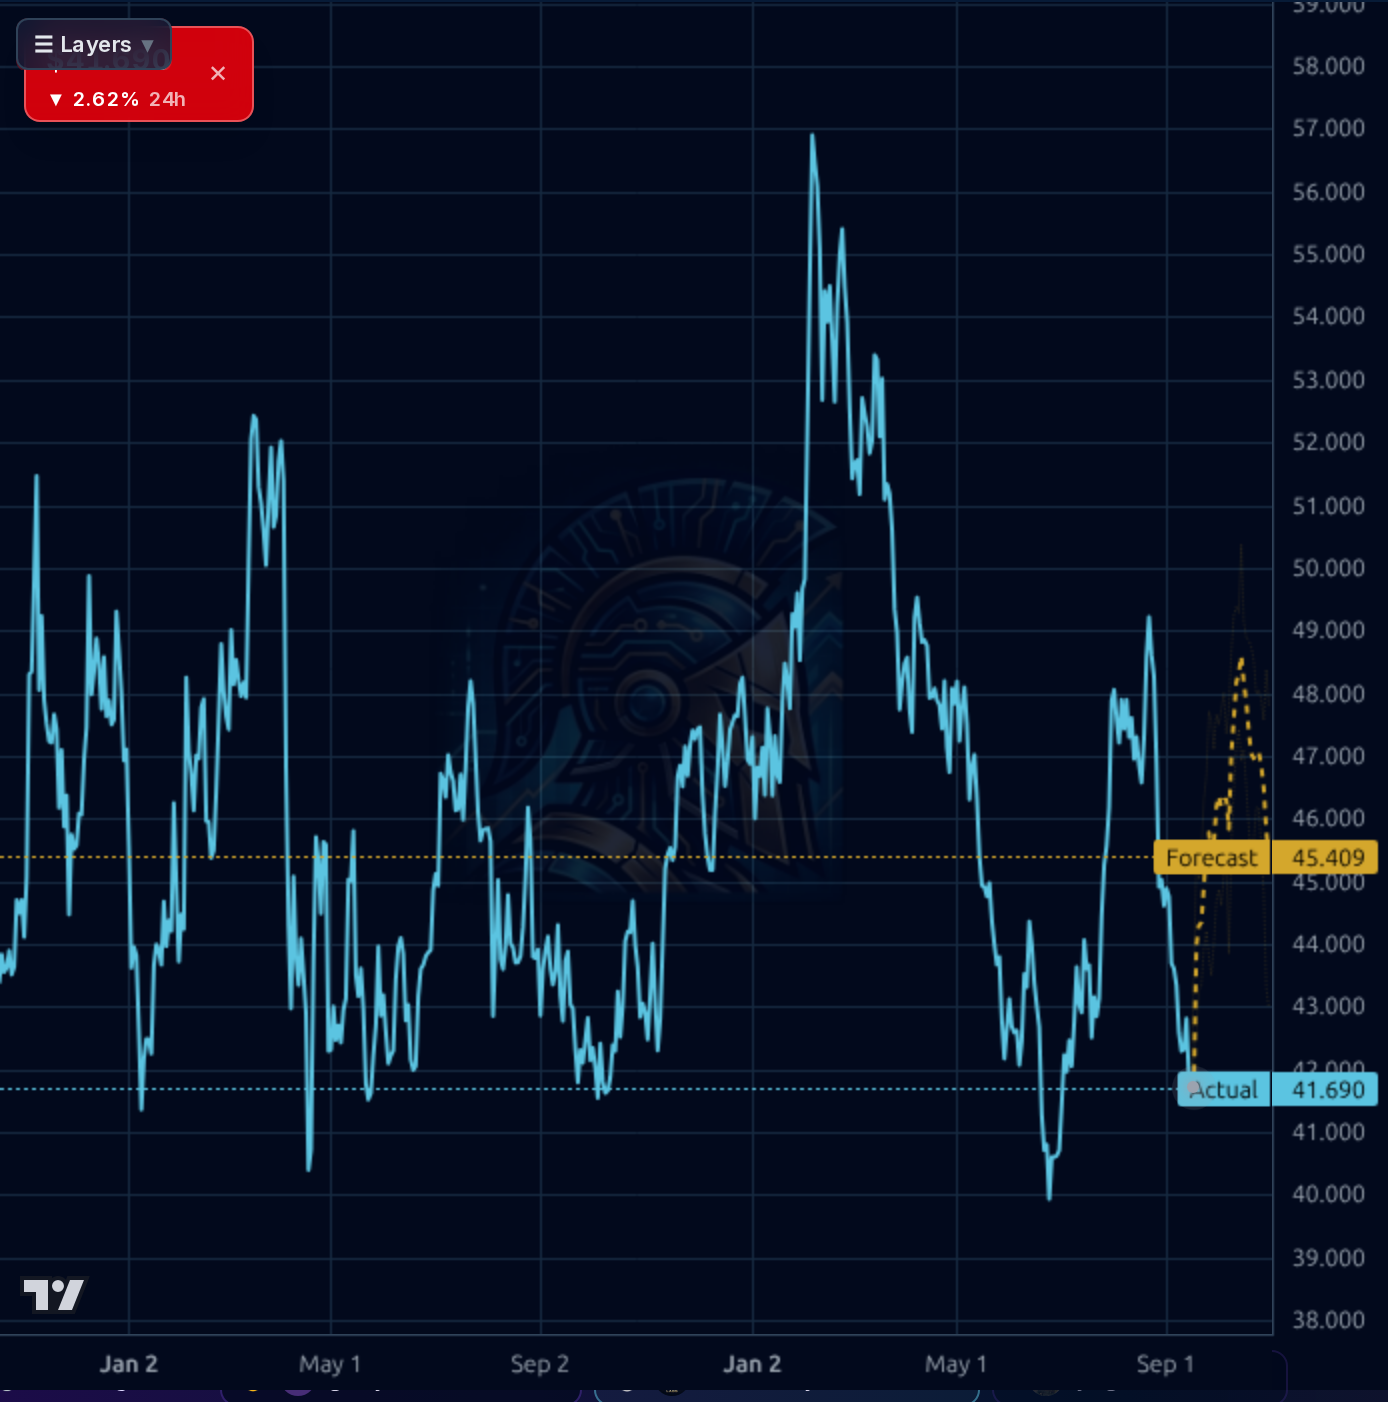
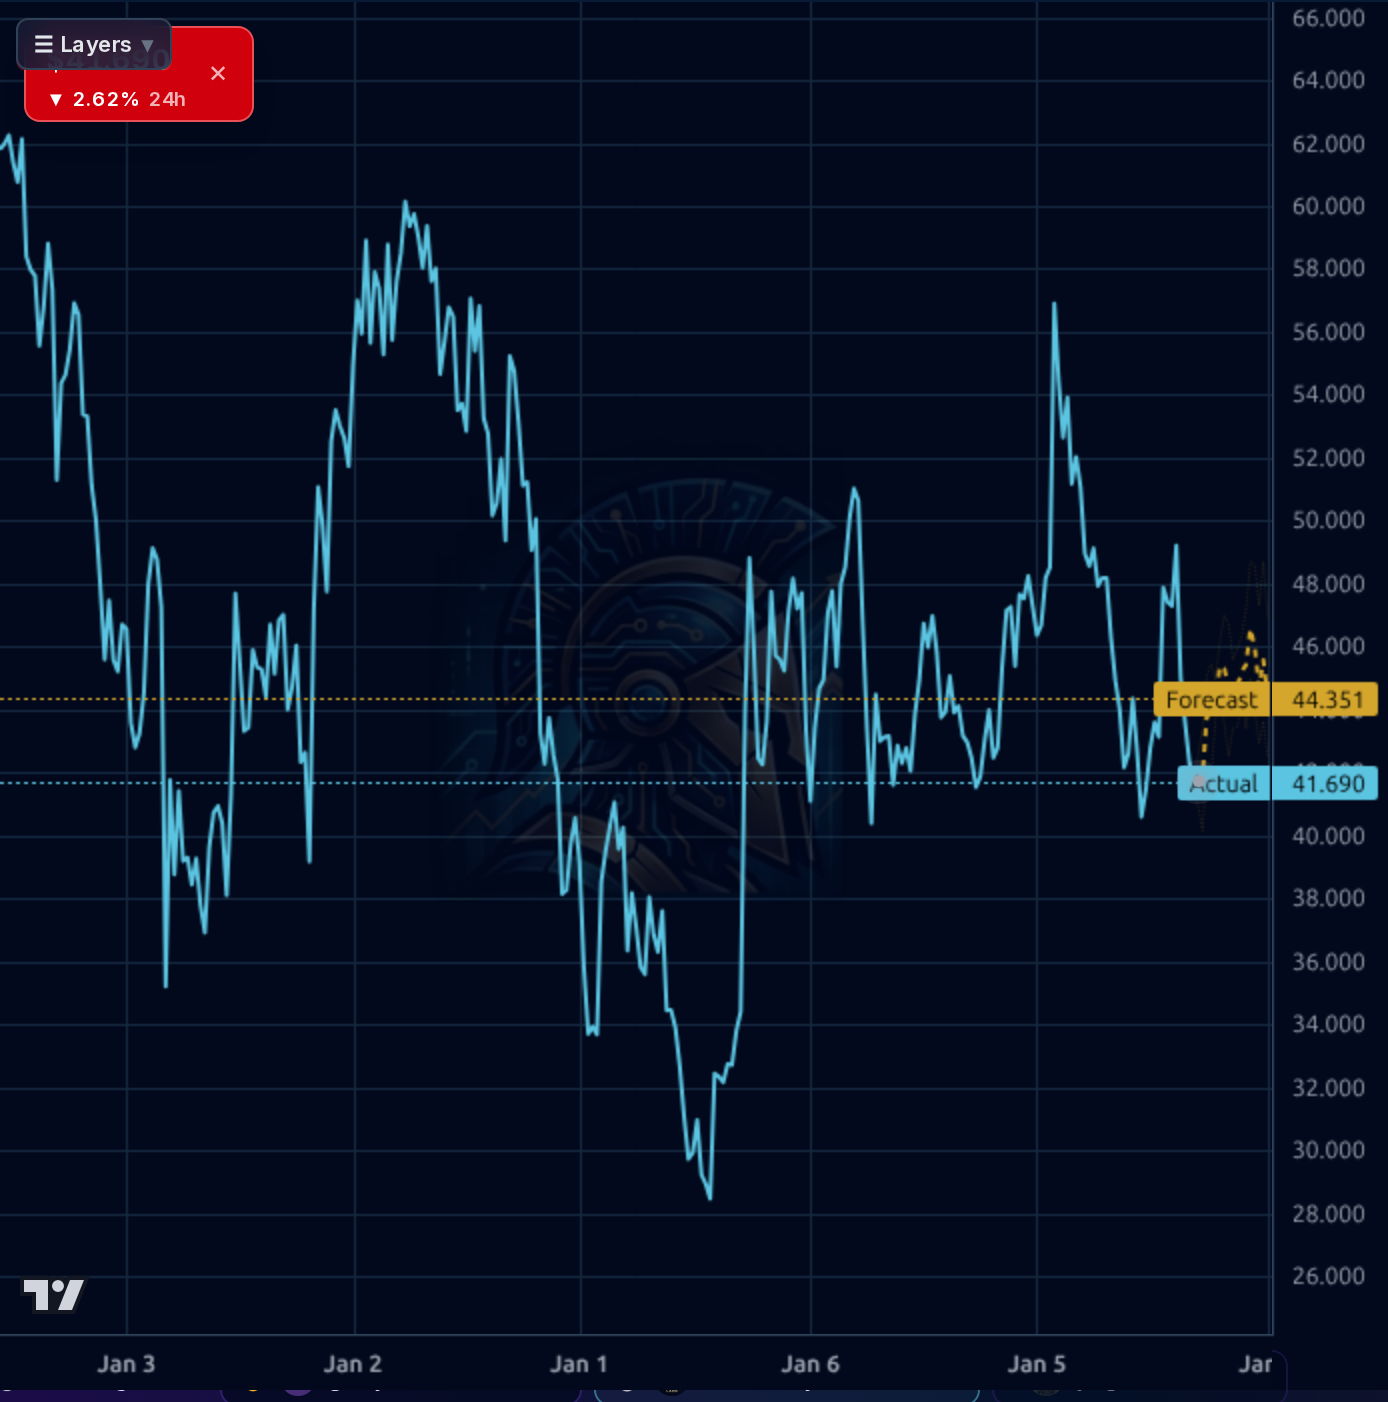
All timeframes are bearish-to-neutral. The 1h chart shows a clean top around $49.50 in early August followed by a stair-step decline to $41.69, breaking prior $43 support. The 4h chart confirms the multi-month range ($40-$48) has been re-tested at the low, with price sitting -5.9% below SMA20, -5.6% below SMA50, and -10.3% below SMA200. Daily chart shows the stock is retesting the yearly low near $40, a level that has held twice in the past 12 months. Weekly view puts price mid-range of a multi-year $28-$62 channel. RSI at 34.85 is oversold but not washed out; ATR $0.97 implies typical daily range. The AI forecast bands lean bullish across timeframes ($44-$46 targets), but the model's realized 1d directional accuracy is 44% vs a 90% naive baseline — it has been consistently wrong in the recent regime, so I discount those targets heavily. Key support: $40.15 (52w low), $38 psychological. Key resistance: $43 (broken support), $45 (SMA50 area), $48 (August pivot).
The signal in recent news is a shift in analyst tone: multiple outlets flag YUMC as oversold with Wall Street quietly raising earnings estimates (Simply Wall St, Zacks) and Zacks tagging it as a solid growth stock. The Finviz Recom of 1.24 (near strong buy) and average target of $60.64 (+42% upside) corroborate a supportive sell-side stance. The 8-K on Sep 1 was administrative (interim HK report reference), not a catalyst. Insider activity is a mild negative — three separate sell clusters in August from the Chief Supply Chain Officer (~$1.13M) and the Pizza Hut GM (~$696K) — but these are executive-level, not board/CEO, and modest against a $14.7B cap; likely diversification, not conviction. Social sentiment is skewed retail-bullish but low quality (spam-heavy). Net: the news backdrop is mildly constructive against a poor tape.
- Continued net-new store openings — 130,000 employees and management's expansion push suggest unit growth remains the primary top-line lever (TTM sales +8.8% Y/Y despite weak comps)
- Margin recovery back above 12.5% (Q2 slipped to 11.5%) as menu innovation and supply chain leverage compound
- Capital return: 38% payout ratio on 2.7% yield plus buyback capacity from $860M annual FCF supports per-share compounding even in flat-revenue years
- EPS estimate revisions higher per recent analyst coverage — forward EPS $3.38 implying 24% growth vs trailing $2.73
- China consumer discretionary spending remains weak — comp sales pressure could persist into 2026
- Q2 2026 operating margin at 11.5% is below the 12% dossier watch level; further compression breaks the resilience narrative
- Working capital turned negative (-$86M) in Q2 and current ratio 0.96 — not distressed but limits flexibility
- Insider selling by two C-suite/GM-level executives in mid-August (~$1.8M combined) — mild negative signal
- Technical breakdown risk if $40.15 fails — opens $36-$38 with no visible support
- Risk-off macro regime (breadth 44% >200dMA, deteriorating) means fundamentally cheap names can get cheaper
- Geopolitical/regulatory overhang on US-listed China ADRs is a persistent tail risk
Get AI analysis on any stock
This is one of hundreds of Kronos AI reports — scored fundamentals & technicals, bull/base/bear price targets, a multi-horizon plan, and continuously-updated forecasts across the market. Create a free account to explore them all.
Create your free account →Already a member? Sign in · Join our Discord