ZTS — AI Stock Forecast & Price Targets
Published 8/6/2026 · A free sample of K3vl4r’s AI-powered analysis.
Kronos price forecasts, scored fundamentals & technicals, and a multi-horizon plan.
View the live ZTS price forecast →
Zoetis is a best-in-class animal health franchise (37% op margin, 67% ROE, ~10x fwd EPS) that has been violently re-rated to $74 after a −49% YoY drawdown, and sits directly on top of a binary Q2 print tomorrow (Aug 6 BMO). The setup is objectively cheap with washed-out sentiment and a Burry-endorsed thesis, but prior calls have systematically over-estimated upside, the tape keeps rejecting bounces, and one social leak hints at another guidance cut — the disciplined stance is HOLD flat into the print, no chase.
HOLD flat into the Aug 6 BMO print. Do NOT add or short into a binary event on a name where prior optimistic targets have systematically failed to print. Options are pricing a large move (ATR 2.49, 3.5% daily vol). Post-print playbook: (a) if it holds above $75 and the FY guide is reaffirmed or trimmed only modestly, small starter accumulate toward $78–$80 with a stop under $71.47; (b) if the 52W low $71.47 breaks on a guide-down, stand aside and reassess — next support is the $68–$70 zone; (c) if it gaps up through $80 on a clean beat + reaffirmed guide, chase is off the table given the fade history, wait for a pullback to reclaim SMA20. Invalidation of the constructive setup: any decisive close below $71.
1–6 month base case is a range-bound consolidation between $70 and $88 while the market waits for two consecutive quarters of margin/US companion-animal stabilization. Expected return range: −8% to +18% skewed by the print. The re-rate catalyst is not the print itself but the SECOND print that proves Q1's cut wasn't the floor — patience past this earnings gets you a better entry than chasing. Change my mind: (i) two-quarter stabilization of US companion animal revenue with flat-to-up gross margin, (ii) management pausing debt-funded buybacks to repair equity, (iii) demonstrable Lenivia/Portela ramp visible in segment disclosure. Downside change: a second guide-cut, further sequential margin compression, or credible new litigation disclosure.
1–3 year terminal thesis: at 10x forward EPS with 37% op margins and $1.78B+ FCF, ZTS is priced for permanent low-single-digit growth. If the animal-health secular story (pet humanization + livestock health) reasserts and management restores 5–7% organic growth, a re-rate toward 14–15x on $8+ EPS supports $110–$120 in 2–3 years. Biggest structural risk is that companion-animal spending is more discretionary than the market previously modeled — if that's the true secular signal from Q1's guide-cut, the multiple stays capped in the low teens and the balance sheet leverage (debt/equity 2.86x) becomes the constraint rather than a footnote. Bull path requires both operational proof AND capital-allocation discipline.
Unit economics remain elite in absolute terms — gross margin 71.8%, operating margin 36.6%, ROE 67%, ROIC 21%, and $1.78B FCF against a $31B market cap (P/FCF 14.6, EV/EBITDA 9.5, fwd P/E 10.1) — objectively cheap for this franchise. But the quarterly trend is unambiguously deteriorating: revenue slipped from $2.46B (Q2'25) → $2.40B → $2.39B → $2.26B (Q1'26), operating income collapsed from $989M → $822M over the same window, and net margin compressed ~300bps to 26.6%. Gross margin has slipped ~200bps sequentially. The balance sheet is the real bruise: debt/equity 2.86x, total debt $9.24B vs $3.23B equity (equity has been drawn down by aggressive debt-funded buybacks — stockholders' equity fell from $5.40B in Sep'25 to $3.23B in Mar'26). Q1 FCF also stepped down hard to $291M from $732M/$805M in the prior two quarters. Bottom line: franchise quality is genuine, but the cash-flow/margin trajectory is sequentially broken, and management burned credibility with a May guide-down after guiding above Street just three months earlier.
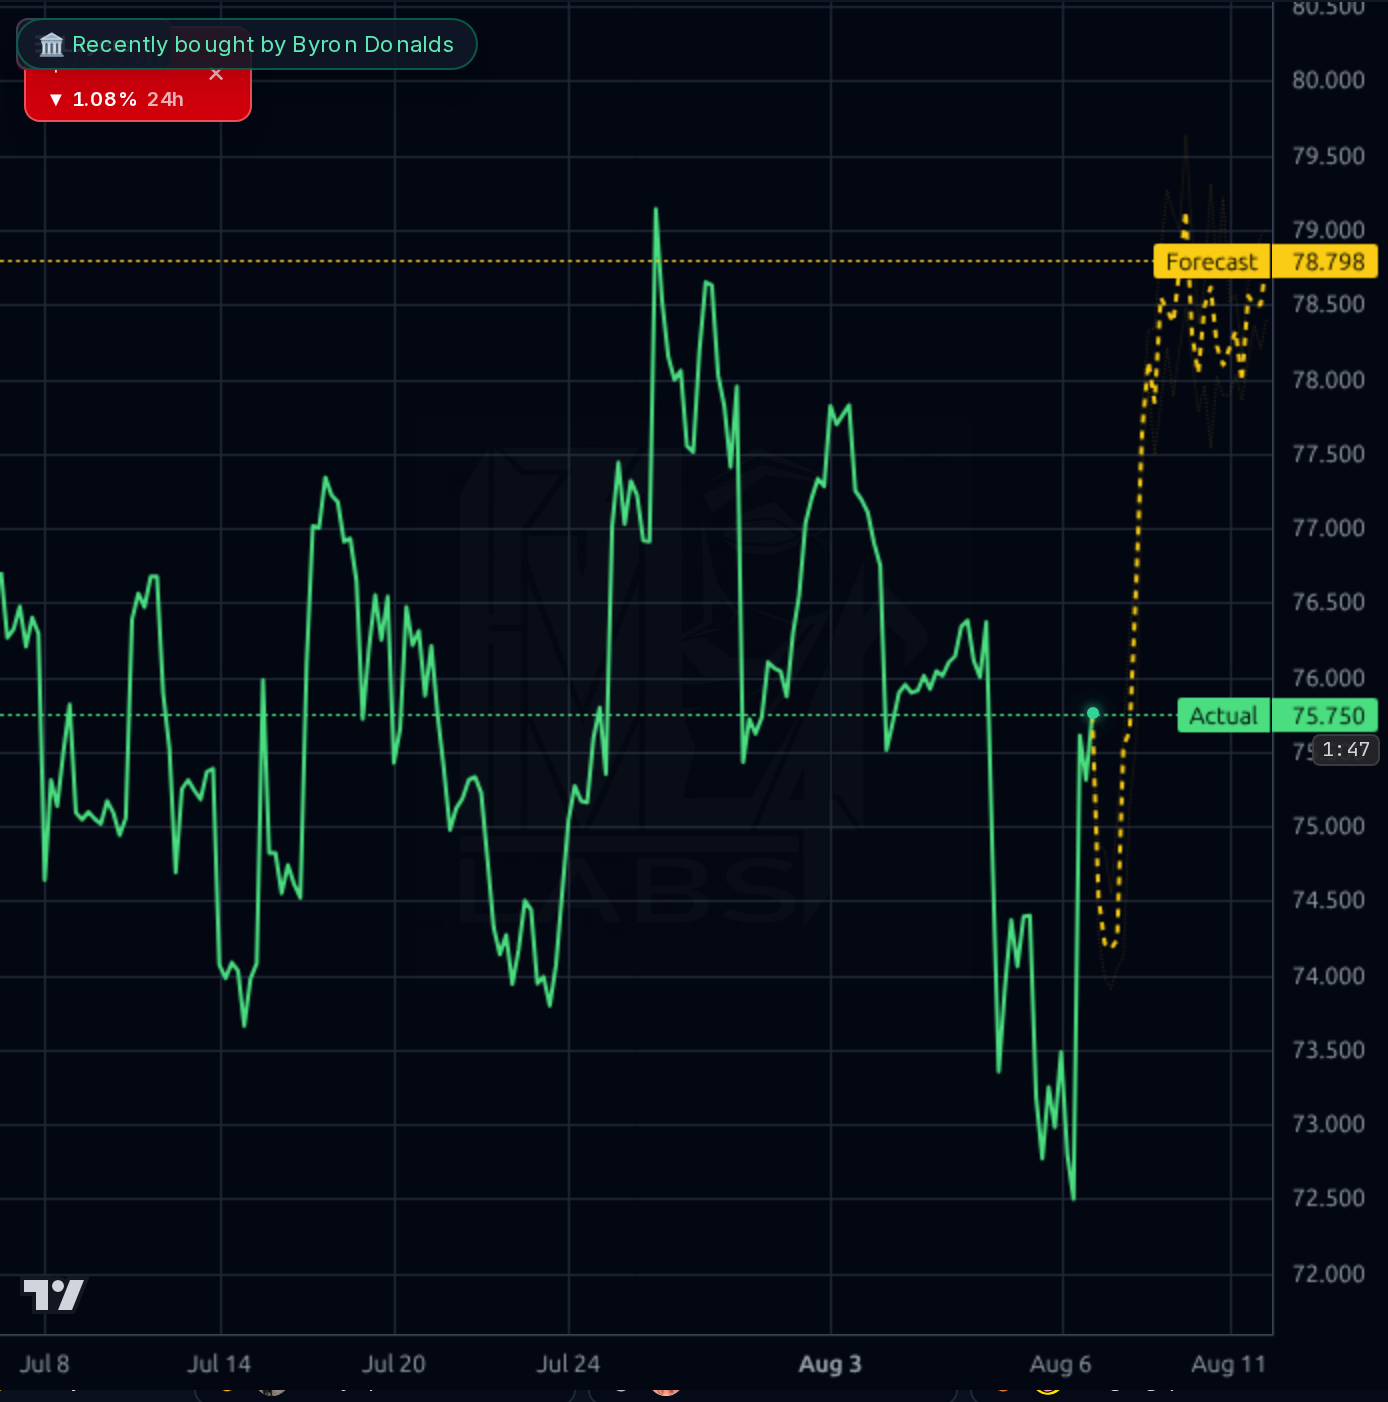
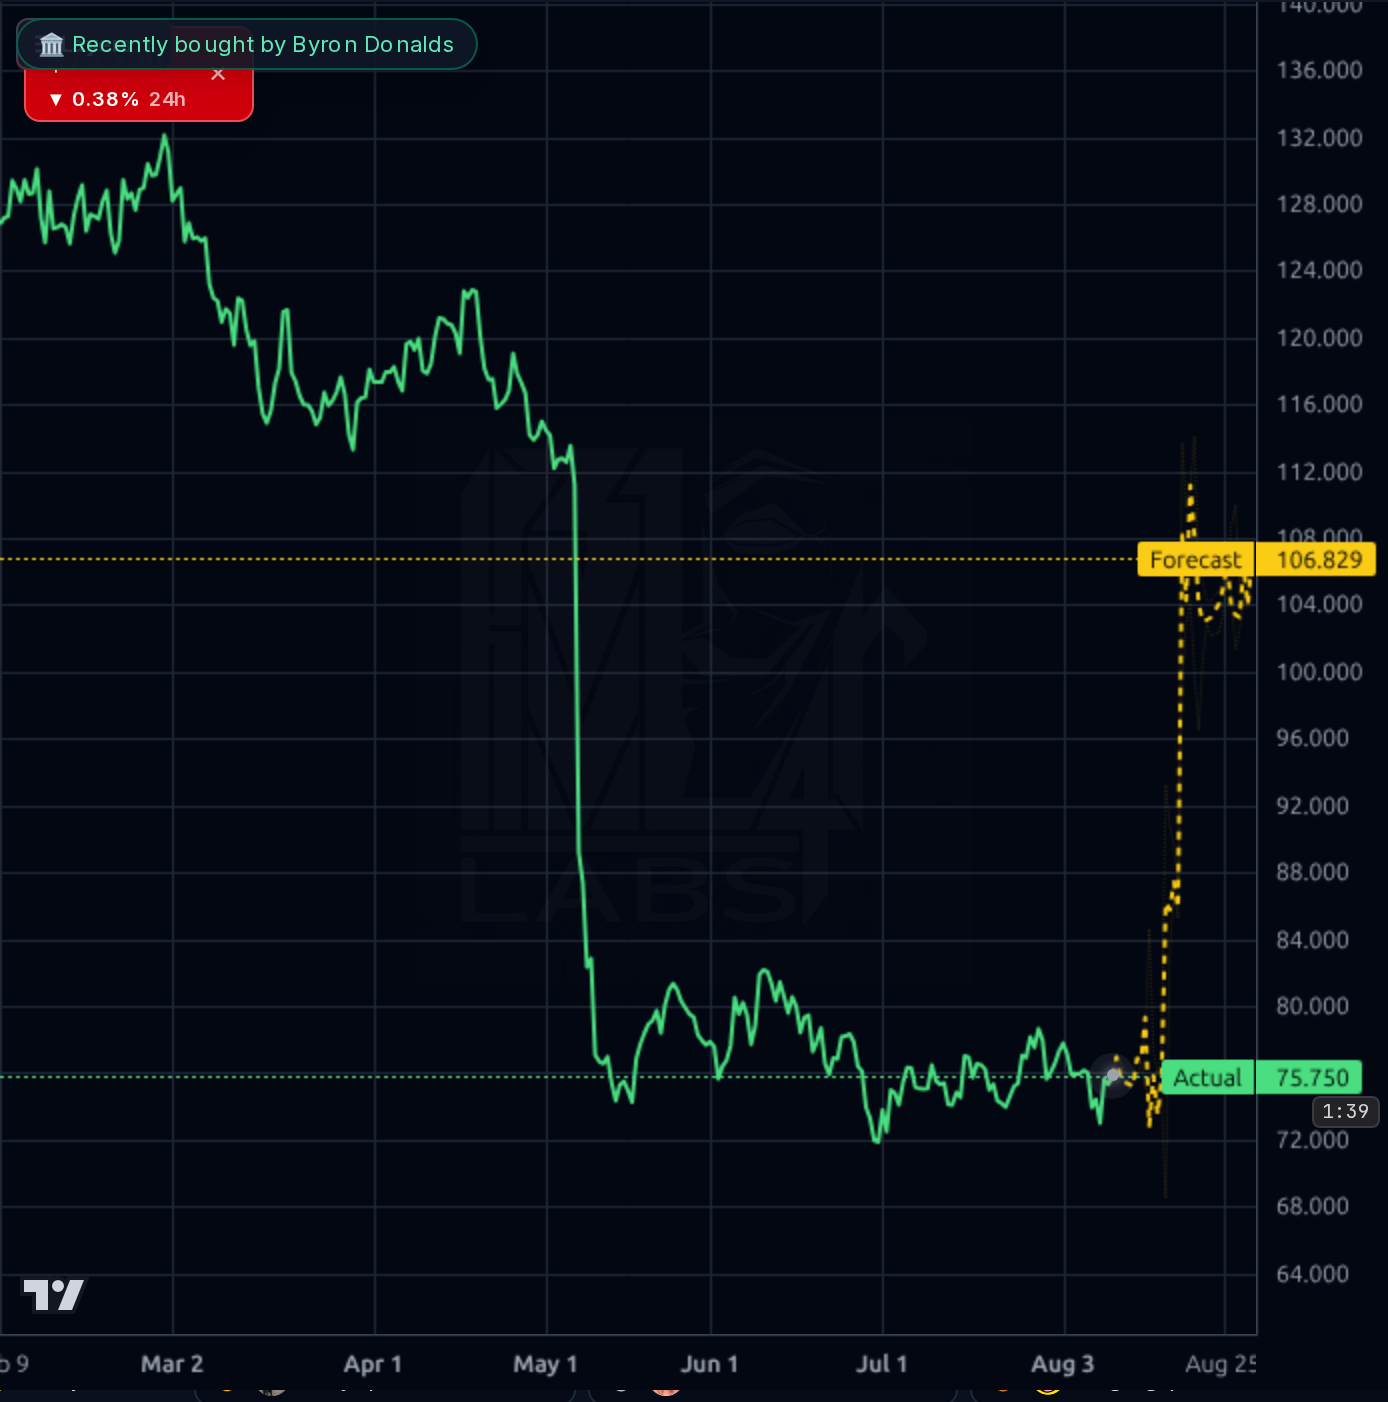
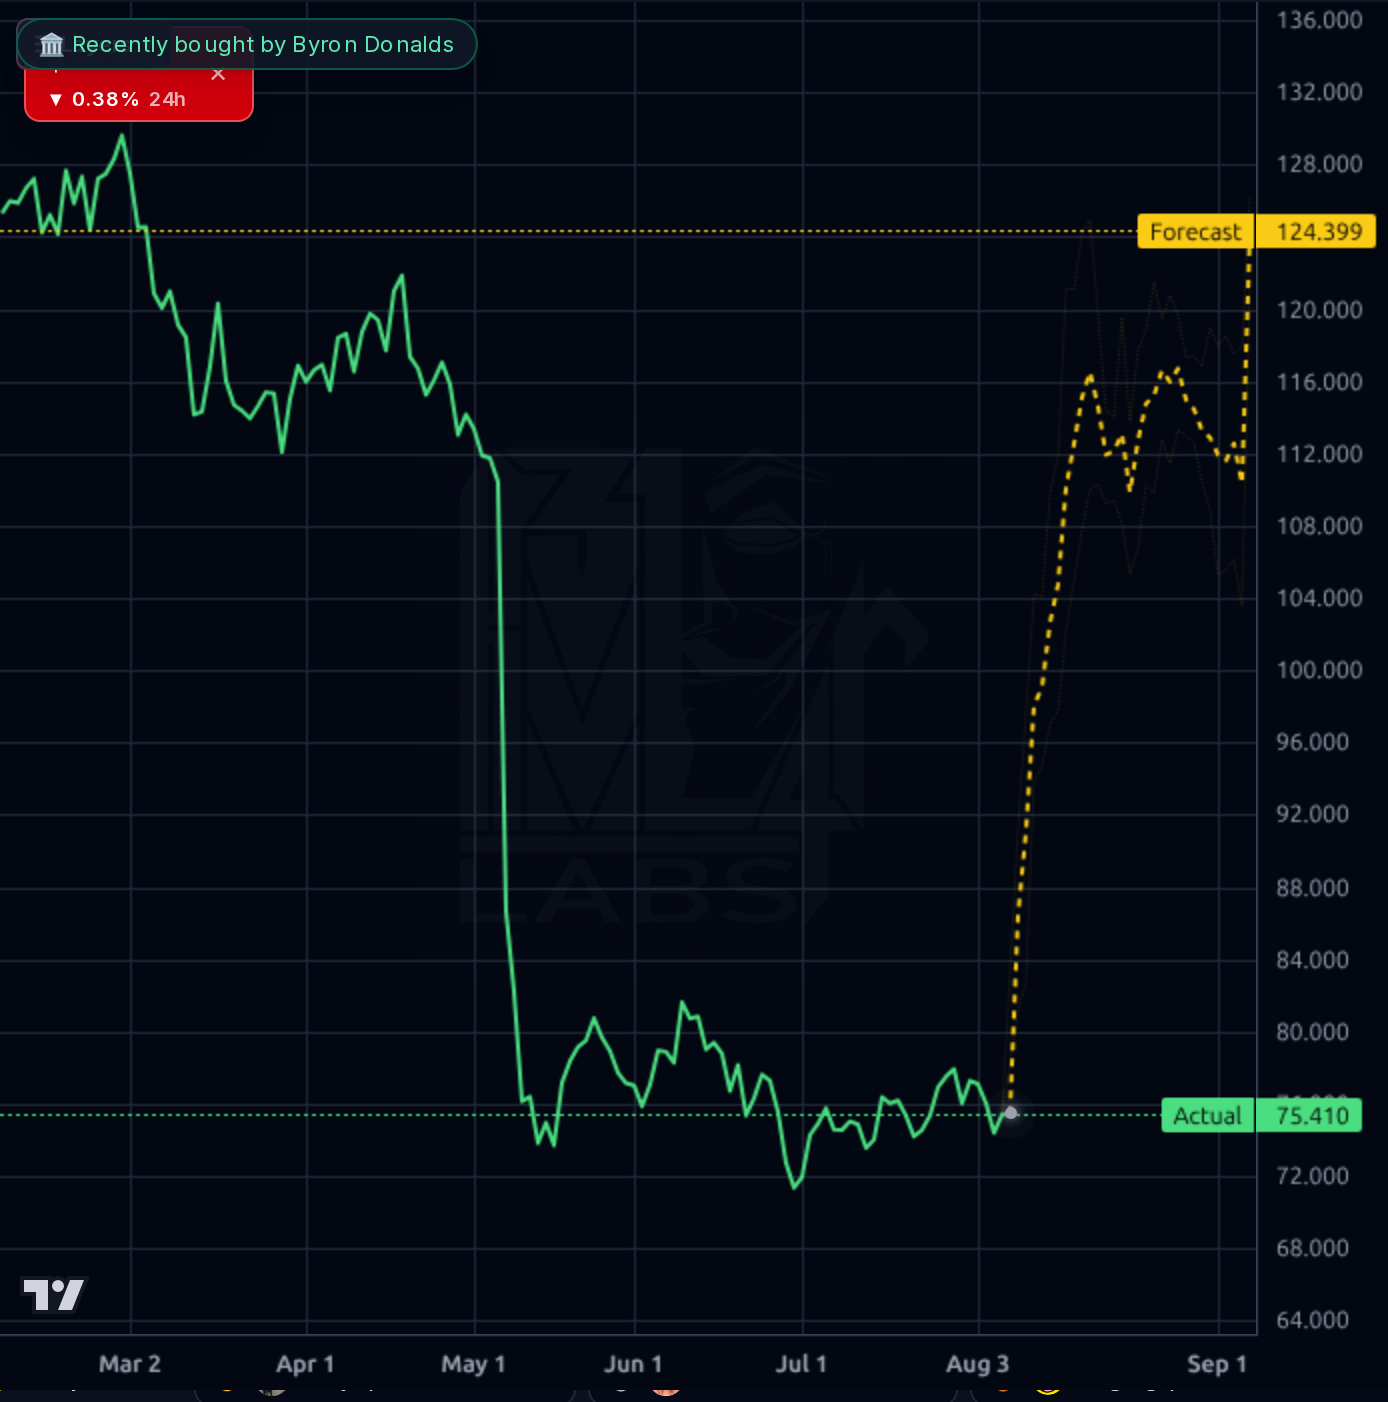
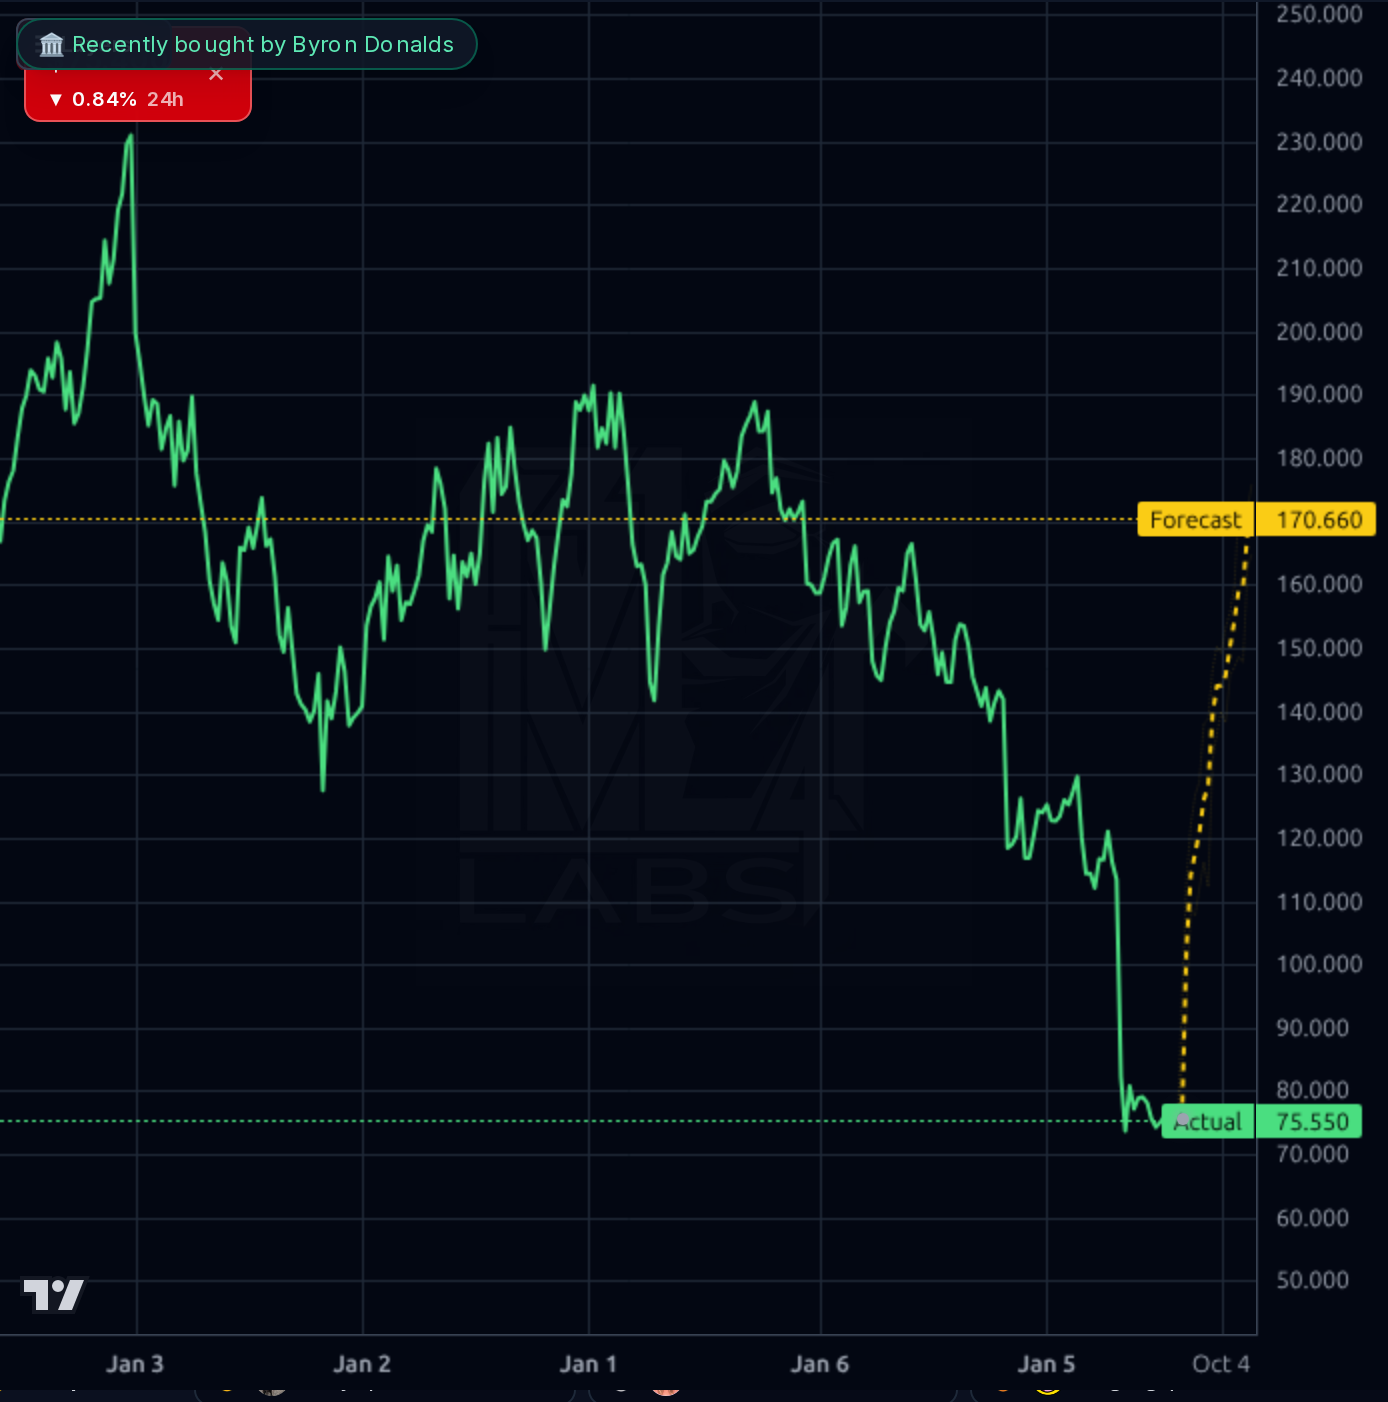
The primary trend is decisively broken. Weekly shows a stair-step collapse from ~$230 to $74 (−68%), with price parked at the 52-week low ($71.47) and −53.6% from the 52-week high. Daily/4h charts show the May capitulation flush from ~$115 to sub-$75 with no meaningful base yet — price is oscillating $72–$78 and repeatedly failing to reclaim $80. RSI 42, SMA20 −1.9%, SMA50 −3.3%, SMA200 −32%; all averages are stacked bearishly. The 1h chart shows a fresh flush to ~$73.5 with the model calling a mean-reversion snap to ~$78.8, and the 4h/1d models paint aggressive V-recoveries into the $107/$124 zone — but realized MAPE on the daily model is 40%, and the widening high/low band on higher timeframes signals low confidence. Key levels: support $71.47 (52W low, must hold on any earnings gap-down), resistance $78 (SMA20/gap-fill), then $84 (May breakdown pivot). Note the 1h forecast pattern where the model draws a sharp dip-then-rip through the print — treat the specific shape as low-signal.
The dominant catalyst is Q2 2026 earnings, confirmed for Aug 6 BMO with consensus at ~$1.84 EPS and ~$2.50B revenue. Backdrop is unambiguously mixed: Michael Burry increased his position (contrarian value tell), sell-side lowered its price target by ~14% to $108, EPS-estimate-next-year revisions ticked up +5.1pp (bullish signal), and management is pushing 12 pipeline candidates including new OA therapies rolled out in Canada/EU. Counterweight: the May Q1 miss/guide-down remains the tape's memory, competitive OA safety concerns are cited by analysts, and one social-media message purports to already show a Q2 print of $1.65 GAAP EPS / $2.47B revenue with another guidance revision — this is UNVERIFIED and I discount it heavily, but it's directionally consistent with the persistent narrative that even reduced FY26 guidance ($6.85–$7.00) may be under pressure. Congressional buy (Byron Donalds, small size) is slow-money-positive but not actionable. Broader tape is risk-on with cyclical leadership, which is a modest tailwind for a beaten-down value name IF it can stabilize.
- Aug 6 Q2 print is binary — another guide-cut would break the $71.47 52W-low and open the $65–$68 zone
- US companion-animal secular weakness may be structural, not cyclical — competitor intensification and consumer price sensitivity are eroding pricing power
- Balance sheet: debt/equity 2.86x with equity drawn down ~40% in 6 months by debt-funded buybacks — a covenant/rating concern if margins keep compressing
- Management credibility: guided FY26 above Street in Feb, cut hard in May — Street now discounts forward commentary
- Litigation overhang from ongoing class-action creates disclosure uncertainty
- Technical: entire long-term trend is broken; 52W high $160 is a distant memory, and bounces have systematically faded
- Model forecasts on this name have run 40% MAPE and prior base-case targets have missed by an average +16% — discount all rebound calls including this one
Get AI analysis on any stock
This is one of hundreds of Kronos AI reports — scored fundamentals & technicals, bull/base/bear price targets, a multi-horizon plan, and continuously-updated forecasts across the market. Create a free account to explore them all.
Create your free account →Already a member? Sign in · Join our Discord